Gosport's population decreased
Between the last two censuses (held in 2011 and 2021), the population of Gosport fell by 0.8%, from just over 82,600 in 2011 to around 82,000 in 2021.
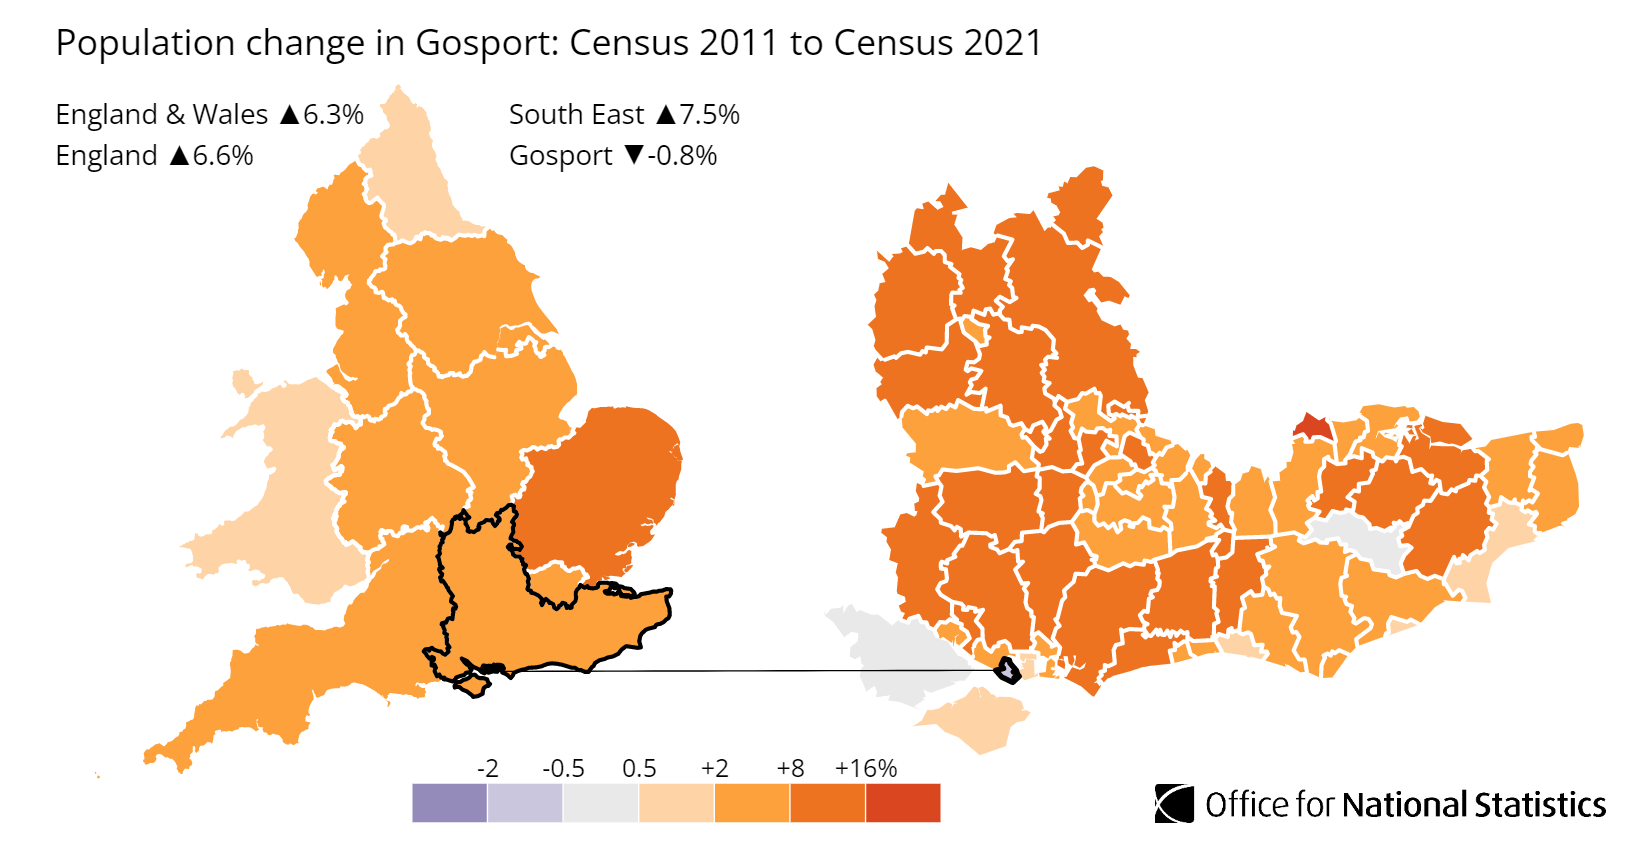
This means Gosport was one of only two local authority areas in the South East to see its population decline. The regional population increased by 7.5%, while the population of England increased by 6.6%.
In 2021, Gosport was home to around 23.1 people per football pitch-sized piece of land, compared with 23.2 in 2011. This area was among the top 20% most densely populated English local authority areas at the last census.
This article generally uses percentages to enable comparisons over time and between areas. The percentage point change is also used to show the difference between the 2011 and 2021 percentages.
The population of Gosport decreased by around 0.8%
Percentage population change, Gosport and surrounding areas, 2011 Census to Census 2021
England ▲6.6% South East ▲7.5% Gosport ▼-0.8%| -2 | -0.5 | 0.5 | +2 | +8 | +16% |
Save as image (PNG <200KB) | Download the data (CSV <100KB) |
An older Gosport
Between the last two censuses, the average (median) age of Gosport increased by three years, from 40 to 43 years of age.
This area had a higher average (median) age than the South East as a whole in 2021 (41 years) and a higher average (median) age than England (40 years).
The median age is the age of the person in the middle of the group, meaning that one half of the group is younger than that person and the other half is older.
The number of people aged 65 to 74 years rose by around 2,200 (an increase of 30.0%), while the number of residents between 35 and 49 years fell by around 2,800 (15.7% decrease).
The share of residents aged between 65 and 74 years increased by 2.7 percentage points between 2011 and 2021
Percentage of usual residents
by age group,
| 85 years and over | 2.4 | 2.9 | 2.5 | 2.7 | 2.2 | 2.4 | 2.4%
2.9% |
|---|---|---|---|---|---|---|---|
| 75 to 84 years | 5.9 | 7.1 | 5.8 | 6.5 | 5.5 | 6.1 | 5.9%
7.1% |
| 65 to 74 years | 8.7 | 11.4 | 8.8 | 10.2 | 8.6 | 9.8 | 8.7%
11.4% |
| 50 to 64 years | 18.7 | 21.1 | 18.5 | 19.8 | 18.1 | 19.4 | 18.7%
21.1% |
| 35 to 49 years | 21.2 | 18.0 | 21.7 | 19.7 | 21.3 | 19.4 | 21.2%
18.0% |
| 25 to 34 years | 12.5 | 12.3 | 12.4 | 12.4 | 13.5 | 13.6 | 12.5%
12.3% |
| 20 to 24 years | 6.0 | 5.2 | 6.2 | 5.6 | 6.8 | 6.0 | 6.0%
5.2% |
| 16 to 19 years | 4.8 | 4.0 | 5.0 | 4.5 | 5.1 | 4.6 | 4.8%
4.0% |
| 10 to 15 years | 7.3 | 7.1 | 7.2 | 7.3 | 7.0 | 7.2 | 7.3%
7.1% |
| 5 to 9 years | 5.7 | 5.7 | 5.7 | 6.0 | 5.6 | 5.9 | 5.7%
5.7% |
| 4 years and under | 6.6 | 5.2 | 6.2 | 5.3 | 6.3 | 5.4 | 6.6%
5.2% |
Source: Office for National Statistics – 2011 Census and Census 2021
| |
Disability in Gosport
Gosport saw England's largest percentage-point fall in the proportion of non-disabled residents (from 81.4% in 2011 to 80.0% in 2021). These are age-standardised proportions.
Age-standardised proportions are used throughout this section. They enable comparisons between populations over time and across geographies, as they account for differences in the population size and age structure.
Eastbourne (from 80.9% to 79.7%) and Lewes (from 82.4% to 81.2%) saw the country's next largest decreases in the proportion of non-disabled residents.
Census 2021 was undertaken during the coronavirus (COVID-19) pandemic. This may have influenced how people perceived their health status and activity limitations, and therefore may have affected how people chose to respond.
Caution should be taken when making comparisons between 2011 and 2021 because of changes in question wording and response options.
The percentage of non-disabled residents in Gosport decreased by 1.4 percentage points
Age-standardised proportion of usual residents
by long-term health condition or illness,
| Disabled and limited a lot | 8.2 | 7.7 | 7.2 | 6.2 | 9.1 | 7.5 | 8.2%
7.7% |
|---|---|---|---|---|---|---|---|
| Disabled and limited a little | 10.4 | 12.2 | 9.4 | 9.9 | 10.2 | 10.2 | 10.4%
12.2% |
| Not disabled | 81.4 | 80.0 | 83.4 | 83.9 | 80.7 | 82.3 | 81.4%
80.0% |
Source: Office for National Statistics – 2011 Census and Census 2021
| |
Family in Gosport
The percentage of lone-parent households fell in Gosport, but rose across the South East.
In Gosport, the percentage of households including a lone parent fell from 11.7% in 2011 to 11.1% in 2021. During the same period, the regional percentage increased from 9.2% to 9.7%.
The percentage of households including a couple with dependent children in Gosport fell from 19.2% to 17.2%, while the percentage of households including a couple with only non-dependent children increased from 5.6% to 5.9%.
The percentage of households including a lone parent in Gosport decreased by 0.6 percentage points
Percentage of households
by household composition,
| One-person household: Aged 66 years and over (Aged 65 years and over in 2011) | 12.9 | 15.2 | 12.7 | 13.2 | 12.4 | 12.8 | 12.9%
15.2% |
|---|---|---|---|---|---|---|---|
| One-person household: Other | 16.9 | 16.6 | 16.1 | 15.2 | 17.9 | 17.3 | 16.9%
16.6% |
| Single-family household: Cohabiting-couple family: No children | 19.1 | 17.9 | 18.7 | 17.4 | 17.6 | 16.8 | 19.1%
17.9% |
| Single-family household: Cohabiting-couple family: With dependent children | 19.2 | 17.2 | 21.0 | 20.6 | 19.3 | 18.9 | 19.2%
17.2% |
| Single-family household: Cohabiting-couple family: All children non-dependent | 5.6 | 5.9 | 6.0 | 6.5 | 6.1 | 6.3 | 5.6%
5.9% |
| Single-family household: Lone-parent household | 11.7 | 11.1 | 9.2 | 9.7 | 10.6 | 11.1 | 11.7%
11.1% |
| Other household types | 14.6 | 16.0 | 16.3 | 17.4 | 16.1 | 16.9 | 14.6%
16.0% |
Source: Office for National Statistics – 2011 Census and Census 2021
| |
Health in Gosport
In 2021, 43.8% of Gosport residents described their health as "very good", increasing from 43.6% in 2011. Those describing their health as "good" fell from 36.8% to 36.5%. These are age-standardised proportions.
Age-standardised proportions are used throughout this section. They enable comparisons between populations over time and across geographies, as they account for differences in the population size and age structure.
The proportion of Gosport residents describing their health as "very bad" was 1.0% (similar to 2011), while those describing their health as "bad" was 4.2% (similar to 2011).
These data reflect people’s own opinions in describing their overall health on a five point scale, from very good to very bad.
Census 2021 was conducted during the coronavirus (COVID-19) pandemic. This may have influenced how people perceived and rated their health, and therefore may have affected how people chose to respond.
The percentage of people in very good health in Gosport increased by 0.2 percentage points
Age-standardised proportion of usual residents
by self-reported health,
| Very good health | 43.6 | 43.8 | 47.5 | 49.6 | 45.0 | 47.5 | 43.6%
43.8% |
|---|---|---|---|---|---|---|---|
| Good health | 36.8 | 36.5 | 35.3 | 34.4 | 34.8 | 34.2 | 36.8%
36.5% |
| Fair health | 14.4 | 14.4 | 12.7 | 11.8 | 14.2 | 13.0 | 14.4%
14.4% |
| Bad health | 4.1 | 4.2 | 3.6 | 3.3 | 4.6 | 4.1 | 4.1%
4.2% |
| Very bad health | 1.1 | 1.0 | 1.0 | 0.9 | 1.4 | 1.2 | 1.1%
1.0% |
Source: Office for National Statistics – 2011 Census and Census 2021
| |
Changing relationships in Gosport
Gosport saw the South East's joint largest percentage-point rise in the proportion of people aged 16 years and over who had divorced or dissolved a civil partnership (from 11.5% in 2011 to 12.3% in 2021).
During this period, Gosport overtook Isle of Wight and Thanet to become the English local authority area with the fourth-highest percentage of adults who had divorced or dissolved a civil partnership.
These figures include same-sex marriages and opposite-sex civil partnerships in 2021, neither of which were legally recognised in England and Wales in 2011. Same-sex marriages have been legally recognised in England and Wales since 2014 and opposite-sex civil partnerships have been recognised since 2019.
The percentage of adults who had divorced or dissolved a civil partnership in Gosport increased by 0.8 percentage points
Percentage of usual residents aged 16 years and over
by legal partnership status,
| Never married and never registered a civil partnership | 30.0 | 32.8 | 31.9 | 34.8 | 34.6 | 37.9 | 30.0%
32.8% |
|---|---|---|---|---|---|---|---|
| Married or in a registered civil partnership | 48.0 | 45.2 | 49.6 | 47.6 | 46.8 | 44.7 | 48.0%
45.2% |
| Separated, but still legally married or still legally in a civil partnership | 3.2 | 2.7 | 2.5 | 2.1 | 2.7 | 2.2 | 3.2%
2.7% |
| Divorced or civil partnership dissolved | 11.5 | 12.3 | 9.1 | 9.3 | 9.0 | 9.1 | 11.5%
12.3% |
| Widowed or surviving civil partnership partner | 7.5 | 7.0 | 6.9 | 6.1 | 6.9 | 6.1 | 7.5%
7.0% |
Source: Office for National Statistics – 2011 Census and Census 2021
| |
Gosport residents' country of birth
In the latest census, around 72,500 Gosport residents said they were born in England. This represented 88.5% of the local population. The figure has decreased from around 73,500 in 2011, which at the time represented 89.0% of Gosport's population.
Scotland was the next most represented, with around 2,100 Gosport residents reporting this country of birth (2.5%). This figure was down from around 2,400 in 2011, which at the time represented 3.0% of the population of Gosport.
The number of Gosport residents born in Wales fell from just over 1,100 in 2011 (1.4% of the local population) to around 1,000 in 2021 (1.2%).
In 2021, 88.5% of Gosport residents reported their country of birth as England
Percentage of usual residents
by country of birth,
| England | 89.0 | 88.5 | 84.8 | 81.7 | 83.5 | 80.3 | 89.0%
88.5% |
|---|---|---|---|---|---|---|---|
| Scotland | 3.0 | 2.5 | 1.6 | 1.3 | 1.3 | 1.1 | 3.0%
2.5% |
| Wales | 1.4 | 1.2 | 1.1 | 0.9 | 1.0 | 0.8 | 1.4%
1.2% |
| Countries that joined the EU between April 2001 and March 2011 (other than Poland, Croatia, Lithuania and Romania) | 0.6 | 0.7 | 0.7 | 1.0 | 0.7 | 1.0 | 0.6%
0.7% |
| Germany | 0.6 | 0.6 | 0.6 | 0.5 | 0.5 | 0.4 | 0.6%
0.6% |
Source: Office for National Statistics – 2011 Census and Census 2021
Notes:
- This chart shows the five most common countries of birth in Gosport in 2021
- Please see the data dictionary for further detail on country of birth groupings
| |
Unpaid care in Gosport
In 2021, 4.5% of Gosport residents (aged five years and over) reported providing up to 19 hours of unpaid care each week. This figure decreased from 6.9% in 2011. These are age-standardised proportions.
Age-standardised proportions are used throughout this section. They enable comparisons between populations over time and across geographies, as they account for differences in the population size and age structure.
The decrease in the proportion of people (aged five years and over) providing up to 19 hours of weekly unpaid care was greater across the South East (2.8 percentage points, from 7.3% to 4.5%) than in Gosport (2.4 percentage points). Across England, the proportion fell by 2.8 percentage points, from 7.2% to 4.4%.
Census 2021 was undertaken during the coronavirus (COVID-19) pandemic. This may have influenced how people perceived and managed their provision of unpaid care, and therefore may have affected how people chose to respond.
Caution should be taken when making comparisons between 2011 and 2021 because of changes in question wording and response options.
The percentage of people (aged five years and over) providing up to 19 hours of weekly unpaid care in Gosport decreased by 2.4 percentage points
Age-standardised proportion of usual residents (aged five years and over)
by hours per week of unpaid care provision,
| Does not provide weekly unpaid care | 89.2 | 90.7 | 89.3 | 91.6 | 88.7 | 91.1 | 89.2%
90.7% |
|---|---|---|---|---|---|---|---|
| Up to 19 hours of unpaid care | 6.9 | 4.5 | 7.3 | 4.5 | 7.2 | 4.4 | 6.9%
4.5% |
| 20 to 49 hours of unpaid care | 1.3 | 1.9 | 1.2 | 1.6 | 1.5 | 1.8 | 1.3%
1.9% |
| 50 or more hours of unpaid care | 2.6 | 2.9 | 2.2 | 2.4 | 2.7 | 2.7 | 2.6%
2.9% |
Source: Office for National Statistics – 2011 Census and Census 2021
| |
Religion in Gosport
In 2021, 48.4% of Gosport residents reported having "No religion", making it the most common response in this local authority area (up from 32.8% in 2011). Because the census question about religious affiliation is voluntary and has varying response rates, caution is needed when comparing figures between different areas or between censuses.
Across the South East, the percentage of residents who described themselves as having "No religion" increased from 27.7% to 40.2%, while across England the percentage increased from 24.8% to 36.7%.
In 2021, 44.6% of people in Gosport described themselves as Christian (down from 58.8%), while 5.1% did not state their religion (down from 6.7% the decade before).
There are many factors that can cause changes to the religious profile of an area, such as a changing age structure or residents relocating for work or education. Changes may also be caused by differences in the way individuals chose to self-identify between censuses. Religious affiliation is the religion with which someone connects or identifies, rather than their beliefs or religious practice.
Read the bulletin Religion, England and Wales: Census 2021.In 2021, 48.4% of usual residents in Gosport reported having "No religion"
Percentage of usual residents
by religion,
| No religion | 32.8 | 48.4 | 27.7 | 40.2 | 24.8 | 36.7 | 32.8%
48.4% |
|---|---|---|---|---|---|---|---|
| Christian | 58.8 | 44.6 | 59.8 | 46.5 | 59.4 | 46.3 | 58.8%
44.6% |
| Buddhist | 0.2 | 0.3 | 0.5 | 0.6 | 0.5 | 0.5 | 0.2%
0.3% |
| Hindu | 0.2 | 0.3 | 1.1 | 1.7 | 1.5 | 1.8 | 0.2%
0.3% |
| Jewish | 0.0 | 0.0 | 0.2 | 0.2 | 0.5 | 0.5 | 0.0%
0.0% |
| Muslim | 0.5 | 0.6 | 2.3 | 3.3 | 5.0 | 6.7 | 0.5%
0.6% |
| Sikh | 0.0 | 0.0 | 0.6 | 0.8 | 0.8 | 0.9 | 0.0%
0.0% |
| Other | 0.5 | 0.6 | 0.5 | 0.6 | 0.4 | 0.6 | 0.5%
0.6% |
| Not answered | 6.7 | 5.1 | 7.4 | 6.1 | 7.1 | 6.0 | 6.7%
5.1% |
Source: Office for National Statistics – 2011 Census and Census 2021
| |
National identity in Gosport
The increase in the percentage of people who did not identify with any national identity associated with the UK was greater in nearby Portsmouth (3.0 percentage points) than in Gosport (0.6 percentage points).
In Gosport, the percentage of people who did not identify with at least one UK national identity increased from 2.6% in 2011 to 3.1% in 2021. During the same period, the percentage in nearby Portsmouth increased from 7.4% to 10.4%.
The percentage of people who identified with a UK and non-UK national identity in Gosport increased from 0.4% to 0.9%, while the percentage of people who identified as "British only" increased from 15.9% to 57.4%.
In Census 2021, “British” was moved to the top response option and this may have influenced how people described their national identity. For further information, please see our quality report.
The percentage of people who did not identify with at least one UK national identity in Gosport increased by 0.6 percentage points
Percentage of usual residents
by national identity,
| British only identity | 15.9 | 57.4 | 17.9 | 56.7 | 19.2 | 56.8 | 15.9%
57.4% |
|---|---|---|---|---|---|---|---|
| Welsh only identity | 0.8 | 0.5 | 0.6 | 0.4 | 0.6 | 0.3 | 0.8%
0.5% |
| Welsh and British only identity | 0.2 | 0.2 | 0.1 | 0.2 | 0.1 | 0.2 | 0.2%
0.2% |
| English only identity | 67.8 | 18.8 | 61.8 | 16.2 | 60.4 | 15.3 | 67.8%
18.8% |
| English and British only identity | 10.0 | 17.4 | 9.9 | 14.6 | 9.1 | 14.3 | 10.0%
17.4% |
| Any other combination of only UK identities | 2.4 | 1.6 | 1.6 | 1.1 | 1.6 | 1.1 | 2.4%
1.6% |
| Non-UK identity only | 2.6 | 3.1 | 7.1 | 8.7 | 8.2 | 10.0 | 2.6%
3.1% |
| UK identity and non-UK identity | 0.4 | 0.9 | 0.9 | 2.2 | 0.9 | 2.0 | 0.4%
0.9% |
Source: Office for National Statistics – 2011 Census and Census 2021
| |
Fall in employment
Of Gosport residents aged 16 years and over, 56.0% said they were employed (excluding full-time students) in 2021, down from 58.7% in 2011.
The decrease in the percentage of people aged 16 years and over (excluding full-time students) who were employed was greater in Gosport (2.7 percentage points) than across the South East (1.3 percentage points, from 59.0% to 57.6%). Across England, the percentage fell by 0.8 percentage points, from 56.5% to 55.7%.
Census 2021 took place during the coronavirus (COVID-19) pandemic, a period of rapid and unparalleled change; the national lockdown, associated guidance and furlough measures will have affected the labour market and our ability to measure it.
The percentage of people aged 16 years and over who were employed (excluding full-time students) in Gosport decreased by 2.7 percentage points
Percentage of usual residents aged 16 years and over
by economic activity status,
| Economically active (excluding full-time students): In employment | 58.7 | 56.0 | 59.0 | 57.6 | 56.5 | 55.7 | 58.7%
56.0% |
|---|---|---|---|---|---|---|---|
| Economically active (excluding full-time students): Unemployed | 3.8 | 2.6 | 3.1 | 2.5 | 4.0 | 2.9 | 3.8%
2.6% |
| Economically active and a full-time student: In employment | 1.8 | 1.2 | 2.4 | 1.6 | 2.4 | 1.7 | 1.8%
1.2% |
| Economically active and a full-time student: Unemployed | 0.6 | 0.5 | 0.6 | 0.5 | 0.7 | 0.6 | 0.6%
0.5% |
| Economically inactive: Retired | 22.9 | 25.4 | 21.8 | 22.5 | 21.2 | 21.5 | 22.9%
25.4% |
| Economically inactive: Student | 3.3 | 3.2 | 4.7 | 5.1 | 5.3 | 5.6 | 3.3%
3.2% |
| Economically inactive: Looking after home or family | 3.9 | 4.2 | 4.0 | 4.4 | 4.0 | 4.8 | 3.9%
4.2% |
| Economically inactive: Long-term sick or disabled | 3.3 | 4.2 | 2.7 | 3.1 | 3.8 | 4.1 | 3.3%
4.2% |
| Economically inactive: Other | 1.6 | 2.6 | 1.8 | 2.7 | 2.2 | 3.1 | 1.6%
2.6% |
Source: Office for National Statistics – 2011 Census and Census 2021
| |
Change in work hours
In 2021, 9.3% of Gosport residents aged 16 years and over and in employment said they worked 15 hours or less per week. This figure increased from 8.8% in 2011.
In 2021, just under one in nine people (10.7%) said they worked over 49 hours per week, compared with 12.7% in 2011. The percentage of adults in employment working 31 to 48 hours per week increased from 60.0% to 60.1%.
The increase in the percentage of people aged 16 years and over and in employment who said they usually worked 15 hours or less per week in Gosport (0.5 percentage points) was similar to the increase across the South East (0.5 percentage points, from 10.4% to 11.0%). Across England, the percentage increased by 0.6 percentage points, from 9.7% to 10.3%.
Working hours may have been affected by the coronavirus (COVID-19) pandemic.
The percentage of adults who worked 15 hours or less in Gosport increased by 0.5 percentage points
Percentage of usual residents aged 16 years and over and in employment
by the number of hours worked per week,
| 15 hours or less worked | 8.8 | 9.3 | 10.4 | 11.0 | 9.7 | 10.3 | 8.8%
9.3% |
|---|---|---|---|---|---|---|---|
| 16 to 30 hours worked | 18.4 | 19.8 | 18.4 | 18.6 | 19.5 | 19.5 | 18.4%
19.8% |
| 31 to 48 hours worked | 60.0 | 60.1 | 56.6 | 58.6 | 57.5 | 59.1 | 60.0%
60.1% |
| 49 or more hours worked | 12.7 | 10.7 | 14.6 | 11.9 | 13.3 | 11.1 | 12.7%
10.7% |
Source: Office for National Statistics – 2011 Census and Census 2021
| |
Fall in home ownership
Of Gosport households, 63.6% owned their home in 2021, down from 65.2% in 2011.
In 2021, just under one in five households (18.7%) rented privately, compared with 16.3% in 2011. The percentage of Gosport households that lived in a socially rented property decreased from 16.4% to 16.3%.
The decrease in the percentage of households that owned their home was greater across the South East (2.0 percentage points, from 67.6% to 65.7%) than in Gosport (1.6 percentage points). Across England, the percentage fell by 2.0 percentage points, from 63.3% to 61.3%.
The rate of home ownership in Gosport decreased by 1.6 percentage points
Percentage of households
by housing tenure,
| Owns outright or with a mortgage or loan | 65.2 | 63.6 | 67.6 | 65.7 | 63.3 | 61.3 | 65.2%
63.6% |
|---|---|---|---|---|---|---|---|
| Shared ownership | 1.1 | 1.2 | 1.1 | 1.4 | 0.8 | 1.0 | 1.1%
1.2% |
| Social rented | 16.4 | 16.3 | 13.7 | 13.6 | 17.7 | 17.1 | 16.4%
16.3% |
| Private rented | 16.3 | 18.7 | 16.3 | 19.2 | 16.8 | 20.5 | 16.3%
18.7% |
| Lives rent free | 1.0 | 0.2 | 1.3 | 0.1 | 1.3 | 0.1 | 1.0%
0.2% |
Source: Office for National Statistics – 2011 Census and Census 2021
| |
Ethnic groups in Gosport
In 2021, 1.2% of Gosport residents identified their ethnic group within the "Black, Black British, Black Welsh, Caribbean or African" category, up from 0.7% in 2011. The 0.5 percentage-point change was the largest increase among high-level ethnic groups in this area.
Across the South East, the percentage of people from the "Black, Black British, Black Welsh, Caribbean or African" ethnic group increased from 1.6% to 2.4%, while across England the percentage increased from 3.5% to 4.2%.
In 2021, 95.3% of people in Gosport identified their ethnic group within the "White" category (compared with 96.4% in 2011), while 1.5% identified their ethnic group within the "Mixed or Multiple" category (compared with 1.3% the previous decade).
The percentage of people who identified their ethnic group within the "Asian, Asian British or Asian Welsh" category increased from 1.3% in 2011 to 1.4% in 2021.
There are many factors that may be contributing to the changing ethnic composition of England and Wales, such as differing patterns of ageing, fertility, mortality, and migration. Changes may also be caused by differences in the way individuals chose to self-identify between censuses.
Read the bulletin Ethnic group, England and Wales: Census 2021.In 2021, 1.2% of usual residents in Gosport identified their ethnic group within the "Black, Black British, Black Welsh, Caribbean or African" category
Percentage of usual residents
by ethnic group,
| Asian, Asian British or Asian Welsh | 1.3 | 1.4 | 5.2 | 7.0 | 7.8 | 9.6 | 1.3%
1.4% |
|---|---|---|---|---|---|---|---|
| Black, Black British, Black Welsh, Caribbean or African | 0.7 | 1.2 | 1.6 | 2.4 | 3.5 | 4.2 | 0.7%
1.2% |
| Mixed or Multiple ethnic groups | 1.3 | 1.5 | 1.9 | 2.8 | 2.3 | 3.0 | 1.3%
1.5% |
| White | 96.4 | 95.3 | 90.7 | 86.3 | 85.4 | 81.0 | 96.4%
95.3% |
| Other ethnic groups | 0.2 | 0.5 | 0.6 | 1.5 | 1.0 | 2.2 | 0.2%
0.5% |
Source: Office for National Statistics – 2011 Census and Census 2021
| |
About the data
Census data are adjusted to reflect estimated non-response so that the published results relate to the entire usually resident population as it was on Census Day (21 March 2021).
Those respondents who were on furlough because of the coronavirus (COVID-19) pandemic were asked to classify themselves as "temporarily away from work" to ensure they remained in the economically active population.
Students are counted as usually resident at their term-time address even if they were not physically present there on Census Day.
The questions relating to disability differed slightly between 2011 and 2021 to ensure that data were more closely aligned with the definition of disability in the Equality Act (2010). There was also a change to question wording for unpaid care, for more information read the health, disability and unpaid care quality information.
Age-standardised proportions are used throughout the health, disability and unpaid care sections. They allow for fairer comparisons between populations over time and across geographies, as they account for differences in the population size and age structure. The 2013 European Standard Population is used to standardise proportions.
Percentages and percentage point changes have been individually rounded to one decimal place. This means they may not sum exactly.
Tell us what you think about this publication by answering a few questions.
Download the data used in this article
xlsx (1.5 MB)About these articles
There is an article like this for every local authority district in England and Wales. The articles have been written and semi-automated by our data journalists and are a new publishing format for the Office for National Statistics.
Topics are chosen and ordered automatically based on how relevant they are for each area, however all data are checked before publishing.
We have not included topics that were new for Census 2021 or where there is no comparability with the 2011 Census. Read about how we developed and tested the questions for Census 2021.
These articles were first published on 8 December 2022 covering topics such as demography, country of birth, ethnic groups, religion, national identity and economic activity status. They were updated on 19 January 2023 following the release of more data from Census 2021 and now include housing tenure, general health, disability and unpaid care.
Related links
Supporting information | Released 2 November 2022
What topic summary data for Census 2021 will be available and how to view them.
Interactive tool | Released 8 December 2022
Use our interactive map to find out what people’s lives are like across England and Wales.
How well do you know your area?
Digital Content Article | Released 2 December 2022
Test your knowledge of where you live with our Census quiz.
Contact
census.customerservices@ons.gov.ukTelephone: +44 1329 44 4972