1. Main points
Output per hour worked in the UK was 15.9% below the average for the rest of the G7 advanced economies in 2015; this compares with 15.8% in 2014.
Output per worker in the UK was 16.6% below the average for the rest of the G7 in 2015.
Compared with the rest of the G7, the UK had below average productivity growth in both output per hour and output per worker terms in 2015.
Output per hour was lower in all G7 countries in 2015 than would have been the case if pre-downturn trends had continued since 2007.
The UK’s “productivity puzzle” – the difference between post-downturn productivity performance and the pre-downturn trend – was 15.2% in 2015; this was the largest in the G7 and was double the average of 7.5% across the rest of the G7.
This edition forms part of our quarterly productivity bulletin which also includes an overarching commentary, summaries of recently published estimates, and new quarterly estimates of public service productivity.
Back to table of contents2. Things you need to know about this release
This bulletin contains annual estimates of labour productivity for the G7 developed countries (Canada, France, Germany, Italy, Japan, UK and US) up to 2015. Labour productivity measures the amount of economic output that is produced by a unit of labour input and is an important measure of economic performance.
Output is measured by gross domestic product (GDP). Labour input is measured in two ways – by total hours worked and by the number of workers in employment. These two measures of labour input can yield different results, reflecting differences in working patterns across countries and compositional movements over time, such as a shift towards part-time working.
Comparability across countries is achieved by using estimates of GDP and labour inputs from a common source (the Statistics Directorate of the Organisation for Economic Co-operation and Development (OECD)) as far as possible. These were the best data available at the time of publication. We convert local currency-based measures of GDP using Purchasing Power Parity (PPP) exchange rates, which attempt to equalise the cost of a representative basket of goods and services in countries with different national currencies. An article by the Office for National Statistics (ONS) explaining the uses and limitations of PPPs is available on our website. For data points where labour input is not available from the OECD Annual Labour Force Statistics (ALFS) database, Eurostat (for European countries) and an alternative OECD employment series (for non-European countries) are used to project the missing data.
The labour productivity measures in this bulletin are presented in terms of current prices, suitable for cross-country comparison of levels of productivity for a single year and constant prices, suitable for analysis of productivity performance over a number of years.
The estimates in this release update those published on 6 October 2016. This release cycle reflects the publication and revision cycles of the component data series.
Alongside this release, estimates for a series of additional countries are also published in the datasets. Commentary on these additional estimates is included in the Productivity introduction. While the methodology underlying these is consistent with the G7 estimates, they are not National Statistics.
More information on methodology and interpretation is available in the quality and methodology section of this bulletin.
Back to table of contents3. UK productivity shortfall with the G7 relatively stable in 2015
Current price GDP per hour worked
On this basis, UK productivity in 2015 was:
above that of Japan by 10.6%
above that of Canada by 1.2%
lower than that of Italy by 10.5%
lower than that of the US by 22.2%
lower than that of France by 22.7%
lower than that of Germany by 26.7%
lower than that of the rest of the G7 by 15.9%
Figure 1: Gross domestic product per hour worked, G7 countries, 2014 and 2015
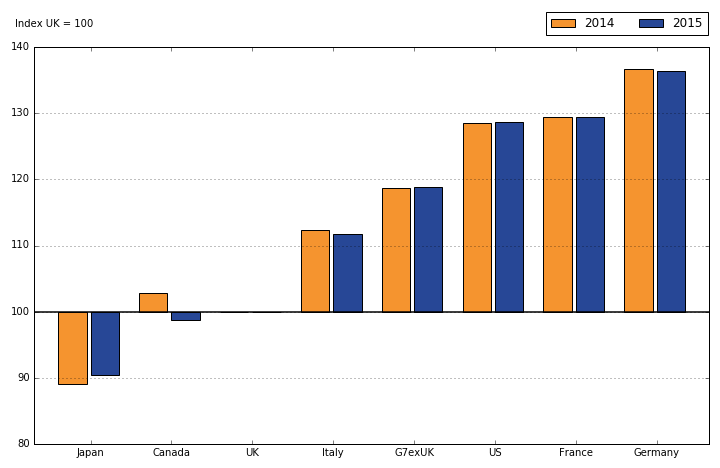
Source: Organisation for Economic Co-operation and Development, Eurostat and Office for National Statistics calculations
Notes:
- The percentage point differences relative to the UK presented in Figure 1 will differ from the percentages given in the above bullet points. This occurs because the percentages given in the bullet points refer to the UK’s position relative to each other country, whereas the percentage point differences in the chart refer to the other country’s position relative to the UK
Download this image Figure 1: Gross domestic product per hour worked, G7 countries, 2014 and 2015
.png (12.7 kB) .xls (25.1 kB)
As shown in Figure 1, the ranking of nations by their productivity changed little between 2014 and 2015. The UK’s productivity gap with the rest of the G7 increased slightly from 15.8% in 2014 to 15.9% in 2015; while the gaps between the UK and the US, Germany and France remained substantial. In 2014, Canada had stronger productivity than the UK on a gross domestic product (GDP) per hour worked basis; however, in 2015 the UK was more productive than Canada. Canada's current price productivity growth was slower than that of the UK because while both countries experienced growth in hours worked, the UK's current price GDP growth was stronger than that of Canada. The UK remained more productive than Japan in 2015 although the gap between the two narrowed a little.
Current price GDP per worker
Final estimates for 2015 show that UK output per worker was:
above that of Japan by 7.7%
below that of Canada by 0.7%
below that of Germany by 10.4%
below that of France by 12.7%
below that of Italy by 13.1%
below that of the US by 27.3%
below that of the rest of the G7 by 16.6%
Figure 2: Gross domestic product per worker, G7 countries, 2014 and 2015
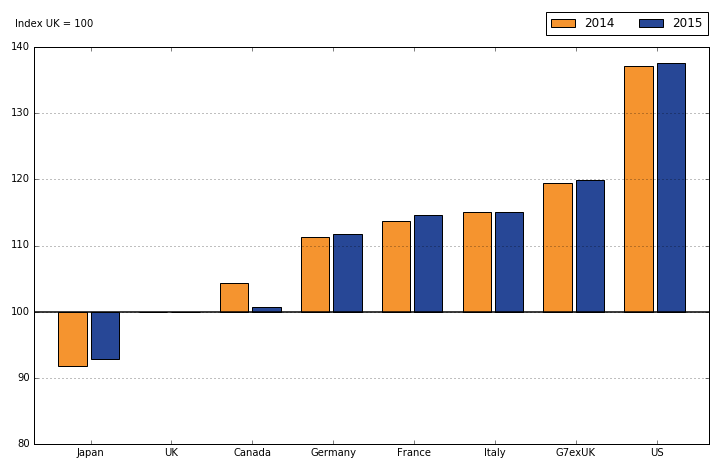
Source: Organisation for Economic Co-operation and Development, Eurostat and Office for National Statistics calculations
Download this image Figure 2: Gross domestic product per worker, G7 countries, 2014 and 2015
.png (12.6 kB) .xls (25.1 kB)
The productivity shortfall, in terms of output per worker, between the UK and the rest of the G7 widened slightly to 16.6% in 2015, compared with 16.3% in 2014. The UK’s productivity performance improved relative to Canada and neither improved nor worsened relative to Italy. However, UK productivity relative to France, the US and Germany worsened and Japan experienced a slight catch-up. This picture is broadly consistent with that presented in first estimates. However, this shows a slightly stronger performance of France, Italy, Japan and Germany relative to the UK than initially indicated.
Different movements in average hours across countries account for differences in the patterns of productivity shown in Figures 1 and 2. For example, the productivity gap between the UK and the US is wider in terms of output per worker than in terms of output per hour because, on average, US workers work more hours than UK workers. On the other hand, the productivity differential between the UK and Germany and France is wider in terms of output per hour than in terms of output per worker, as German and French workers work fewer hours than their UK counterparts.
Back to table of contents4. Productivity slowdown greater in the UK than the other G7 economies
Constant price GDP per hour worked
Figure 3 shows gross domestic product (GDP) per hour worked for the UK and an aggregated series for the rest of the G7, together with simple projections based on average productivity growth over 1997 to 2007 (prior to the global economic downturn). On this basis, the combination of strong UK productivity growth up to 2007 and its weak productivity performance since 2007 implies a productivity gap of around 15.2% in 2015. In other words, output per hour in 2015 was around 15.2% lower than under a counterfactual scenario where UK productivity continued to grow at its pre-downturn trend since 2007.
Figure 3: Constant price gross domestic product per hour worked, actual and projections, 1997 to 2015
Source: Organisation for Economic Co-operation and Development, Eurostat and Office for National Statistics calculations
Notes:
- This figure presents annual data and uses gross domestic product (GDP) as opposed to gross value added (GVA) as the numerator. Therefore, there may be slight differences between Figure 3 and the equivalent chart presented in the Labour productivity quarterly bulletin.
Download this chart Figure 3: Constant price gross domestic product per hour worked, actual and projections, 1997 to 2015
Image .csv .xlsThe UK’s average annual productivity growth between 1997 and 2007 was 0.3 percentage points higher than the average of the rest of the G7 advanced economies. Since 2007, productivity growth across the rest of the G7 has been stronger than the UK. This implies a narrower productivity gap for the rest of the G7 of around 7.5% in 2015.
The projections used in Figure 3 commence from 2008, however, when reviewing the performance of the rest of the G7, it can be argued that the slowdown in productivity growth began in 2005, preceding the economic downturn. Projecting from 2005 would result in a larger gap for the G7 excluding the UK, than that shown in Figure 3.
Figure 4 illustrates the difference in productivity trajectories over recent years between the G7 economies. Output per hour fell in most G7 countries during the downturn in 2008 and 2009, before rebounding sharply in Canada and the US. However, a slowdown in growth can be observed in several countries before this, with German growth slowing from 2004, while Italy demonstrated no substantive growth since 2000. Comparing average productivity growth rates since 2007, the UK ranks second bottom; only Italy had lower productivity growth. Though Italy’s productivity growth has been lower than the UK post-downturn, its pre-downturn trend was relatively subdued and as such their slowdown relative to trend is less marked than the UK’s, highlighting that the choice of time period is fundamental to these calculations.
Figure 4: Constant price gross domestic product per hour worked, G7 countries, 1997 to 2015
Source: Organisation for Economic Co-operation and Development, Eurostat and Office for National Statistics calculations
Download this chart Figure 4: Constant price gross domestic product per hour worked, G7 countries, 1997 to 2015
Image .csv .xls5. Revisions
Historical data used in this publication are subject to revision between publications. Datasets R1 and R2 compare the latest estimates with estimates from the previous release on 6 October 2016. Note that because Tables 1 and 2 are indexed to UK equals 100, revisions to the UK are zero by definition in Tables R1 and R2.
The main revision in this release comes from substantial revisions to UK Purchasing Power Parities (PPPs) for the period 1995 to 2009. Post-2010 PPPs had already been revised in the data used in previous releases, as they were part of the open window for PPP revisions.
The largest impact on the UK’s PPPs came from the improvements made to the measurement of imputed rental prices in the period prior to 2010. These are the housing services that accrue to households that own a property and reside in it: therefore avoiding the cost of renting an equivalent property, for which a change of source data was made in Blue Book 2016.
These revisions partly undo upward revisions that were applied previously when UK current price gross domestic product (GDP) adjustments were made following changes in the UK National Accounts at a point when compensating PPP changes had not yet been calculated. Since the rest of the G7 is indexed to UK equals 100 in the current price series, the downward revisions to UK current price GDP at PPP results in substantial improvements in other countries’ productivity relative to the UK. There have also been revisions, though on a smaller scale, to the PPPs for the majority of the series for Canada, France, Germany and Italy, as well as for the past 3 years for Japan.
Other revisions are as follows:
there have been substantial revisions to Japanese GDP since the previous release, these GDP revisions are caused by benchmark revisions and the adoption of the System of National Accounts 2008, coming largely from the inclusion of research and development in GDP
Canada and Italy have had small upwards revisions to GDP since 2013 and 2014 respectively
7. Quality and methodology
The International Comparisons of Productivity Quality and Methodology Information document contains important information on:
the strengths and limitations of the data and how it compares with related data
uses and users of the data
how the output was created
the quality of the output including accuracy of the data
For this release the base year for Purchasing Power Parities (PPPs) is 2014, which is the latest year for which the Organisation for Economic Co-operation and Development (OECD) PPP series have been benchmarked.
The output measure used here (gross domestic product (GDP)) differs from that used for the ONS headline measure of productivity (gross value added (GVA)). In the national accounts, GDP is valued at market prices and GVA is valued at basic prices. The principal difference is that basic prices exclude taxes and subsidies on products, such as VAT and excise duties. For further information on the relationship between GVA and GDP see Chapter 4 of the ONS Productivity Handbook.
GVA is the preferred measure of output for productivity purposes. However, as the OECD does not produce output level series using basic prices over the necessary time period and PPPs are based on market prices, GDP is used in this bulletin. Differences between the growth rates of GVA and GDP are not normally significant.
Estimates of labour inputs (employment and hours worked) are taken from OECD where available, supplemented in a small number of cases by other sources. Differences between OECD estimates and national sources reflect adjustments made by OECD to achieve greater consistency between national estimates. There may also be timing differences as national sources are updated outside the OECD revision cycle.
Current price productivity estimates are indexed to UK equals 100 for each year and show each country’s productivity relative to that of the UK in that year. Since productivity is an important determinant of living standards, these estimates also provide an indication of living standards relative to the UK. In interpreting these estimates you should bear in mind that PPPs provide only an approximate conversion from national currencies and may not fully reflect national differences in the composition of a representative basket of goods and services. Additionally, care should be taken in interpreting movements in current price productivity estimates over time. For example, an increase in UK productivity relative to another country could be due to UK productivity growing faster, or falling less, or due to changes in relative prices in the two countries, or some combination of these movements.
Constant price productivity estimates are indexed to a particular year. For each single country, these estimates are very similar to national labour productivity series. The index year is set at 2007 in order to focus on movements in labour productivity over the economic downturn. These estimates, conversely to the current price estimates, show the evolution of productivity for each country and for the G7 (and G7 excluding the UK) aggregates, but should not be used to compare productivity across countries at a point in time. Productivity growth can be decomposed into growth of output minus the growth of labour input and these components can move in different directions within and across countries. This should be borne in mind in interpreting the constant price productivity estimates in this release.
Back to table of contentsContact details for this Statistical bulletin
Related publications
- UK productivity introduction: Oct to Dec 2016
- Labour productivity, UK: October to December 2016
- Quarterly public service productivity (Experimental Statistics): Oct to Dec 2016
- Exploring labour productivity in rural and urban areas in Great Britain: 2014
- Multi-factor productivity estimates: Experimental estimates to 2015
- Labour productivity measures from the Annual Business Survey: 2006 to 2015
- Introducing quarterly regional labour input metrics
- An initial assessment of regional management practices: 2015