Table of contents
1. Main points
Labour Productivity as measured by output per hour grew by 0.4% in Quarter 4 (Oct to Dec) 2016, up from a downwardly revised growth rate of 0.2% in the previous quarter.
The gap between UK labour productivity and that of the rest of the G7 was largely unchanged at around 16% in 2015, although evidence suggests that labour productivity growth has weakened across the Organisation for Economic Co-operation and Development (OECD) in recent years.
New regional labour input metrics for the UK regions suggest that average hours per job are higher in London and Northern Ireland than in the UK as a whole, supported by a relatively high share of full-time employment.
New ONS analysis of firm-level labour productivity data suggests that firms in urban areas have higher productivity relative to firms in rural areas.
Analysis of the distribution of labour productivity in the UK suggests that the recent economic downturn had a lasting impact on the number of lower-productivity firms, and that there is a wide gap between the most and least productivity firms in the UK.
New estimates of multi-factor productivity growth suggest that market sector output growth has been supported by strong labour input growth in recent years, while labour productivity growth has been held back through capital shallowing.
2. Economist quote
“Although the recent recovery of labour productivity is welcome, there is still no evidence of a return to the pre-downturn rates of growth – either in the UK or among other developed countries. While UK services and manufacturing have both contributed to recent productivity growth, today's results point to a wide gap between the least and most productive firms in the UK. Professional services firms accounted for almost a third of the UK’s most productive firms in 2015.”
Philip Wales, Head of Productivity, Office for National Statistics
Back to table of contents4. Quarterly productivity estimates
Labour Productivity as measured by output per hour grew by 0.4% in Quarter 4 (Oct to Dec) 2016, up from a downwardly revised growth rate of 0.2% in the previous quarter. As a consequence, UK labour productivity was little higher in Quarter 4 2016 than immediately prior to the downturn. Output per hour growth in the final quarter of 2016 was somewhat slower in the services industries (0.8%) than in the manufacturing industries (1.7%).
While growth in the most recent quarter picked up, the trend post-downturn remains one of relatively slow growth. Figure 1 shows the paths of output per worker and per hour relative to the pre-downturn peak of productivity, as well as the projected paths of these measures had the pre-downturn growth rates been sustained. It shows that on an output per hour basis, had labour productivity continued to grow at its pre-downturn rate it would be around 19% higher than at present. The gap on a per worker basis is slightly smaller – reflecting changes in average hours over this period – but remains substantial.
Figure 1: Output per hour and output per worker
UK, Seasonally adjusted, quarter 1 (Jan to Mar) 1994 to quarter 4 (Oct to Dec) 2016
Source: Office for National Statistics
Download this chart Figure 1: Output per hour and output per worker
Image .csv .xlsAlthough productivity growth since the economic downturn has been fairly weak, the sources of productivity growth over this period have varied. Figure 2 shows the contributions to UK output per hour growth of different industries (reflecting changes in the productivity of specific industries) and an “allocation” effect (showing the impact of changes in the overall mix of industries) on a quarter on same quarter a year ago basis. It shows that recent output growth has been driven by Other Services – which registered its largest contribution to productivity growth since the onset of the economic downturn in Quarter 4 2016. However, this strength was partly offset by a negative allocation effect – continuing a recent run of these effects – which indicates growth among industries with relatively low levels of labour productivity. This effect is partly explained by the long-run decline in output in Oil and Gas extraction – which is among the UK’s most productive industries – but may also point to a wider role for reallocation across the economy. We plan to examine these effects in greater detail in future publications1.
Figure 2: Contributions to output per hour
UK, Seasonally Adjusted, growth on same quarter last year
Source: Office for National Statistics
Notes:
- This kind of analysis is dependent on the level of industrial aggregation which is used. Using more detailed – or more aggregate – industries may generate alternative estimates of the allocation effect in particular.
Download this chart Figure 2: Contributions to output per hour
Image .csv .xlsAlongside these estimates of quarterly labour productivity growth for the whole economy, we have also published the latest quarterly estimates of public service productivity. These show that total public service productivity fell by 0.1% in Quarter 4 2016, as a consequence of a small rise in inputs (0.1% on the quarter) and flat output over this period. Taking this result with those for the previous quarters, these data suggest that total public service productivity grew by 0.4% in 2016 as a whole.
Placing this in the context of a longer time series, Figure 3 combines the latest experimental quarterly estimates – covering Quarter 1 (Jan to Mar) 2015 to Quarter 4 2016 – with annual estimates for between 1997 and 2014, taken from our Public service productivity estimates: total public service, UK: 2014 release. It suggests that, despite some volatility in the quarterly path, the productivity of UK public services has been on an upwards trend for much of the last 6 years. Since 2010, total public service productivity is estimated to have increased by 3.0% – around 0.5% growth per year. This represents the longest sustained period of growth in public service productivity since the start of the series in 1997.
Figure 3: Total Public Service Productivity
UK, 1997 to Quarter 4 (Oct to Dec) 2016

Source: Office for National Statistics
Notes:
- Estimates from 1997 to 2014 are based on the existing annual series.
- Estimates from 2015 Q1 to 2016 Q4 are based on the experimental quarterly total public service productivity series.
- Estimates for 2015 Q1 reflect the growth rate between 2015 Q1 and annualised quarterly productivity for 2014.
- Estimates of productivity for the experimental period are indirectly seasonally adjusted, calculated using seasonally adjusted inputs and seasonally adjusted output.
- LHS stands for left-hand side.
- RHS stands for right-hand side.
Download this image Figure 3: Total Public Service Productivity
.png (29.7 kB) .xls (34.3 kB)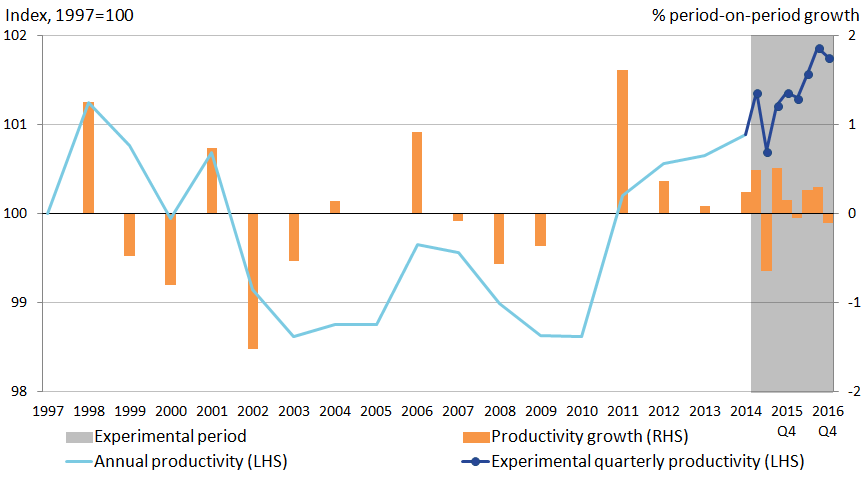
Notes for: Quarterly productivity estimates
- This effect explains why the headline rate of labour productivity growth is lower than the rates of labour productivity growth in the largest industries.
5. International Comparisons of Productivity
The relative weakness of recent labour productivity growth is one of two “puzzles” which define the UK’s productivity performance since the economic downturn. The second, long-standing puzzle concerns the gap between the UK’s level of output per hour and that of other advanced economies. As part of this release, we have published revised estimates of this gap between the UK and the G7 economies. These estimates use data compiled by the Organisation for Economic Co-operation and Development (OECD) on gross domestic product (GDP), labour input and use Purchasing Power Parity (PPP) exchange rates to generate estimates of labour productivity in a common currency. Although this is common practice, users should be aware of the limitations of these PPPs and the recent revisions to these series.
These new estimates of labour productivity suggest that the gap between the UK and the G7 was largely unchanged at around 16% in output per hour terms in 2015. Figure 4 shows the ratio of UK GDP per hour worked to that in other countries and to the G7 excluding the UK. On this basis, the gap between the UK and Canada, Germany and Italy fell slightly during 2015, although the UK’s productivity lead over Japan was eroded slightly over this period. On a per worker basis, the gap between the UK and the G7 is slightly larger at around 17%. Revisions to PPPs – which were more pronounced prior to 2010 – have also increased the gap between the G7 economies and the UK in earlier years. More details of these results can be found in the International Comparisons of Productivity release.
Figure 4: Current price GDP per hour worked, G7 countries
G7 countries

Source: Office for National Statistics
Download this image Figure 4: Current price GDP per hour worked, G7 countries
.png (12.7 kB) .xls (25.1 kB)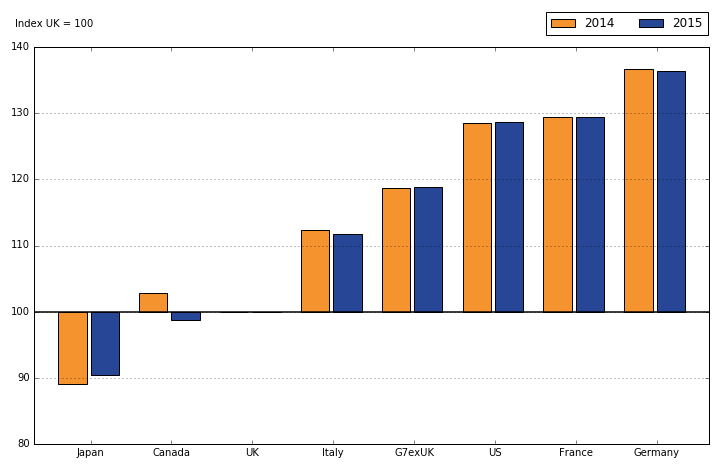
While Figure 4 presents the UK’s labour productivity performance relative to the G7 on a GDP per hour worked basis, Figure 5 provides some broader international context. It extends the methodology used in the calculation of GDP per hour worked to a broader array of OECD countries for which sufficient data is available. It suggests that among this group of 24 selected OECD economies, the UK ranked 15th in labour productivity terms in 2015. Luxembourg – which benefits from large in-flows of labour from neighboring countries – and Norway – which has a large oil and gas extraction industry are among the most productive OECD nations on this basis. Ireland – which reported GDP growth of around 26.3% in 2015, largely driven by movements in corporate assets and intellectual property, as well as corporate restructuring – is also among the most productive nations on this basis. By contrast, Estonia, Poland and Hungary are all considerably less productive than the UK on this basis.
Figure 5: Current price GDP per hour worked
Selected OECD countries, 2015

Source: Office for National Statistics
Download this image Figure 5: Current price GDP per hour worked
.png (15.9 kB) .xls (25.6 kB)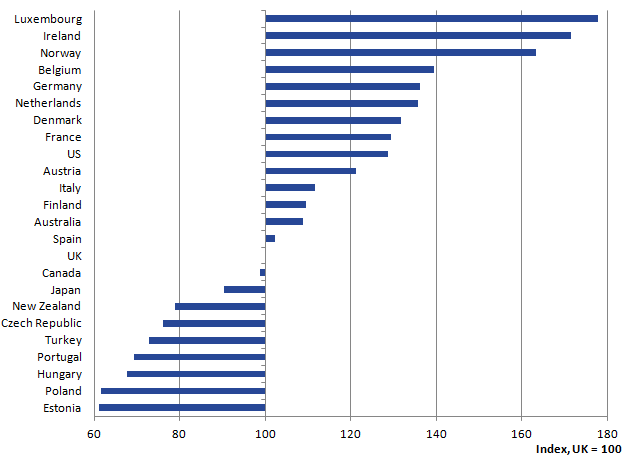
While the gap between the UK and other advanced economies is considerable, the weakness of recent labour productivity growth is an international phenomenon, affecting a wide range of different countries. Figure 6 presents information on the compound average annual growth rates of GDP, hours and productivity for selected OECD economies over two periods: the 7 years prior to 2007 (Panel A) and between 2007 and 2015 (Panel B). Total hours growth is shown on the horizontal axis, GDP growth is shown on the vertical axis and the diagonal lines indicate combinations of hours and GDP growth consistent with varying degrees of productivity growth.
Figure 6: Average total hours growth vs average GDP growth in OECD countries
2000 to 2007 (Panel A) and 2007 to 2015 (Panel B)
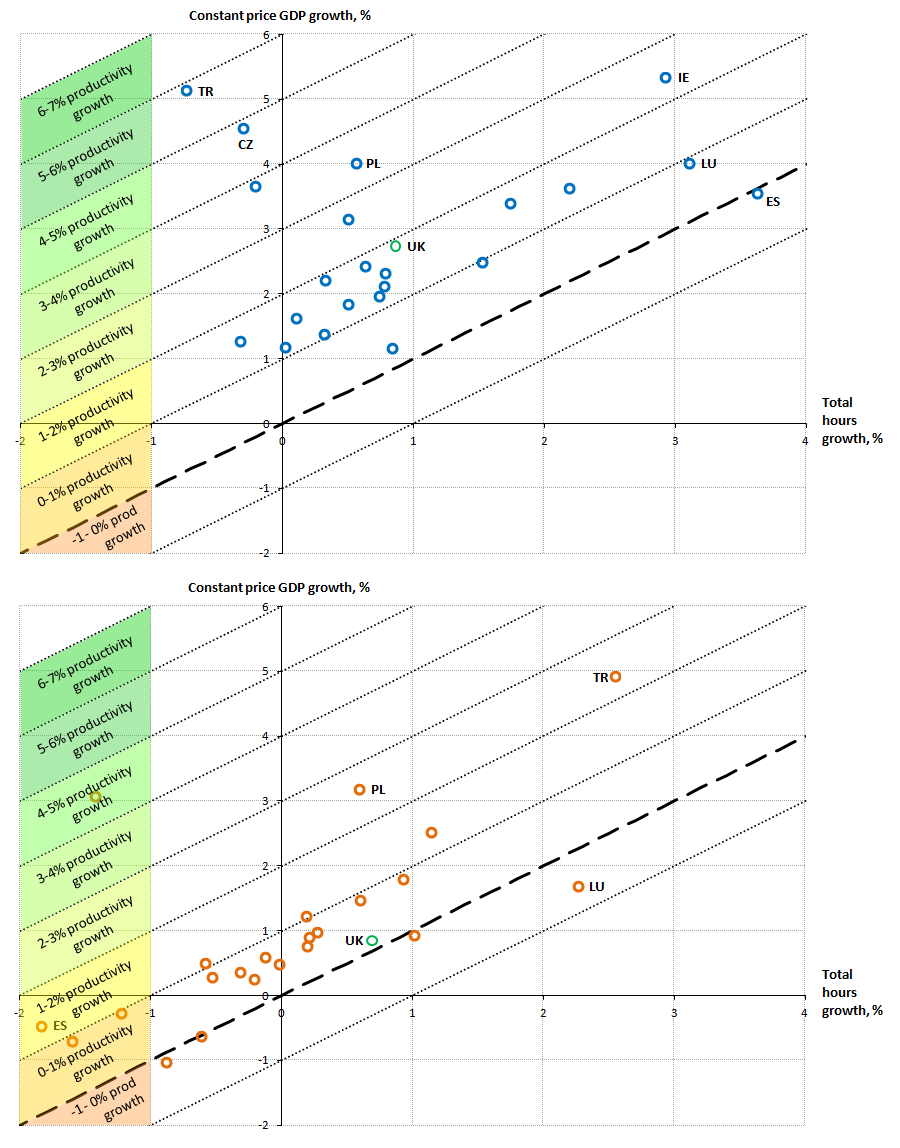
Source: Office for National Statistics
Download this image Figure 6: Average total hours growth vs average GDP growth in OECD countries
.png (123.8 kB) .xlsx (10.6 kB)
During the pre-downturn period, a majority of OECD countries experienced productivity growth of between 1% and 2% per year (Panel A). This was achieved largely as a consequence of strong and positive output growth combined with more modest, if still positive growth in hours. For a minority of countries – including Turkey and the Czech Republic – strong output growth was combined with falling total hours over this period, while a similar minority – including Ireland, Spain and Luxembourg – experienced very strong hours growth. Only one nation – Spain – experienced flat or falling productivity on average over this period.
Following the economic downturn – as shown in Panel B – rates of productivity growth have fallen markedly across these OECD nations. A majority of nations have experienced average productivity growth of between 0% and 1% between 2007 and 2015, and on this measure five economies have experienced flat or falling labour productivity over this period – including the UK. Panel B also provides some evidence that this weakening of labour productivity reflects a marked weakening of both GDP and total hours growth. The modest rates of productivity growth which have been achieved are largely a consequence of more modest output growth coupled with much weaker hours growth. Spain is notable again in this regard: having achieved positive productivity growth through a combination of sharp falls in hours worked and more modest falls in output. Taken together, these data suggest that while the productivity puzzle may be particularly acute in the UK – and while there are considerable differences in the level of output per hour in the UK and elsewhere – the broader “puzzle” is present across a wide array of economies.
Back to table of contents6. Regional labour input
As part of a broader package of development work to help explain this recent weakness of UK labour productivity, we have been developing a range of new statistics and analytical outputs. Given growing interest in the relative performance of the different regions of the UK, and following stakeholder feedback, we have developed an experimental set of quarterly labour input metrics, produced using the same methods as those used for the calculation of UK labour productivity. The first of these experimental estimates – which will detail productivity jobs and hours at the NUTS1 (Nomenclature of Territorial Units for Statistics) level on quarterly basis – are published alongside this bulletin with an article detailing the methodology. Subject to user feedback, these data will be updated each quarter in line with the Labour Productivity release.
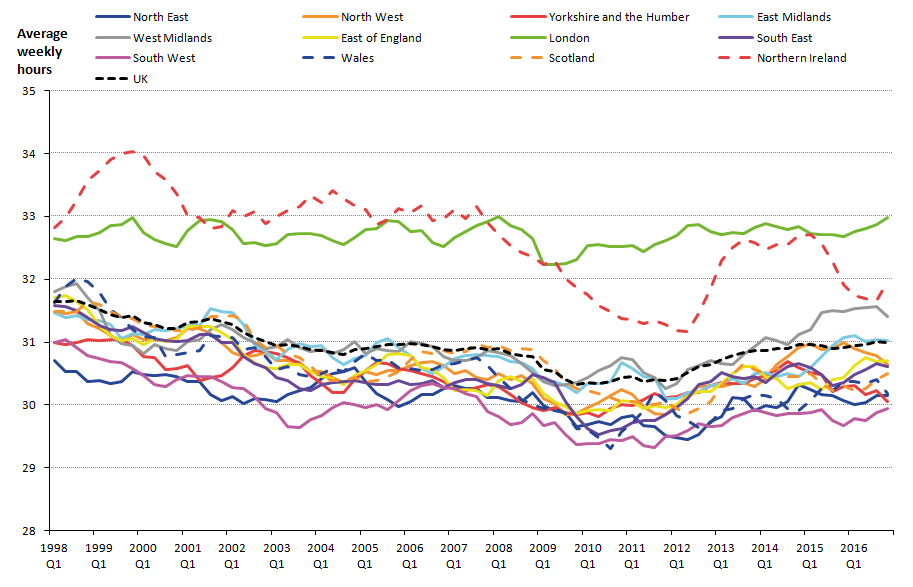
The new estimates of productivity jobs and hours on a regional basis enable a wide range of analysis of the underlying trends supporting aggregate UK labour input, and may in the future support more timely estimates of labour productivity at the regional level. Figure 7 shows one such analysis using these new data, presenting regional average hours per job on a four-quarter moving average basis. It shows that the majority of UK regions recorded an average of between 30 and 31 hours per job per week in 2016. Two regions have historically had considerably higher average hours per job – London and Northern Ireland – while average hours worked in the West Midlands also started to pull away from this group of regions in recent years. Jobs in the South West have recorded some of the lowest average hours worked over much of this period.
Figure 7: Average hours worked
Average weekly hours worked per job, NUTS1 regions
Source: Office for National Statistics
Download this image Figure 7: Average hours worked
.png (67.7 kB) .xls (47.1 kB)
These differences in average hours per job across region partly reflect variation in the mix of job-types in each region. In particular, as full-time jobs have more hours associated with them than part-time jobs, a higher share of full-time jobs in a region would increase average hours in a region relative to a region with more part-time work. Figure 8 provides some supporting evidence for this link by examining Labour Force Survey (LFS) data on the split between full-time and part-time workers in each UK region in 20161. While these data reflect the mix of workers – not jobs – regions with the highest average hours per job (London and Northern Ireland) also have the highest share of full-time workers. Additionally, the regions with the lowest average hours worked per job (the South West and Yorkshire and the Humber) also have the lowest share of full-time workers.
Figure 8: Share of Full- and Part-time Workers
NUTS1 regions, 2016
Source: Office for National Statistics
Download this chart Figure 8: Share of Full- and Part-time Workers
Image .csv .xlsWhile differences in the full- and part-time mix of employment can help to explain some of the variation in average hours per job by region, there is also some evidence that variation in the length of the average full- and part-time working week across regions may also be a factor. Figure 9 attempts to quantify some of these effects. It presents average actual hours per worker per week in each region in 2016 relative to the UK average (the point), which broadly matches the trends of average hours per job in Figure 7: London workers work almost an extra two hours on average compared with the UK as a whole, while workers in the South West work around one hour less than the UK average. In these regions, most of the variation from the UK average reflects differences in the mix of employment: in London, there are relatively more full-time workers than in the UK as a whole, whereas in the South West, part-time working is relatively more prevalent. However, a substantial portion of the variation of average hours in several regions is due to differences in the length of the full- and part-time working week: in London, full- and part-time workers tend to work longer weeks than the average full- and part-time working week. In Wales, by contrast, both full- and part-time workers work shorter weeks than their respective UK averages.
Figure 9: Contributions to differences in average hours worked between regions and UK average
Average weekly hours worked per worker: differences with UK, 2016
Source: Office for National Statistics
Notes:
- Contributions may not sum to totals due to rounding and interactions between changes in the components.
Download this chart Figure 9: Contributions to differences in average hours worked between regions and UK average
Image .csv .xlsAlongside these estimates of quarterly regional labour input, we have also been developing the methodology for examining differences in management across regions. This work uses data from the pilot Management Practices Survey for the manufacturing industries to examine the extent of conditional regional differences in the use of structured management practices across regions. An accompanying research note sets out the challenges which are involved in producing these kinds of statistics – including the need to ensure a sufficient sample size in future surveys to support this work, and the conceptual difficulties of multi-site firms – as well as some preliminary results. These results suggest that if there are significant differences in management practices in the manufacturing industries across regions, the existing sample size is not sufficient to detect them. We will use this preliminary work as a model to inform our analysis of the larger sample sizes we hope to collect in the future.
Notes for: Regional labour input
- Worker’s full-time or part-time status is based on their first job. As a consequence, Figure 8 includes only first jobs.
7. Differences in labour productivity between urban and rural areas
These new estimates of labour input at the regional level have also been accompanied by new ONS analysis of differences in the labour productivity of businesses located in rural and urban areas respectively. Using firm-level data from the Annual Business Survey (ABS) and the Business Register Employment Survey (BRES) this work concludes that in England and Wales the gross value added (GVA) per worker of businesses in urban areas (excluding London) was around 5% higher than in that of rural areas in 2014.
However, while this effect holds on average across the UK, the results suggest that there are some considerable differences in the urban productivity premium across the country. Table 1 shows that in the South of England (excluding London), average labour productivity is much higher in urban areas than it is in rural areas. It also shows that productivity differs by size of urban area, as large- and medium-sized urban areas record a higher level of productivity than small urban areas. By contrast, for the North and Midlands of England, there is no labour productivity advantage of urban areas over rural areas, and no correlation between the size of urban area and average labour productivity.
Table 1: GVA per worker in the private business economy, 2014
| Units | GB=100 | |||||
| Rural | Urban | Small Urban (10,000-99,999) | Medium Urban (100,000-499,999) | Large Urban (500,000-999,999) | Major Urban (1 million+) | |
| North and Midlands of England | 85 | 81 | 79 | 81 | 77 | 81 |
| South of England (excluding London) | 81 | 95 | 84 | 98 | 101 | n/a |
| Source: Office for National Statistics | ||||||
Download this table Table 1: GVA per worker in the private business economy, 2014
.xls (26.1 kB)These differences are striking, as economic theory argues that large urban areas tend to have stronger productivity than rural areas on account of the agglomeration economies that arise at higher densities. Agglomeration economies are the benefits (which include knowledge spillovers, specialised labour and factor input markets and network effects) that firms obtain by locating near each other in dense urban areas and as such are usually expected to have a positive impact on productivity in larger urban areas compared with small urban areas and rural areas. However, the labour productivity results shown in Table 1 for the South of England show such a pattern, but they do not for the North and Midlands of England. The reasons for these striking regional differences are something that we intend to return to in future work.
Back to table of contents8. The distribution of labour productivity
In addition to this analysis of differences in labour productivity in rural and urban areas of the UK, we have also published detailed analysis of the distribution of labour productivity in firms across the UK. This work also uses firm-level data from the Annual Business Survey (ABS) and employment data from the Inter-Departmental Business Register (IDBR) to analyse productivity trends and distributions among businesses in the non-financial business economy of the UK1 for the period 2006 to 2015.
Figure 10 shows the distribution of firms by their productivity (gross value added divided by employment) in constant (2015) prices. It shows that the mass of firms have annual output per worker within the £5,000 to £25,000 range, and a gradually falling share of firms with higher levels of productivity to the right of the distribution. The left of the distribution shows firms which report higher levels of purchases than their turnover within the year (reflecting relatively substantial operating losses), resulting in negative value added per worker. The shape of this distribution is consistent with previous work for the UK and for other countries, which details the breadth of labour productivity outcomes across firms.
Figure 10: Distribution of firm level GVA per worker in constant prices
UK, 2006 to 2015

Source: Annual Business Survey (ABS), Inter-Departmental Business Register (IDBR) – Office for National Statistics
Notes:
- Kernal Density, Bandwidth size = 4.
- Firms can have negative levels of value added per worker in specific periods when they report larger values of purchases than their total turnover.
- Includes all firms covered by the Annual Business Survey (ABS) excluding sections K (Financial and Insurance Activities) and L (Real Estate Activities), weighted to reflect the population of firms.
Download this image Figure 10: Distribution of firm level GVA per worker in constant prices
.png (31.5 kB) .xls (60.9 kB)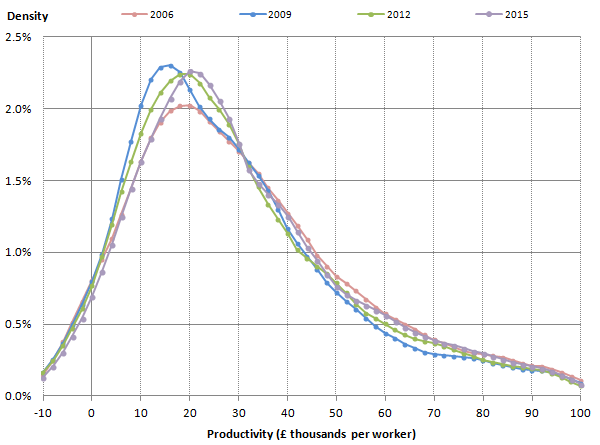
While the shape of the distribution – a fairly concentrated mass at a relatively low level of productivity followed by a long right-hand tail – is similar in each year, Figure 10 also highlights some of the changes that have taken place in this distribution since the onset of the economic downturn in 2008. In particular, the proportion of firms with low or negative productivity has changed through time, as indicated by the rightwards shift of the density curve at negative levels of output per worker. This suggests that the downturn has led some low-productivity firms to cease trading – although the magnitude of this effect relative to that in previous downturns is hard to assess. The more detailed results of the paper suggest that many of these exiting firms were relatively small in employment terms – as the distribution of labour productivity per worker contains a less marked shift of this sort.
While changes at the bottom of the productivity distribution appear to be relatively marked, changes at relatively high levels of productivity have been more muted. Figure 10 shows that the share of firms with annual labour productivity of more than £50,000 per year fell during the economic downturn, signalling that even as less productive firms were dropping out of the distribution, the share of firms with relatively high levels of productivity was falling. Only relatively recently has the density of firms at these high levels of productivity returned to its pre-downturn level.
The detailed results of the article examine these relatively high productivity firms in more detail, finding that they include companies from several different industries. Figure 11 shows the industrial composition of the top 10% of firms in terms of gross value added (GVA) per worker. These highly productive firms consistently represent a broad range of industries over the period 2006 to 2015. Around three-quarters of these firms were in service industries across this period, while firms in the remaining quarter were in either production or construction.
Figure 11: Industry distribution of the top 10% of firms by productivity
UK, 2006 to 2015
Source: Annual Business Survey (ABS), Inter-Departmental Business Register (IDBR) – Office for National Statistics
Notes:
- Includes all firms covered by the Annual Business Survey (ABS) excluding sections K (Financial and Insurance Activities) and L (Real Estate Activities).
- Key: Production = Sections A (Agriculture, Forestry and Fishing), B (Mining and Quarrying), C (Manufacturing), D (Electricity, Gas, Steam and Air Conditioning Supply) and E (Water Supply; Sewerage, Waste Management and Remediation Activities). Construction = Section F (Construction). Services: Administration = Section N (Administrative and Support Service Activities). Services: Professional = Section M (Professional, Scientific and Technical Activities). Services: Distribution, hotels & restaurants = Sections G (Wholesale and Retail Trade; Repair of Motor Vehicles and Motorcycles) and I (Accommodation and Food Service Activities). Services: Transport, storage, & communication = Sections H (Transportation and Storage) and J (Information and Communication). Services: Other = Sections P (Education), Q (Human Health and Social Work Activities), R (Arts, Entertainment and Recreation) and S (Other Service Activities).
Download this chart Figure 11: Industry distribution of the top 10% of firms by productivity
Image .csv .xlsHowever, there have been some notable changes through time as well. Examining the more detailed industry groups, firms in Professional, Scientific and Technical industries account for 3 in every 10 firms in 2015 up from around 23% in 2006. This was at the expense of firms in Distribution, hotels and restaurants declining from 16.8% in 2006 to 10.6% in 2015, Other services from 9.2% to 6.7% and Production from 6.7% to 5.8% over the same period. The reasons and drivers for these changes will be the focus of further ONS analysis, which should increase understanding of the dynamics of the labour productivity landscape.
Notes for: The distribution of labour productivity
- This excludes businesses in the financial, and real estate industries.
9. Multi-factor productivity
Alongside these analytical outputs, we have also published annual estimates of multi-factor productivity (MFP). These measures complement traditional measures of labour productivity – which account for changes in labour input alone – by examining how much output growth can be attributed to the growth of a broader range of factor inputs. Our experimental growth accounting framework divides market sector output growth into that attributable to growth in the quantity of labour applied to production (hours worked), the composition or quality of that labour and capital inputs to production. The last of these factors – capital input to production – is measured by capital services which take account of changes in the composition of the productive stock of capital over time. This decomposition leaves a residual – known as multi-factor productivity – which captures how effectively firms combine labour and capital. This measure of productivity is more holistic, and is therefore closer in nature to a measure of the productivity of the production process as a whole.
These estimates show that in 2015 MFP contributed 1.0 percentage points to growth of market sector output (3.0%), with the remaining output growth being accounted for by increased hours worked (1.4 percentage points) and increased capital inputs. Labour composition is estimated to have made a negative – albeit negligible – contribution to output growth in 2015. Figure 12 shows decompositions of market sector output growth since 1997. The contribution of MFP in 2015 was a little lower than in 2014 and also a little lower than the average prior to the economic downturn which started in 2008. Growth in the quantity of labour input in production made the largest, positive contribution to market sector output growth for the fourth year in a row, while changes in the volume of capital input continued to make a relatively modest contribution. Figure 12 also highlights the lower contribution of labour composition in recent years. Although this component has made positive contributions to output growth over the period as a whole, labour composition has been negligible or slightly negative since 2014.
Figure 12: Market Sector: Decomposition of annual output growth
UK
Source: Office for National Statistics
Download this chart Figure 12: Market Sector: Decomposition of annual output growth
Image .csv .xlsMFP estimates can also be rearranged to provide a breakdown of movements in labour productivity, as measured by output per hour (Figure 13)1. In this depiction, changes in labour composition, capital and MFP are all expressed per hour worked, and the capital element in particular denotes changes in the availability of capital per unit labour – known as capital deepening. Market sector output per hour worked grew by 0.8% in 2015 which was a little lower than the change in MFP (constant between Figures 12 and 13). The combination of relatively slow growth of capital inputs and relatively strong growth of hours worked means that capital deepening has been negative in each of the last 6 years, in sharp contrast to consistently positive contributions from this component prior to the economic downturn.
Figure 13: Market Sector: Decomposition of labour productivity growth
UK
Source: Office for National Statistics
Download this chart Figure 13: Market Sector: Decomposition of labour productivity growth
Image .csv .xlsThese growth accounting results for the market sector are accompanied by similar results for several high-level industries. Figure 14 shows decompositions of labour productivity across industries, presented as annual averages since 2009. Average growth of output per hour has varied from 2.5% in construction to negative 5.0% in (market sector) education and health. For the market sector as a whole, average growth of output per hour is 0.2%. Capital deepening has also varied in sign and magnitude, albeit not as much as output per hour. By contrast, labour composition has been consistently positive across all industries over this period, which implies that variations in MFP account for the largest element of the difference in labour productivity across industries. MFP growth over this period has been positive for 7 of the 10 industries shown, and fractionally positive for the market sector as a whole.
Figure 14: Decomposition of annual average labour productivity growth by industry
UK, 2010 to 2015
Source: Office for National Statistics
Notes:
- ABDE includes Agriculture; Forestry & Fishing; Mining & quarrying and Utilities. C is Manufacturing. F is Construction. GI is Wholesale & retail trade and Accommodation & food services. H is Transportation & storage. J is Information & communication. K is Financial & insurance activities. LMN is Real estate activities; Professional & scientific activities and Administrative & support activities. PQ is Education and Health & social work. RSTU is Arts & Entertainment and Other services. Total MS is total market sector.
Download this chart Figure 14: Decomposition of annual average labour productivity growth by industry
Image .csv .xlsNotes for: Multi-factor productivity
- In this depiction, the time series for labour productivity growth is based on the same source data as market sector output per hour in the labour productivity statistical bulletin, but applies a different methodology to accommodate the industry breakdown used in the MFP framework. The capital contribution in this decomposition reflects changes in capital services per hour of labour input, usually referred to as capital deepening.
Contact details for this Article
Related publications
- Labour productivity, UK: October to December 2019
- Public service productivity: quarterly, UK, October to December 2019
- International comparisons of UK productivity (ICP), final estimates: 2021
- Labour productivity measures from the Annual Business Survey: 2006 to 2015
- An initial assessment of regional management practices: 2015
- Multi-factor productivity estimates, UK: July to September 2019
- Exploring labour productivity in rural and urban areas in Great Britain: 2014
- Introducing quarterly regional labour input metrics