1. Abstract
This article presents new estimates of market sector capital services, which are the preferred measure of capital input into production and for use in analysing and modelling productivity, as well as in growth accounting analyses. New estimates are provided for 2015 and earlier estimates have been revised, reflecting revisions to source data and methodological changes. Capital services estimates in this article will be incorporated in growth accounting estimates in a future article. Estimates for 2015 show that capital services across the UK market sector grew at a rate of 1.8%. This was the fastest rate since 2008 and the fourth successive year of growth above 1%, but still well below rates of growth prior to the economic downturn. Average growth of aggregate capital services has been marginally revised compared with previous estimates over the period since 1990, although there are significant revisions to growth rates of capital services for individual industries.
Back to table of contents2. Acknowledgements
The authors would like to thank Gavin Wallis of the Bank of England for providing Tax Adjustment Factors used in the underlying calculations.
Back to table of contents3. Introduction
About this release
This article is the latest in a series of articles which present experimental estimates of capital services. Capital services capture the estimated contribution of the accumulated stock of capital to production. Whereas measures of the capital stock are measures of wealth – placing a value on the total stock of assets – measures of capital services better reflect the value of the services which those assets provide. The former concept, for instance, values a machine or vehicle at its resale value, while the latter concept captures the contribution that the same machine or vehicle makes to production. Under certain assumptions, these services are close in value to the rental that a firm might pay for the use of an equivalent asset for a given period. It is these capital services which firms combine with labour input to deliver output.
Capital services are informative in their own right, not least in terms of their time series properties compared with the widely used conventional measures of capital stocks1. However, the main motivation for their estimation is as an input to multi-factor productivity (MFP), within a growth accounting framework. This provides a decomposition of the growth rates of economic output and labour productivity into contributions due to changes in inputs of factors of production (labour and capital) and a residual component described as MFP. Movements in capital services rather than movements in the national accounts estimates of capital stocks are the preferred measure of changes in capital inputs in this framework (Harris and Drinkwater, 2000). MFP estimates will be published in a forthcoming article using the capital services estimates in this release.
The estimates in this release are presented for 10 industry groups, for 10 asset classes and for the aggregate market sector. Like the previous edition published in March 2016, we do not present estimates for the non-market sector, where the relationship between capital accumulation and production differs from the classic production function framework. This means that we also do not present estimates for capital services for the whole economy.
There are also implications for comparisons between estimates of capital services and our official estimates of capital stocks. Capital services and capital stocks both use detailed, long run estimates of asset accumulation, but differ in their coverage, compilation methods and aggregation. Conceptually, capital services measure flows of capital into production, whereas capital stocks measure wealth embodied in capital assets.
Layout of article
The rest of this article is structured as follows. The following section describes what is new in this edition, summarising the main changes to sources and to the methodology. This section also provides some discussion of the sensitivity of our results to different assumptions, for example on the profiles over which capital assets degrade over time, where the evidence base is weak.
Next, 3 results sections present results at the aggregate, industry and asset level. A full set of underlying estimates of growth rates and weights for all component industries and assets in the capital services system can be found in the dataset component of this release. We also present estimated rates of return on capital which are implied within the capital services framework, and some comparisons of growth rates of capital services with growth rates of capital stocks, which are widely used as proxy measures for changes in capital.
Following on from the results sections, this article examines revisions from previous estimates. Typically, revisions are larger at component level than for the market sector as a whole, and principally reflect revisions to source data.
The next section compares capital stock estimates within the capital services system against published capital stocks figures. Differences reflect coverage and methodology: in particular, both the institutional sector and asset coverage vary between these releases. As noted above, the capital services system focuses on the market sector while our official capital stock estimates cover the whole economy. Capital services also exclude dwellings and transfer costs, on the grounds that these asset classes do not contribute directly to production. By contrast, the official capital stocks estimates include all produced assets that are included in the national accounts framework.
The principal methodological difference between the 2 systems concerns the age-price profile of assets, that is, the rate at which assets lose value over their lifetimes. For capital services, we follow international guidance in adopting a geometric profile, such that assets depreciate at a constant rate, such as 5% per year. Official capital stock estimates are compiled by assuming straight line depreciation, such that an asset with a life of 20 years would depreciate by 20 equal increments.
The last section in the main article is a short section on next steps. As always, feedback from users is welcome. Contact details are provided in the Background notes.
Notes for: Introduction
- Our estimates of capital stocks are presented in monetary units, in current prices and chained volume measures (CVMs), and gross and net of depreciation. Capital services are unit-less volume estimates and are presented as indices and changes in indices. The relevant comparison, as discussed further below, is between capital services and net CVM capital stocks. It is also worth noting that compilation of capital services requires compilation of net capital stocks (in volume and value terms) as an intermediate step. Some comparisons between these 2 sets of capital stock estimates are shown below and in the data table accompanying this release.
4. What's new?
Source data
Capital services estimates are derived by weighting changes in real productive capital stocks by a set of weights which reflect relative user costs of the different asset components. Stocks of real productive capital are derived by accumulating flows of new net asset acquisition (that is, flows of investment or gross fixed capital formation (GFCF)) over time. Since today’s capital stock of long-lived assets such as buildings and structures is a function of GFCF over many years, the principal data source for capital services are long time series of GFCF. Moreover, since relative user costs depend, among other factors, on relative asset prices, it is convenient to assemble the source data as (i) a set of current price (CP) GFCF components by asset type and industry and (ii) the corresponding asset price deflators. The constant price or volume GFCF series required for the asset accumulation process can then be derived by deflating the CP estimates, and the deflators can be used to infer relative asset price movements.
For 1997 onwards, our point of departure is a set of detailed GFCF estimates by industry and asset from our Business Investment system. These estimates are consistent with Blue Book 2016.
We have made the following modifications to this dataset:
- we have made an adjustment to undo the effect of the classification change arising from the transfer of British Nuclear Fuels Ltd between private non-financial corporations and public corporations in 2005 (otherwise the classification change would manifest itself in a very large upward spike in manufacturing GFCF in other machinery and equipment in that year, reflecting the large negative value of the assets transferred)
- for 3 tangible assets (buildings, vehicles and other machinery and equipment) we have used deflators which vary across industry – these deflators are taken from legacy data from 2010, converted to SIC 2007 and benchmarked to the aggregate asset deflator in the business investment dataset
- we have adopted a revised deflator for mineral extraction rights as used in the capital stocks dataset
- we have split software into 2 components, purchased and own-account
- we have over-written industry-level splits for buildings (1997 to 2001) and vehicles (1997 to 2006) to avoid negative capital stocks – again our alternative source is 2010 legacy data and we are working with our colleagues in the business investment team to address issues with these industry–by-asset estimates
For earlier years we have spliced on market sector GFCF estimates taken from the 2010 legacy dataset. This represents a change from the previous release, which spliced on the nearest equivalent series in the dataset underlying our official capital stock estimates. We believe this change brings about improved consistency between the coverage and scope of the pre- and post-1997 GFCF estimates.
Methodology
Deterioration profiles
The methodology for calculating productive stocks has been revised to align estimates in the capital services system more closely with the national accounts capital stock estimates. This has been achieved by setting depreciation rates such that the total contribution to net stocks that an asset of a particular vintage has over its lifetime is approximately equal in both systems. It is still the case that the form of depreciation differs in the 2 systems, so stock estimates will not be equal even where the underlying GFCF estimates are equal.
As described further below, this change, and a further change to remove assets once they have reached twice their average life length, has very little impact on our results.
Tax Adjustment Factors
Tax Adjustment Factors (TAFs) are used in the capital services system to reflect differences in the tax treatment of different asset classes. The quality-assurance process highlighted that the previous release did not adjust for TAFs in a fully consistent fashion. This has been corrected in the current release. This makes little difference to estimates of capital services, although it does lead to a somewhat different profile for the rate of return on capital.
War losses
To improve consistency with national accounts estimates of capital stocks, we have introduced war loss adjustments. These are the same war loss adjustment factors used in the national accounts, weighted by gross stock for the industry breakdown used in the capital services framework. The final adjustment factors are given in Table 1. Adjustments are made only to buildings, and other machinery and equipment, in 1942, and the impact varies by industry. The largest adjustment is to other machinery and equipment in industry DE (electricity, gas and water), where the 1942 stock is reduced by slightly less than 12%. No adjustments are made to industries that are not listed in Table 1. In the aggregate, total net stock is reduced by approximately 2% in 1942; this reduction decreases in relative magnitude in the years until 2015, at which point the adjustment makes a minimal difference.
Table 1: War loss adjustment factors
| Industry | Asset | |
| Buildings | Other machinery and equipment | |
| AB | 0.997 | 0.963 |
| C | 0.963 | 0.958 |
| DE | 0.966 | 0.882 |
| F | 0.980 | 0.990 |
| J | 0.982 | 0.992 |
| RSTU | 1.000 | 0.999 |
| Source: Office for National Statistics. | ||
| Notes: | ||
| 1. All other industries and assets have no adjustments. | ||
| 2. A refers to Agriculture, forestry and fishing B refers to Mining and quarrying C refers to Manufacturing D refers to Electricity, gas, steam and air conditioning supply E refers to Water Supply, Sewerage, Waste Management and Remediation Activities F refers to Construction J refers to Information and communication RSTU refers to Other Services. | ||
Download this table Table 1: War loss adjustment factors
.xls (26.6 kB)Sensitivities
The capital services model presented in this article requires a number of decisions to be made during the modelling stage. Key amongst these is to decide what depreciation and retirement functions to use, and how to calculate the rate of return on capital. Both of these elements of the model have undergone methods changes since the last release, and so, in order to ensure robustness of our results, we have conducted a sensitivity analysis to understand the impact that these methods changes have on capital services growth.
The model variants used as comparisons are detailed in Table 2. The first variant replicates the model used in the previous release, the second isolates the impact of changes to the rate of return method, and the third focuses on the changes to the depreciation function. The final comparator reuses the depreciation functions used in earlier releases, using declining balance rates from our Productivity Handbook, which are also commonly used internationally.
Table 2: Description of sensitivities
| Depreciation | Retirement | Rate of return | |
| Central case | Variable DBRs | Kill assets | With TAFs |
| Variant 1 (Last year’s model) | DBRs=2 | No kill | No TAFs |
| Variant 2 (No TAFs model) | Variable DBRs | Kill assets | No TAFs |
| Variant 3 (DBRs=2 model) | DBRs=2 | No kill | With TAFs |
| Variant 4 (Prod Handbook model) | Prod Handbook DBRs | Kill assets | With TAFs |
| Source: Office for National Statistics. | |||
| Notes: | |||
| 1. TAFs refers to Tax Adjustment Factors; DBRs refers to Declining Balance Rates, which are an input into the depreciation profile; Prod Handbook refers to our Productivity Handbook, and the DBRs defined therein. | |||
Download this table Table 2: Description of sensitivities
.xls (26.6 kB)Table 3 shows the headline results from each counterfactual model. Arguably the most striking result is that the different assumptions make little difference to capital services. Capital services growth in the central case is within 0.1 percentage points of all other models in 2015, within 0.05 percentage points for the 1997 to 2008 average, and within 0.15 percentage points for the 2008 to 2015 average. This suggests that the results we present as our central case are robust to methods changes, and are generally comparable to results in previous releases and those produced by external authors, including Oulton and Wallis (2015).
Table 3: Impact of sensitivities on overall capital services
| Capital services growth, 2015 | Compound average growth, 1997 to 2008 | Compound average growth, 2008 to 2015 | |
| Central case | 1.82% | 2.69% | 1.13% |
| Variant 1 (Last year’s model) | 1.83% | 2.64% | 1.04% |
| Variant 2 (No TAFs model) | 1.77% | 2.69% | 1.07% |
| Variant 3 (DBRs=2 model) | 1.87% | 2.65% | 1.10% |
| Variant 4 (Prod Handbook model) | 1.84% | 2.74% | 1.27% |
| Source: Office for National Statistics. | |||
| Notes: | |||
| 1. TAFs refers to Tax Adjustment Factors; DBRs refers to Declining Balance Rates, which are an input into the depreciation profile; Prod Handbook refers to our Productivity Handbook, and the DBRs defined therein. | |||
Download this table Table 3: Impact of sensitivities on overall capital services
.xls (27.1 kB)There is more variation at the industry and asset breakdown level. Table 4 details the fastest- and slowest-growing industries and assets in 2015 in each counterfactual model. In each model, it is the same industries and assets that are the fastest and slowest growing, but the rates of growth do vary in some cases. Beyond those differences presented in Table 4, the central case model is rarely different for any asset or industry in 2015 by more than 0.2 percentage points, although a notable exception to this is in vehicles, where variants 1 and 3 show significant uplifts in growth. Variant 4 has the largest impact across the board, which is as expected given that it involves the largest change to any of the parameters.
Table 4: Impact of sensitivities, selected industries and assets
| Fastest growing industry in 2015 - Administrative services | Slowest growing industry in 2015 - Manufacturing | Fastest growing asset in 2015 - Purchased software | Slowest growing asset in 2015 - Mineral extraction rights | |
| Central case | 7.71% | -0.83% | 7.25% | -2.67% |
| Variant 1 (Last year’s model) | 7.86% | -0.76% | 7.33% | -2.88% |
| Variant 2 (No TAFs model) | 7.77% | -0.82% | 7.25% | -2.67% |
| Variant 3 (DBRs=2 model) | 7.82% | -0.82% | 7.34% | -2.81% |
| Variant 4 (Prod Handbook model) | 7.75% | -0.69% | 7.34% | -2.81% |
| Source: Office for National Statistics. | ||||
| Notes: | ||||
| 1. In all variants, the industries and assets which are the fastest and slowest growing in 2015 are the same. These are: Administrative services, manufacturing, purchased software, and mineral extraction rights, respectively. | ||||
| 2. TAFs refers to Tax Adjustment Factors; DBRs refers to Declining Balance Rates, which are an input into the depreciation profile; Prod Handbook refers to the ONS Productivity Handbook, and the DBRs defined therein. | ||||
Download this table Table 4: Impact of sensitivities, selected industries and assets
.xls (27.6 kB)5. Results
Overall results
Figure 1 shows how different assets have contributed to growth in market sector capital services since 1997. The largest contribution is from Buildings, which accounts for around one-third of the total increase in capital services over this period. However, there are also sizeable contributions from ICT and the 2 software components. Taken together these assets have contributed more to the growth of capital services than buildings, although in stock terms their share is far lower. For example, in 2015 buildings comprised half of the overall stock of productive capital as estimated in the capital services system, while the combined share of ICT and software was below 7%.
There is a small negative contribution to capital services from mineral extraction rights, likely reflecting the declining importance of North Sea oil. This, however, has minimal impact on the aggregate.
Figure 1: Cumulative contributions to growth in capital services by asset
UK, market sector, 1997 to 2015

Source: Office for National Statistics
Download this image Figure 1: Cumulative contributions to growth in capital services by asset
.png (34.7 kB) .xls (30.2 kB)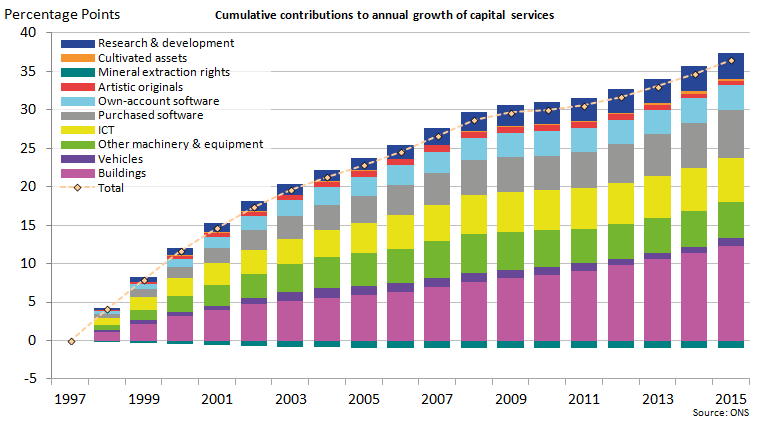
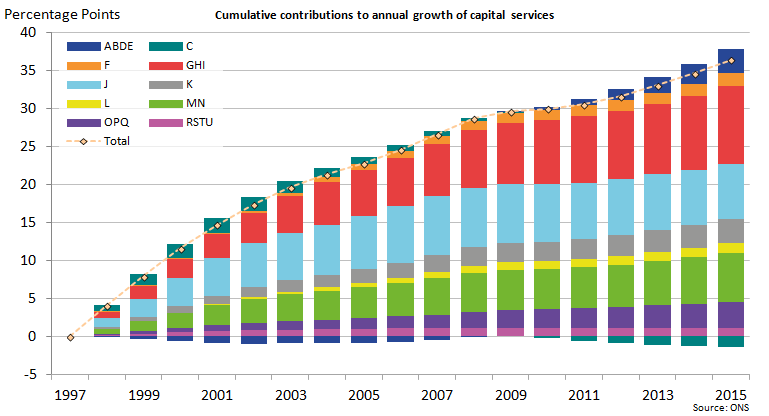
Contributions from different industries are shown in Figure 2. Capital services in industry J (information and communication) grew rapidly up to 2008 but the growth rate has since waned. There has been a large and growing contribution from industries G (wholesale and retail trade), H (transportation and storage) and I (accommodation and food services), which is also the largest category in terms of shares of productive capital. Capital services in industry C (manufacturing) made positive contributions initially, but this trend has reversed and capital inputs in this industry were lower in 2015 than in 1997.
Figure 2: Cumulative contributions to growth in capital services by industry
UK, market sector, 1997 to 2015
Source: Office for National Statistics
Notes:
- A refers to Agriculture, forestry and fishing
B refers to Mining and quarrying
C refers to Manufacturing
D refers to Electricity, gas, steam and air conditioning supply
E refers to Water Supply, Sewerage, Waste Management and Remediation Activities
F refers to Construction, G refers to Wholesale and retail trade; repair of motor vehicles
H refers to Transportation and storage
I refers to Accommodation and food services
J refers to Information and communication
K refers to Financial and insurance activities
L refers to Real Estate activities
M refers to Professional, scientific and technical activities
N refers to Administrative and support service activities
O refers to Public administration and defence; compulsory social security
P refers to Education
Q refers to Health
RSTU refers to Other Services.
Download this image Figure 2: Cumulative contributions to growth in capital services by industry
.png (31.2 kB) .xls (30.2 kB)
Rates of return
Returns on capital form an element of the overall user cost of capital in the capital services system, alongside an allowance for depreciation and a term which represents relative asset price movements. Following the OECD Measuring Capital manual (OECD, 2001a), returns are computed net of the general rate of inflation as measured by the Consumer Prices Index (CPI), that is, they are “real” returns.
Returns are calculated endogenously, using information from the national accounts on market sector capital income, estimates for depreciation consistent with those used in the stock accumulation equations, and Tax Adjustment Factors supplied by the Bank of England. It is worth noting that the national accounts derive capital income by residual (taking nominal gross domestic product (GDP) minus labour income and a small tax adjustment), rather than measuring the explicit returns to produced assets. In practice it is likely that some element of capital income reflects returns to unmeasured forms of capital, such as land and inventories. This would mean that our estimates for returns on capital are too high. We plan to return to this issue in 2017.
The real rate of return on capital is estimated at 14.5% in 2015, 1 percentage point higher than the rate in 2014 and the highest since 2006 (which in turn was the highest since 1973). Returns on capital have increased strongly since 2010, and are now above the average over the last 40 years or so, albeit still lower than returns recorded in the 1950s and 1960s.
Figure 3: Real rate of return on capital
UK, market sector, 1950 to 2015
Source: Office for National Statistics
Download this chart Figure 3: Real rate of return on capital
Image .csv .xlsCapital services by industry
Trends in average growth in capital services across industries are shown in Table 5. Generally speaking, growth rates have been lower since the 2008 downturn than prior to the downturn. Only industries AB (agriculture, forestry and fishing; and mining and quarrying), DE (electricity, gas, steam and air conditioning supply; and water supply, sewerage, waste management and remediation activities) and Q (health services) have seen stronger average growth over this more recent period than before the economic downturn.
The industries with the slowest growth rates of capital services over the post-2008 period have been industries C (manufacturing), J (information and communication), M (professional activities) and RSTU (other services).
Table 5: Growth of capital services by industry
| UK, market sector, 1990 to 2015 | ||||
| Average capital services growth rates % | ||||
| Industry Group | 1990 to 2000 | 2000 to 2008 | 2008 to 2015 | 2015 |
| AB | -0.6% | -1.7% | 1.2% | 1.9% |
| C | 2.5% | -0.9% | -1.5% | -0.8% |
| DE | 2.9% | 2.7% | 4.0% | 3.3% |
| F | 2.5% | 5.8% | 2.5% | 4.0% |
| G | 5.6% | 2.6% | 1.4% | 2.5% |
| H | 3.0% | 4.1% | 2.1% | 2.3% |
| I | 5.5% | 2.6% | 1.4% | 2.9% |
| J | 7.5% | 3.9% | -0.8% | -0.2% |
| K | 4.8% | 3.6% | 1.8% | 2.6% |
| L | 5.5% | 8.5% | 2.6% | 2.2% |
| M | 6.2% | 3.4% | 0.4% | 0.2% |
| N | 6.3% | 3.8% | 3.7% | 7.7% |
| P | 3.1% | 4.9% | 3.2% | 3.1% |
| Q | 6.4% | 4.5% | 6.5% | 6.9% |
| RSTU | 5.0% | 2.0% | -0.1% | 0.2% |
| Total | 3.9% | 2.2% | 1.1% | 1.8% |
| Source: Office for National Statistics | ||||
| Notes: | ||||
| 1. A refers to Agriculture, forestry and fishing B refers to Mining and quarrying C refers to Manufacturing D refers to Electricity, gas, steam and air conditioning supply E refers to Water Supply, Sewerage, Waste Management and Remediation Activities F refers to Construction G refers to Wholesale and retail trade; repair of motor vehicles H refers to Transportation and storage I refers to Accommodation and food services J refers to Information and communication K refers to Financial and insurance activities L refers to Real Estate activities M refers to Professional, scientific and technical activities N refers to Administrative and support service activities O refers to Public administration and defence; compulsory social security P refers to Education Q refers to Health RSTU refers to Other Services. | ||||
Download this table Table 5: Growth of capital services by industry
.xls (29.2 kB)Results by asset
Table 6 shows the average growth in capital services since 1990 and shows that the trend rate of growth for most assets has declined. During the 1990s the average growth of ICT (18.9%), purchased software (23%) and own-account software (12.7%) was considerably greater than other assets but this growth has slowed considerably. The other asset classes showed modest growth apart from mineral extraction rights, which declined by an average of 5% per year.
Between 2000 and the economic downturn in 2008, the average growth rate for most assets declined compared with the 1990s, with the largest declines seen in ICT and the two software components. However, vehicles and R&D bucked this trend. Since the downturn this trend has continued with ICT and both types of software seeing the largest decline in growth. Cultivated assets and mineral extraction rights are the only assets where growth of capital services since 2008 is stronger than the pre-downturn trend.
Table 6: Growth of capital services by asset
| UK, market sector, 1990 to 2015 | ||||
| Average capital services growth rates % | ||||
| Asset Group | 1990 to 2000 | 2000 to 2008 | 2008 to 2015 | 2015 |
| Buildings | 3.6% | 1.8% | 1.6% | 2.1% |
| Vehicles | 0.3% | 1.0% | -0.2% | 6.0% |
| Other machinery and equipment | 1.7% | 1.1% | -0.3% | 0.1% |
| ICT | 18.9% | 9.5% | 2.9% | 4.9% |
| Purchased software | 23.0% | 8.3% | 5.2% | 7.2% |
| Own-account software | 12.7% | 4.4% | 1.0% | 0.4% |
| Artistic originals | 5.7% | 1.8% | -1.5% | -1.8% |
| Mineral extraction rights | -5.0% | -8.7% | -0.0% | -2.7% |
| Cultivated assets | 2.6% | 1.5% | 4.8% | 4.2% |
| Research & development | 1.9% | 2.5% | 1.6% | 1.6% |
| Source: Office for National Statistics | ||||
Download this table Table 6: Growth of capital services by asset
.xls (27.6 kB)Estimates of capital services by asset can be volatile from year to year, reflecting volatility in the underlying GFCF series for assets with relatively short lives. Assets demonstrating above-average volatility include vehicles, ICT, purchased software and mineral extraction rights. Assets with below-average volatility include buildings and artistic originals.
Capital services and capital stocks
As noted above, estimates of capital stocks and capital services differ in the quantities they seek to measure. The capital stock values the accumulated assets available for production, while capital services value the contribution which those assets make to production in a given period. As the size of the productive capital stock is a key determinant of capital services, these 2 concepts are likely to move together in general, but their growth rates are likely to vary in magnitude because of differences in user costs across industries.
Estimates of capital services are derived by weighting changes in stocks of productive assets according to the user costs (or rental prices) of different asset classes. Rental prices can conceptually vary for a single type of asset across different industries, for example due to differences in asset life lengths and price movements. In practice, however, such differences are small, and growth of capital services by asset therefore closely reflects growth of the underlying productive stocks.
Rental prices vary principally by asset and the asset mix varies across industries. This gives rise to differences between trends in capital services and productive stocks, as shown in Figure 4. The general trend since 1997 of capital services growing at a faster rate than capital stocks is clear. The differences are especially pronounced in a number of service industries including J (information and communication), K (finance) and N (administrative and support activities). Industries F (construction), H (transport) and L (real estate) went against the overall trend with capital stocks growing more strongly than capital services.
Figure 4: Comparisons of growth of productive capital stocks and capital services by industry
UK, market sector, 1997 to 2015
Source: Office for National Statistics
Notes:
- A refers to Agriculture, forestry and fishing
B refers to Mining and quarrying
C refers to Manufacturing
D refers to Electricity, gas, steam and air conditioning supply
E refers to Water Supply, Sewerage, Waste Management and Remediation Activities
F refers to Construction
G refers to Wholesale and retail trade; repair of motor vehicles
H refers to Transportation and storage
I refers to Accommodation and food services
J refers to Information and communication
K refers to Financial and insurance activities
L refers to Real Estate activities
M refers to Professional, scientific and technical activities
N refers to Administrative and support service activities
O refers to Public administration and defence; compulsory social security
P refers to Education
Q refers to Health
RSTU refers to Other Services.
Download this chart Figure 4: Comparisons of growth of productive capital stocks and capital services by industry
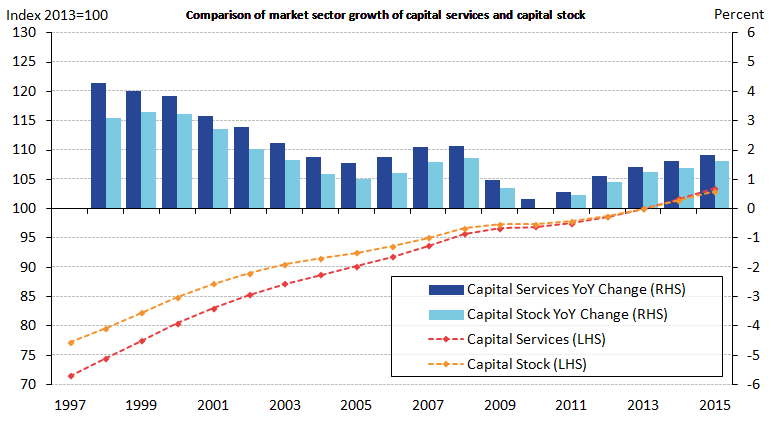
Image .csv .xlsFigure 5 shows the levels and growth rates of capital stocks and capital services for the aggregate market sector. Growth of capital services has outpaced growth of productive capital stocks in every year since 1997, although the margin has diminished in recent years. Intuitively, this reflects a shift in the asset mix towards assets with relatively high user costs, which tends to be assets with shorter asset lives and hence steeper depreciation profiles.
Figure 5: Comparison of productive capital stocks and capital services
UK, market sector, 1997 to 2015
Source: Office for National Statistics
Download this image Figure 5: Comparison of productive capital stocks and capital services
.png (29.1 kB) .xls (28.2 kB)
6. Revisions
Revisions to source data
Although there have been minimal revisions to total business investment in Blue Book 2016 there have been some sizeable revisions at the asset by industry level. Some notable revisions include:
Buildings
- Overall growth of gross fixed capital formation (GFCF) volumes has been revised down a little since 1997, and the change in source data prior to 1997 has led to large downward revisions over this period.
- Investment in buildings by industry F (construction) has been revised downwards in value and volume terms.
- Overall deflator growth is virtually unchanged, but revisions to sources have involved slightly faster deflator growth across the production industries and slightly slower growth across service industries.
Vehicles
- There have been large upward revisions to GFCF volumes, particularly from 2012.
- There have also been sizeable revisions to the splits across industries, towards F (construction) and M (professional services) and away from H (transport) and N (administrative and support activities).
- Deflator growth has been revised downwards, exacerbating the weakness of price trends for this asset. Indeed, overall deflator growth has been negative since 1997, albeit with a marginal increase in 2015.
Other machinery and equipment
- Downward revisions to GFCF volumes since 1997 (but large upward revisions to the pre-1997 series).
- A shift in industry shares of GFCF towards manufacturing, at the expense of the service industry share.
ICT
- Deflator growth has been revised downwards (that is, faster falls in prices), especially prior to 1997.
Revisions to capital services estimates
Figure 6 shows aggregate capital services for the UK market sector in this release alongside the equivalent series from the previous release published in March 2016, both indexed to 2013. Despite revisions to source data and to methodology, the 2 series are very similar.
Figure 6: Capital services revisions
UK, market sector, 1997 to 2015
Source: Office for National Statistics
Download this chart Figure 6: Capital services revisions
Image .csv .xlsThis comparison does, however, mask some large revisions at the industry level. Growth of capital services has been revised up sharply in industries F (construction), L (real estate), P (education) and Q (health). The largest downward revisions to growth affect industries M (professional activities), RSTU (other services), K (finance) and G (distributive trades).
Revisions to capital services by asset are not as pronounced as by industry, and in several cases are minimal. The largest upward revision to growth over the period 1997 to 2014 is to buildings, and the largest downward revision is to other machinery and equipment.
More information on revisions is available in the dataset published alongside this article.
Back to table of contents7. Comparisons with official capital stock estimates
The dataset published alongside this article contains estimates of market sector net capital stocks by asset and industry and these can be compared to net capital stocks also published by us within the Capital Stocks, Consumption of Fixed Capital release, last published in August 2016.
Figure 7 compares levels from the 2 sets of estimates. As noted above there are a number of differences between the 2, reflecting differences in source data and methodology. In addition it should be noted that the capital stocks system does not contain an explicit series for the market sector. The series labelled “National Accounts definition” in Figure 7 has been derived by subtracting dwellings and stocks held by the general government sector (other than dwellings) from the whole economy total. This should result in a broadly like-for-like comparator.
Figure 7: Comparison of net stock estimates
UK, market sector, 1997 to 2015
Source: Office for National Statistics
Download this chart Figure 7: Comparison of net stock estimates
Image .csv .xlsFigure 7 shows that stocks of capital in the capital services system are systematically higher than in our official estimates, although the time series properties are broadly similar. However, further investigation reveals large differences in the asset composition. The capital services system has higher stocks of all assets for which comparisons can be made apart from buildings, where the capital services estimate is around 10% lower in 2015. On the other hand, the capital services estimate for stocks of all intangible assets is around one-third higher than our official estimate in 2015. These differences reflect the interaction of differences in GFCF time series and depreciation profiles.
Back to table of contents8. Next steps
Our next step is to combine these estimates with estimates of quality-adjusted labour inputs (QALI) in order to compile multi-factor productivity (MFP) estimates up to 2015. This is scheduled for publication in April 2017.
Looking further ahead, our priorities for 2017 are as follows.
Development of a quarterly production process for capital services, to support quarterly publication of MFP estimates which we are committed to publishing for the first time in January 2018.
Expand the industry granularity. This reflects parallel planned developments of the QALI system which has traditionally been the constraint on the level of industry granularity within the MFP framework. But even in the absence of these parallel developments, there is no fundamental reason why the capital services system cannot be expanded to the 2-digit industry level.
The combination of quarterly frequency and increased industry granularity will require some investment in streamlining production systems. This will build on work that has already taken place within the national accounts arena, as reported in McLaren and Stapenhurst (2015).
Back to table of contents9. References
Harris R and Drinkwater S (2000) 'UK Plant and Machinery Capital Stocks and Plant Closures', Oxford Bulletin of Economics and Statistics, vol. 62, no. 2
McLaren C and Stapenhurst C (2015), ‘A note on distributions used when calculating estimates of consumption of fixed capital’, ONS Methodology Working Paper Series, no.3
OECD (2001a) 'Measuring Capital', OECD Manual
OECD (2001b) 'Measuring Productivity', OECD Manual
ONS (2007) ‘The ONS Productivity Handbook: A Statistical Overview and Guide’
Oulton, N and Wallis G (2015) ’Integrated Estimates of Capital Stocks and Services for the United Kingdom: 1950-2013’, Centre for Economic Performance, Discussion Paper no. 1342
Back to table of contentsContact details for this Article
Related publications
- Labour productivity, UK: October to December 2019
- Productivity flash estimate and overview, UK: January to March 2026 and October to December 2025
- Subregional productivity in the UK: June 2023
- Regional firm-level productivity analysis for the non-financial business economy: Jan 2017
- Management practices and productivity in British production and services industries - initial results from the Management and Expectations Survey: 2016
- Public service productivity: quarterly, UK, October to December 2019
- Public service productivity, healthcare, England: financial year ending 2022
- Public service productivity, healthcare, England: financial year ending 2022