1. Main points
- These estimates are experimental using a degree of estimation to deliver more timely estimates, compared with our annual public service productivity figures, which are published with a 2-year lag; the methodology used in these estimates is explained in New nowcasting methods for more timely quarterly estimates of UK total public service productivity.
- In Quarter 4 (Oct to Dec) 2016, productivity for total public services decreased by 0.1% relative to the previous quarter; this followed on from a 0.3% increase in Quarter 3 (July to Sept) 2016.
- Comparing with the same quarter in the previous year, Quarter 4 2016 saw an increase in productivity of 0.4%.
- In 2016, year-on-year productivity for total public services has increased by 0.4%, as year-on-year output growth of 0.8% exceeded input growth of 0.4%, leading to an increase in the ratio of output to inputs.
- Revised estimates for productivity growth in 2015 show a year-on-year increase of 0.3%.
2. Things you need to know about this release
Productivity of public services is estimated by comparing growth in total output with growth in total inputs used. Productivity will increase when more output is being produced for each unit of input. Estimates of output, inputs and productivity are given both as growth rates between consecutive periods and as indices that show the cumulative trend over time.
Estimated growth rates of output and inputs for individual public services are aggregated by their relative share of total expenditure on public services (expenditure weight) to produce estimates of total public service output, inputs and productivity.
Inputs are composed of expenditure on labour, goods and services, and of consumption of fixed capital. They are adjusted for inflation using a suitable price index (deflator). Expenditure data used to estimate inputs growth are taken from the Quarterly National Accounts (QNA). Alternatively a volume measure is used where available, such as full-time equivalent for labour input.
The QNA also provides estimates of government output based on direct measures where they are available and indirect measures where they are not. Direct measures use the number of activities performed and services delivered, which are weighted together using the relative cost of delivery. Indirect measures of services assume that the volume of output is equal to the volume of inputs used to create them. This means productivity growth will always be zero where indirect measures are used.
This release presents experimental estimates for quarterly total public service productivity, inputs and output to provide a short-term, timely indicator of the future path for the annual estimates of total public service productivity, which are produced with a 2-year lag.
Trends in quarterly total public service output, inputs and productivity estimates are mostly determined by those service areas where quarterly data are readily available, for example, healthcare. A large proportion of activity data used to estimate the volume of output are annual data. This has subsequently been converted to a quarterly series – split evenly among the 4 quarters – reducing the impact these components have on volatility.
Annual estimates for 2015 and 2016 are taken from annualised quarterly data and are comparable to the existing annual series over the period 1997 to 2014. Differences between the annual and quarterly experimental public service productivity estimates are a result of differences in the estimates of output and inputs. Further information on these differences can be found in New nowcasting methods for more timely quarterly estimates of UK total public service productivity.
Back to table of contents3. Public service productivity continues to increase in 2015 and 2016
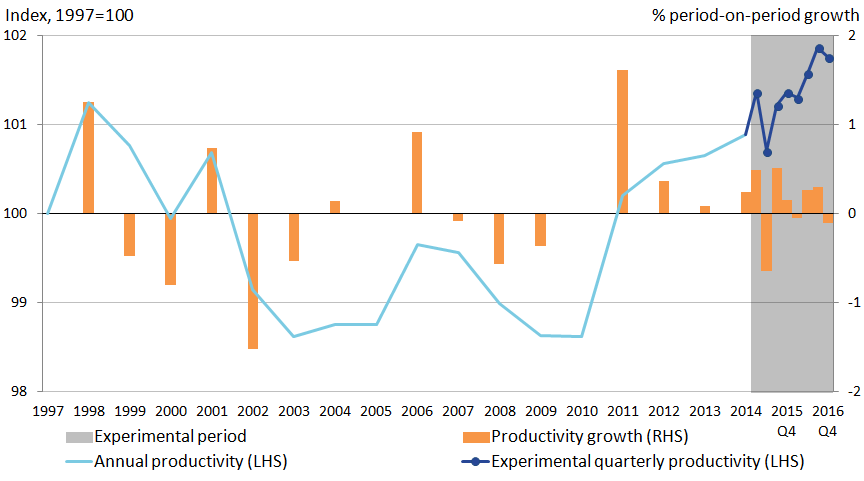
Figure 1 shows the total public service productivity series, with growth up to 2014 taken from the existing annual series and growth rates after this taken from the quarterly experimental series.
In Quarter 4 (Oct to Dec) 2016, total public service productivity fell by 0.1% relative to the previous quarter. However, this follows on from increases in productivity of 0.3% in both of the 2 preceding quarters. As a result, annualised estimates of the experimental quarterly measure show productivity in 2016 increased by 0.4% year-on-year and follows on from annual growth of 0.3% in 2015.
This continues the general upwards trend in recent years of UK public service productivity, as shown in Figure 1. From 2010 to 2016, total public service productivity is estimated to have increased by 3.0%, or an annual average of 0.5% growth. This represents the longest period of growth in public service productivity since the start of the series in 1997.
Figure 1: Total UK public service productivity, 1997 to Quarter 4 (Oct to Dec) 2016
Source: Office for National Statistics
Notes:
- Estimates from 1997 to 2014 are based on the existing annual series.
- Estimates from Quarter 1 (Jan to Mar) 2015 to Quarter 4 (Oct to Dec) 2016 are based on the experimental quarterly total public service productivity series.
- Estimates for Quarter 1 2015 reflect the growth rate between Quarter 1 2015 and annualised quarterly productivity for 2014.
- Estimates of productivity for the experimental period are indirectly seasonally adjusted, calculated using seasonally adjusted inputs and seasonally adjusted output.
- LHS stands for left-hand side.
- RHS stands for right-hand side.
Download this image Figure 1: Total UK public service productivity, 1997 to Quarter 4 (Oct to Dec) 2016
.png (29.7 kB) .xlsx (11.8 kB)
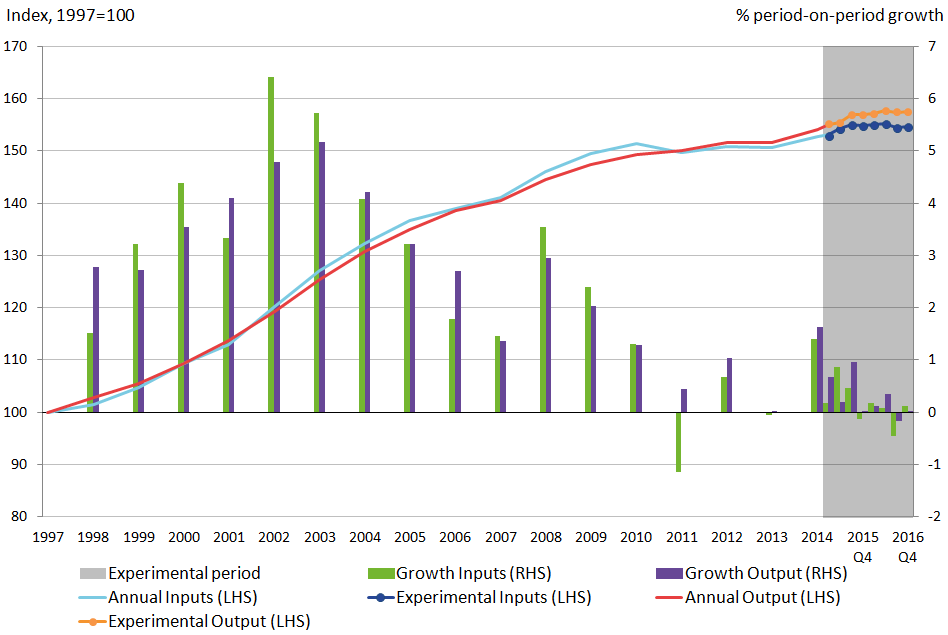
Figure 2 breaks down the productivity estimate into the underlying changes in inputs and output of total public services.
It shows that the latest fall in quarterly productivity was driven by a 0.1% increase in inputs with output remaining flat over the same period. This meant that there was a decrease in the ratio of output to inputs, leading to a decrease in productivity.
However, over 2016 as a whole, output growth of 0.8% exceeded inputs growth of 0.4%, leading to an increase in productivity of 0.4%. This is similarly the case in 2015, with output growth of 1.3% greater than input growth of 1.0%, leading to an increase in productivity of 0.3%.
Figure 2: Total UK public service inputs and output, 1997 to Quarter 4 (Oct to Dec) 2016
Source: Office for National Statistics
Notes:
- Estimates from 1997 to 2014 are based on the existing annual series.
- Estimates from Quarter 1 (Jan to Mar) 2015 to Quarter 4 (Oct to Dec) 2016 are based on the experimental quarterly total public service productivity series.
- Estimates for Quarter 1 2015 reflect the growth rate between Quarter 1 2015 and annualised quarterly productivity for 2014.
- Estimates of inputs and output for the experimental period are directly seasonally adjusted.
- LHS stands for left-hand side.
- RHS stands for right-hand side.
Download this image Figure 2: Total UK public service inputs and output, 1997 to Quarter 4 (Oct to Dec) 2016
.png (40.0 kB) .xlsx (12.8 kB)
Further information on data sources for quarterly total public service productivity can be found in the Quality and Methodology Information report and in New nowcasting methods for more timely quarterly estimates of UK total public service productivity. These articles highlight methods and caveats for producing the quarter-on-quarter growth estimates and they should be referenced when reporting on specific quarterly movements. This is especially the case for the latest quarters, which are more liable to be subject to revisions.
Back to table of contents4. What’s changed in this release?
All estimates, by definition, are subject to statistical “error”, but in this context the word refers to the uncertainty inherent in any process or calculation that uses sampling, estimation or modelling. Most revisions reflect either the adoption of new statistical techniques, or the incorporation of new information, which allows the statistical error of previous estimates to be reduced. Public service productivity estimates operate an open revisions policy. This means that new data or methods can be incorporated at any time and will be implemented for the entire time series.
Compared with the previous edition published on 6 January 2017, a number of revisions have been incorporated to the quarterly experimental series, including:
- revisions within the Quarterly National Accounts (QNA) back to Quarter 1 (Jan to Mar) 2015
- use of alternative price indices to deflate intermediate consumption
- the use of direct quarterly measures of labour input
- changes to the way we aggregate services together for inputs
- changes in the method of seasonal adjustment for output
To break this down further Figure 3 shows the effect of these changes on the average quarter-on-quarter growth rate of inputs, output and productivity from Quarter 1 (Jan to Mar) 2015 to Quarter 3 (July to Sept) 2016. The biggest change is a decrease in the estimates for average input growth for the period, revised downwards from an average 0.27% to 0.16%. As a result of this slower input growth, average productivity growth has increased for the period, revised up from 0.01% to 0.08%. Average output growth was revised down slightly from 0.28% to 0.24%, largely as a consequence of revisions in the QNA for 2016, offsetting some of the decrease in input growth. More detailed quarterly information on these revisions can be found in the dataset of this release.
Figure 3: Current and previous average quarter-on-quarter growth for inputs, output and productivity, Quarter 1 (Jan to Mar) 2015 to Quarter 3 (July to Sept) 2016
Source: Office for National Statistics
Notes:
- All estimates are based on experimental quarterly total public service productivity.
- Estimates of productivity are indirectly seasonally adjusted, calculated using seasonally adjusted inputs and seasonally adjusted outputs.
Download this chart Figure 3: Current and previous average quarter-on-quarter growth for inputs, output and productivity, Quarter 1 (Jan to Mar) 2015 to Quarter 3 (July to Sept) 2016
Image .csv .xlsAs a result, productivity in 2015 increased by 0.3%, this is revised upwards from the previous estimate of a decrease of 0.3%. This was as a result of decreased estimates for inputs, with inputs growth in 2015 revised downwards from 1.7% to 1.0%, with annualised output growth for 2015 unchanged.
The purpose of these changes is to better reflect the methods used in the existing annual series and allows for greater comparability with the short-term, quarterly estimates.
Changes to the input and productivity series are partly as a result of changes to the way we aggregate services together for inputs. We now aggregate services on an annual basis and then benchmark the quarterly experimental series to the annual estimates for the same period. This also changes the annual experimental estimates for inputs, which were previously taken as annualised estimates of the quarterly series. This ensures the methods used to calculate the experimental measure are consistent with the annual series, and are comparable to the methods of aggregation used within the QNA to calculate output.
New estimates of the volume of labour input have been included in this edition. This is a direct measure using full-time equivalent measures from public sector employment for service areas where outputs are directly measured. This brings experimental measures of labour input closer to the annual series and the recommendations of the Atkinson Review.
We have also reviewed and changed the price indices used to deflate expenditure on goods and services. Previously the deflators used for the experimental estimate were based on weighted combinations of Producer Price Indices and Service Producer Price Indices. However, following a review of the deflators and weights we have made changes to bring the deflators used in line with the annual article. This utilises public service reported data to construct quarterly deflators for service areas where suitable estimates are available. For other service areas the Implied GDP deflator is used.
There are also revisions to the quarterly output series, as seasonal adjustment is now carried out at a more aggregated level, in line with the method for the input series. This changes the quarter-on-quarter growth rates for output but has no impact on annual growth rates. Finally there are changes to both the output and inputs series as a result of QNA revisions back to Quarter 1 (Jan to Mar) 2015.
Back to table of contents5. Future developments
This article presents updated experimental quarterly total public service productivity, inputs and output series, aiming to provide a more timely indicator of the likely trend in the existing annual series. These estimates are based on different sources from those used to estimate annual total public service productivity. The sources used here contain less detail and necessarily involve a greater degree of estimation than annual estimates produced later. As a result, they are not replacements for the annual estimates, and are merely intended to provide a more timely estimate for the more recent period. We aim to assess the impact of these differences and to address issues such as quality adjustment, direct measures, the treatment of annual data and service level breakdown in future work.
Feedback on the use of these estimates and suggestions for improvements will be essential for the future development of timely estimates for public service productivity. All feedback is welcome and can be sent to sam.turnock@ons.gov.uk.
Back to table of contents8. Quality and methodology
The Quarterly public service productivity estimates: Total public services Quality and Methodology Information document contains important information on:
- the strengths and limitations of the data and how it compares with related data
- users and uses of the data
- how the output was created
- the quality of the output including the accuracy of the data
Contact details for this Article
Related publications
- Productivity flash estimate and overview, UK: January to March 2026 and October to December 2025
- Labour productivity, UK: October to December 2019
- Exploring labour productivity in rural and urban areas in Great Britain: 2014
- International comparisons of UK productivity (ICP), final estimates: 2021
- Labour productivity measures from the Annual Business Survey: 2006 to 2015
- Multi-factor productivity estimates, UK: July to September 2019
- Introducing quarterly regional labour input metrics
- An initial assessment of regional management practices: 2015