1. Main points
First estimates for 2015 indicate that output per hour worked in the UK was 18 percentage points below the average for the rest of the G7 advanced economies; this gap is unchanged compared with last year.
In terms of the output per worker gap, UK productivity remained 19 percentage points below the average for the rest of the G7 in 2015.
Compared with the rest of the G7, the UK had average productivity growth in terms of output per hour and below average growth in terms of output per worker in 2015.
Output per hour was lower in all G7 countries in 2015 than would have been the case if pre-downturn trends had continued since 2007. The UK’s productivity gap of nearly 18 percentage points is the largest in the G7 and is double the average of 9 percentage points across the rest of the G7.
This edition forms part of our quarterly productivity bulletin which also includes an overarching commentary, summaries of recently published estimates, and new quarterly estimates of public service productivity.
Back to table of contents2. About this release
This bulletin contains annual estimates of labour productivity for the G7 developed countries (Canada, France, Germany, Italy, Japan, the UK and the USA) up to 2015. Labour productivity measures the amount of economic output that is produced by a unit of labour input, and is a key measure of economic performance.
Output is measured by gross domestic product (GDP). Labour input is measured in 2 ways – by total hours worked and by numbers of workers in employment. These 2 measures of labour input can yield different results, reflecting differences in working patterns across countries and compositional movements over time, such as a shift towards part-time working.
Comparability across countries is achieved by using estimates of GDP and labour inputs from a common source – the Statistics Directorate of the Organisation for Economic Co-operation and Development (OECD) – as far as possible. These were the best available data at the time of publication. We convert local-currency-based measures of GDP using Purchasing Power Parity (PPP) exchange rates, which attempt to equalise the cost of a representative basket of goods and services in countries with different national currencies. For data points where labour input is not available from the OECD Annual Labour Force Survey (ALFS) database, Eurostat (for European countries) and an alternative OECD employment series (for non-European countries) are used to project the missing data. We have published an article explaining the uses and limitations of PPPs (246.1 Kb Pdf).
The estimates in this release update those published on 18 February 2016. This release cycle reflects the publication and revision cycles of the component data series.
Get all the datasets for this publication in the data section of this publication.
Back to table of contents3. Interpreting these statistics
The labour productivity measures in this bulletin are presented in terms of current prices (Datasets 1 and 2 (149.5 Kb Excel sheet)) , suitable for cross-country comparison of levels of productivity for a single year, and constant prices (Datasets 3 and 4 (149.5 Kb Excel sheet)), which are suitable for analysis of productivity performance over a number of years.
Current price productivity estimates are indexed to UK=100 for each year and show each country’s productivity relative to that of the UK in that year. Since productivity is an important determinant of living standards, these estimates also provide an indication of living standards relative to the UK.
In interpreting these estimates users should bear in mind that Purchasing Power Parity (PPPs) provide only an approximate conversion from national currencies and may not fully reflect national differences in the composition of a representative basket of goods and services. Additionally, care should be taken in interpreting movements in current price productivity estimates over time. For example, an increase in UK productivity relative to another country could be due to UK productivity growing faster, or falling less, or due to changes in relative prices in the 2 countries, or some combination of these movements.
Constant price productivity estimates are indexed to a particular year. For each single country, these estimates are very similar to national labour productivity series (minor differences from national sources are described in the Background notes section of this bulletin). The index year is set at 2007 in order to focus on movements in labour productivity over the economic downturn.
Constant price productivity estimates show the evolution of productivity for each country and for the G7 (and G7 excluding the UK) aggregates, but should not be used to compare productivity across countries at a point in time. Productivity growth can be decomposed into growth of output minus the growth of labour input, and these components can move in different directions within and across countries. This should be borne in mind when interpreting the constant price productivity estimates in this release.
More information on methodology and interpretation is available in the Background notes section of this bulletin. Additionally, the Quality and Methodology Information paper (123.8 Kb Pdf) for this release provides information on the quality of the estimates in this release, as well as providing a summary of methods used in compiling the estimates.
Notes for interpreting these statistics
All data are also available in hard copy at the back of the PDF version of this statistical bulletin. Get all the datasets for this publication in the data section of this publication.
Back to table of contents4. Current price productivity
Current price productivity estimates allow for comparison of how much economic output, measured in common currency terms, is produced by each worker and hour worked across countries in a particular year, relative to the UK=100. Further information is available in datasets 1 and 2 (149.5 Kb Excel sheet).
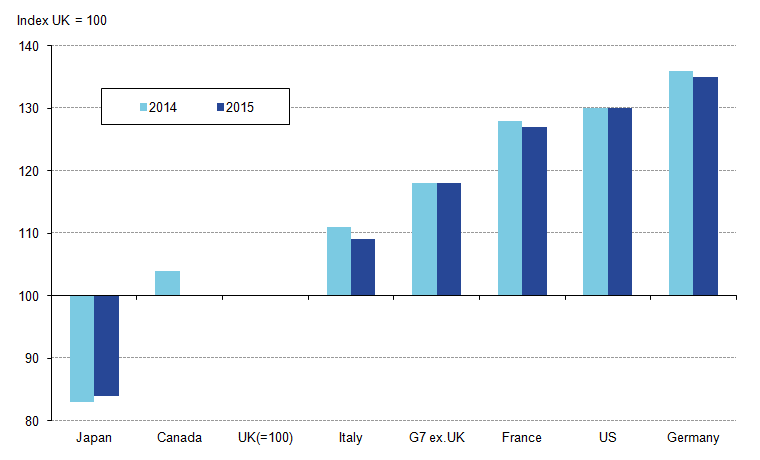
GDP per hour worked:
On this basis, UK productivity in 2015 was:
- above that of Japan by 16 percentage points
- equal to that of Canada
- lower than that of Italy by 9 percentage points
- lower than that of France by 27 percentage points
- lower than that of the USA by 30 percentage points
- lower than that of Germany by 35 percentage points
- lower than that of the rest of the G7 by 18 percentage points
Figure 1: GDP per hour worked, G7 countries, 2014 and 2015
Source: Organisation for Economic Co-operation and Development, Eurostat and Office for National Statistics calculations
Download this image Figure 1: GDP per hour worked, G7 countries, 2014 and 2015
.png (14.2 kB) .xls (25.1 kB)
Comparing 2015 with 2014, the UK productivity shortfall relative to Canada, Italy, France and Germany all narrowed slightly; however, the gap between the UK and the latter 2 remains substantial. In 2014, Canada had stronger productivity than the UK on a GDP per hour worked basis; however, in 2015 the UK was as productive as Canada. The UK’s relative catch up to Canada reflects the UK’s current price GDP growth, which outstripped growth in total hours between 2014 and 2015. Over the same period Canada experienced growth in total hours, but falling current price GDP. The UK remained more productive than Japan in 2015 although the gap between the 2 narrowed a little. The UK’s productivity deficit compared to the rest of the G7 remained at 18 percentage points.
GDP per worker:
First estimates for 2015 show that UK output per worker was:
- above that of Japan by 14 percentage points
- below that of Canada by 2 percentage points
- below that of Germany by 11 percentage points
- below that of Italy by 12 percentage points
- below that of France by 12 percentage points
- below that of the USA by 39 percentage points
- below that of the rest of the G7 by 19 percentage points
Figure 2: GDP per worker, G7 countries, 2014 and 2015

Source: Organisation for Economic Co-operation and Development, Eurostat and Office for National Statistics calculations
Download this image Figure 2: GDP per worker, G7 countries, 2014 and 2015
.png (12.5 kB) .xls (25.1 kB)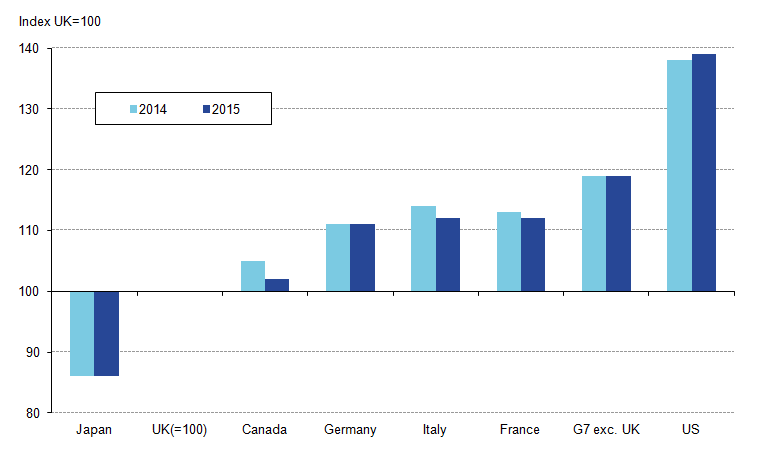
Comparing 2015 with 2014, the UK productivity shortfall compared with Canada, Italy and France narrowed. UK productivity relative to Japan and Germany remained unchanged. The gap between the UK and the USA widened. The shortfall between the UK and the rest of the G7 remained at 19 percentage points.
Different movements in average hours across countries account for differences in the patterns of productivity shown in Figures 1 and 2. For example, the productivity gap between the UK and the USA is wider in terms of output per worker than in terms of output per hour because, on average, USA workers work more hours than UK workers. On the other hand, the productivity differential between the UK and Germany and France is wider in terms of output per hour than in terms of output per worker, as German and French workers work fewer hours than their UK counterparts.
As illustrated in Figure 3, average weekly hours worked are not homogenous across the G7, reflecting cultural and compositional differences between economies. Canadian workers work more hours per week on average than the UK, which helps to explain why the UK was as productive as Canada in terms of GDP per hour but less productive in terms of GDP per worker in 2015.
Figure 3: Average weekly hours per worker, G7 countries, 1990 to 2015
Source: Organisation for Economic Co-operation and Development, Eurostat and Office for National Statistics calculations
Download this chart Figure 3: Average weekly hours per worker, G7 countries, 1990 to 2015
Image .csv .xlsThere has been a general trend across the G7 towards falling average weekly working hours over time. For example, in the UK, the proportion of full-time workers reporting weeks of between 36 and 40 hours has risen between 1995 and 2015, while the proportion working more than 50 hours has fallen. This shift is likely to reflect structural economic changes – including the growing importance of the services industries to employment – and worker preferences. More detailed analysis on changes in average weekly hours in the UK is available in the Economic Review: February 2016, and analysis comparing the UK and the USA can be found in the UK productivity introduction. Figure 3 suggests that this trend has ceased, with average weekly hours across the rest of the G7 now stable but at a lower level than before the recent economic downturn. However, the UK has experienced rising average weekly working hours between 2011 and 2014, now similar to pre-downturn levels.
Get all the datasets for this publication in the data section of this publication.
Back to table of contents5. Constant price productivity
Constant price productivity estimates are indexed to 2007=100 and show the evolution of labour productivity for each country and group of countries over time. Further information is available in datasets 3 and 4 (149.5 Kb Excel sheet). The following commentary focuses on GDP per hour worked, which, by allowing for movements in average hours worked, provides a more comprehensive measure of movements in productivity than GDP per worker.
GDP per hour worked:
Figure 4 shows GDP per hour worked for the UK and an aggregated series for the rest of the G7, together with simple projections based on average productivity growth from 1997 to 2007 (prior to the global economic downturn). On this basis, the combination of strong UK productivity growth up to 2007 and its weak productivity performance since 2007 implies a productivity gap of about 18 percentage points in 2015. That is, under a counterfactual scenario where UK productivity had continued to grow at its pre-downturn trend since 2007, output per hour in 2015 would have been around 18 percentage points higher than was actually the case.
Figure 4: Constant price GDP per hour worked, actual and projections, 1997 to 2015
Source: Organisation for Economic Co-operation and Development, Eurostat and Office for National Statistics calculations
Download this chart Figure 4: Constant price GDP per hour worked, actual and projections, 1997 to 2015
Image .csv .xlsThe UK’s average annual productivity growth between 1997 and 2007 was 0.3 percentage points higher than the average of the rest of the G7 advanced economies. Since 2007, productivity growth across the rest of the G7 has been stronger than the UK. This implies a narrower productivity gap for the rest of the G7 of around 9 percentage points in 2015.
The projections used in Figure 4 start from 2008. However, when reviewing the performance of the G7 excluding the UK, it can be argued that the slowdown in productivity growth began in 2005, preceding the economic downturn, rather than commencing as a result. Projecting from 2005 would result in a larger gap for the G7, excluding the UK, than that shown in Figure 4.
Figure 5 illustrates the difference in productivity trajectories over recent years between the main European economies and the North American economies. Output per hour fell in most G7 countries during the 2008 to 2009 downturn, before rebounding sharply in Canada and the USA. However, a slowdown in growth can be observed in several countries before this, with German growth slowing from 2004, while Italy has demonstrated no substantive growth since 2000. Comparing average productivity growth rates, the UK ranks second from bottom; only Italy has had a weaker productivity growth rate since 2007.
Figure 5: Constant price GDP per hour worked, G7 countries, 1997 to 2015
Source: Organisation for Economic Co-operation and Development, Eurostat and Office for National Statistics calculations
Download this chart Figure 5: Constant price GDP per hour worked, G7 countries, 1997 to 2015
Image .csv .xlsConverting the time series in Figure 5 into productivity gaps in 2015 relative to projections of pre-downturn trends (as in Figure 4) would yield gaps of around 14 percentage points for France, 9 percentage points for the USA, around 8 percentage points for Germany and Japan, 6 percentage points for Italy and 4 percentage points for Canada. The reason why the productivity gap for Italy is much narrower than that for the UK is that, despite a similarly weak rate of productivity growth since the economic downturn, the UK productivity trajectory prior to the downturn was much stronger than Italy's. As a consequence, its projection is much stronger than that of Italy.
Back to table of contents6. Revisions
Historical data used in this publication are subject to revision between publications. Datasets R1 and R2 (149.5 Kb Excel sheet) compare the latest estimates with estimates from the previous release on 18 February 2016. Note that because Tables 1 and 2 are indexed to UK=100, revisions to the UK are zero by definition in Tables R1 and R2.
The main source of revisions in this bulletin is changes to UK current price GDP, which has been adjusted upwards substantially since 1990. This is due to revisions resulting from Blue Book methodological improvements. The main change introduced in Blue Book 2016 came from a revised treatment of owner occupier’s imputed rental, outlined in the Economic Review: June 2016. This change affected growth in the current price measure of GDP and affects the years prior to 2011 to a greater extent than more recent years. As a result, these new data reduce the gap between the UK and other economies between 1991 and 2011. While the gap between the UK, France, Germany and the USA remains considerable throughout the time series, the gap between the UK and the rest of the G7 is considerably reduced in the mid-2000s. It should also be noted that while the revised methodology for imputed rental has been incorporated into the GDP estimates throughout the entire time period, PPP estimates are only consistent with this revised methodology from 2011 onwards. This aligns with common practice, and emphasises that PPP estimates can only be compared across countries in a single year (spatial comparisons). The impact of the change to the measurement of imputed rental on the chained volume measure of UK GDP was much smaller.
Other revisions are as follows:
- Germany and the US have had small upward revisions to GDP since 2012 and 2013 respectively
- Italy’s GDP has had small downwards adjustments since 2010, whereas France’s GDP has been adjusted downwards in 2013 and upwards in 2014
- Italy’s hours worked data has been revised downwards since 2013, and small adjustments have occurred for the same measure for the UK
- France’s employment data has been revised for 2014, due to changes in the Eurostat series used to project OECD total employment data
Get all the datasets for this publication in the data section of this publication.
Back to table of contents7. Quality and methodology
The UK Statistics Authority has designated these statistics as National Statistics, in accordance with the Statistics and Registration Service Act 2007 and signifying compliance with the Code of Practice for Official Statistics.
Designation can be broadly interpreted to mean that the statistics:
- meet identified user needs
- are well explained and readily accessible
- are produced according to sound methods
- are managed impartially and objectively in the public interest
Once statistics have been designated as National Statistics it is a statutory requirement that the Code of Practice shall continue to be observed.
A Quality and Methodology Information paper (123.8 Kb Pdf) for this release was published on 20 July 2012, describing the intended uses of the statistics presented in this publication, their quality, and the sources and methods used to produce them. The paper also provides information on the uses and limitations of international comparisons of productivity.
For this release, the base year for Purchasing Power Parity (PPPs) is 2011, which is the latest year for which the OECD PPP series have been benchmarked.
The output measure used here (GDP) differs from that used for our headline measure of productivity, gross value added (GVA). In the national accounts, GDP is valued at market prices and GVA is valued at basic prices. The principal difference is that basic prices exclude taxes and subsidies on products, such as VAT and excise duties. For further information on the relationship between GVA and GDP see Chapter 4 of the ONS Productivity Handbook.
GVA is the preferred measure of output for productivity purposes. However, as the OECD does not produce output level series using basic prices over the necessary time period, and PPPs are based on market prices, GDP is used in this bulletin. Differences between the growth rates of GVA and GDP are not normally significant.
Estimates of labour inputs (employment and hours worked) are taken from the OECD where available, supplemented in a small number of cases by other sources. Differences between OECD estimates and national sources reflect adjustments made by the OECD to achieve greater consistency between national estimates. There may also be timing differences as national sources are updated outside the OECD revision cycle.
Back to table of contentsContact details for this Statistical bulletin
Related publications
- Productivity flash estimate and overview, UK: January to March 2026 and October to December 2025
- Labour productivity, UK: October to December 2019
- Measuring output in the Information Communication and Telecommunications industries: 2016
- Management practices and productivity in British production and services industries - initial results from the Management and Expectations Survey: 2016
- Quality adjusted labour input: UK estimates to 2016
- Developing labour market metrics for the market sector, UK: 2016
- Public service productivity: quarterly, UK, October to December 2019