1. Main points
All regions have a mix of high and low productivity firms; however, the distribution of firms by productivity level varies by region as does the aggregate productivity level between regions.
There are 2 potential sources of differences in the level of aggregate productivity between regions and city regions: firstly, the mix of industries can affect relative productivity (because different industries have different average levels of productivity), secondly, a region can perform better if the firms within its individual industries out-perform their peers in other regions.
Our analysis of the non-financial business economy suggests that with an occasional exception (for example, Aberdeen, which has a large oil and gas production sector), a region’s industry structure appears to only play a relatively small role in productivity differences between regions. Instead, it is the differences between firm’s productivity within industries which has the most significant effect on aggregate regional productivity differences. For example, firms in London have higher median levels of productivity in most industry sectors when compared with other regions and it is these differences that are the larger factor in its higher overall labour productivity.
In considering these results, it should be noted that these data are based on nominal terms such that any local variation in price level has not been taken into account; additionally, the analysis does not include the finance or agriculture sectors and also excludes the public sector.
2. Introduction
Understanding the economic performance of different areas is important to developing policies aimed at economic growth and welfare improvement. The aggregate productivity data in our regional and subregional productivity article shows that there are significant differences in aggregate average labour productivity between different regions in the UK. These differences can reflect differences in both relative firm performance within industries (where firms in a given industry and region are more productive than firms in the same industry located elsewhere), or in the industries which are found in different locations (industry composition). This section aims to analyse the relative importance of these factors. To do that, we have performed analysis using local unit firm-level microdata in the Annual Business Survey (ABS) and the Business Register and Employment Survey (BRES).
The ABS is the key resource for understanding the detailed structure, conduct and performance of businesses across the UK at a regional level. However, note that it excludes the agricultural and financial sectors as well as some small firms1, the self-employed and the public sector. The estimates are based on aGVA from the Annual Business Survey (ABS) alongside employment data from the Business Register and Employment Survey (BRES) and are experimental.
Therefore, the following analysis explores the sources of differences in labour productivity between the NUTS1 (Nomenclature of Territorial Units for Statistics) regions and City regions in the non-financial business economy in Great Britain2. Labour productivity is expressed as gross value added (GVA) per worker3 in this article. Therefore the estimates in this section cannot be compared directly to the estimates in our regional and subregional productivity release4.
The article begins with examination of the distribution of firm-level productivities in the regions and city regions of Great Britain. It continues with a section examining differences in firm-level productivities in regions within industries. It then concludes with a decomposition analysis of labour productivity that casts light on the sources of firm productivity differences between the regions.
In considering the results, it is important to take into account that these data are based on nominal terms; that is local variation in price level has not been taken into account. As such local price effects could impact these results.
Notes for Introduction
- The Inter-Departmental Business Register (IDBR) does not include the very smallest of businesses, such as sole proprietors and one-person bands (those who self assess).
- Our BRES dataset for this analysis did not include employment estimates for Northern Ireland. As such, there are no Northern Ireland results included with this analysis.
- The labour productivity measure used in this article does not take into consideration different working patterns (for example, part-time working etc). A sensitivity analysis was carried out to compare the results in this section with those using full time equivalent (FTE) employment estimates with the conclusion that only minor differences to results occur. Therefore, we have chosen to use all worker dataset in the published calculations.
- A comparison between ABS and National Accounts can be found on our website.
3. Firm-level GVA per Worker distributions by Region and City Region
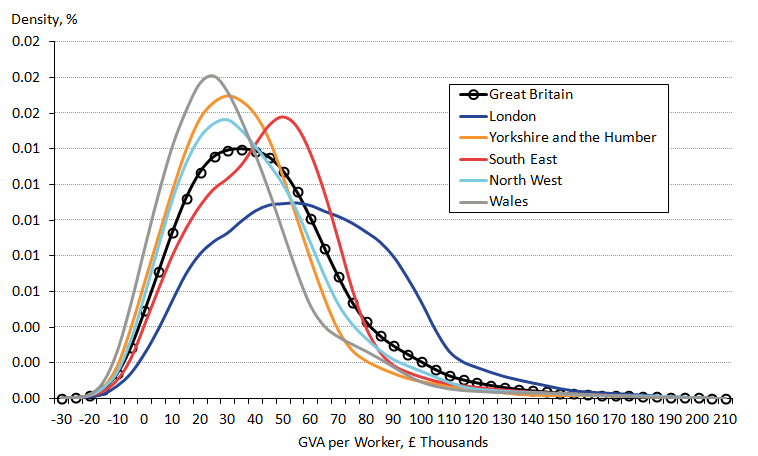
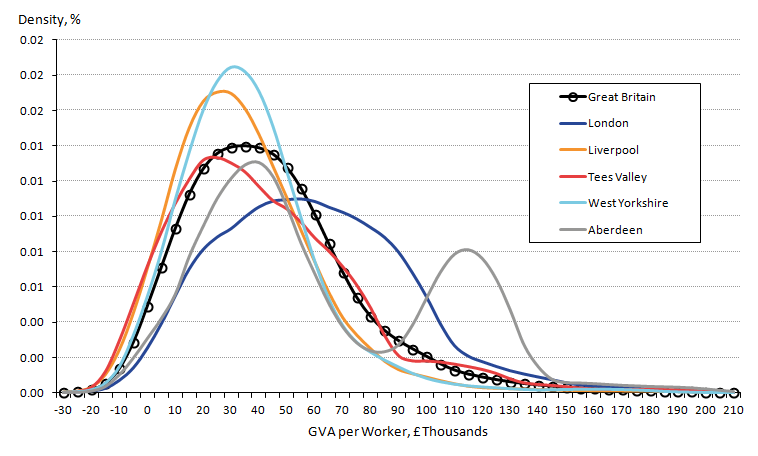
Figure 1 shows firm-level productivity data for the non-financial business economy for selected regions and countries and Figure 2 for city regions. They show the proportion of firms at different levels of gross value added (GVA) per worker. The distributions are skewed to the right, indicating that in all the regions there are fewer firms with high productivity levels than firms with lower productivity levels. Data and distributions for other areas are available in the accompanying dataset.
Figure 1: Distribution of firm level productivity (GVA per worker) in the non-financial business economy, NUTS1 regions, 2014
Source: Annual Business Survey (ABS) 2014, Business Register and Employment Survey (BRES), Inter Departmental Business Register (IDBR) – Office for National Statistics
Download this image Figure 1: Distribution of firm level productivity (GVA per worker) in the non-financial business economy, NUTS1 regions, 2014
.png (44.0 kB) .xls (34.3 kB)
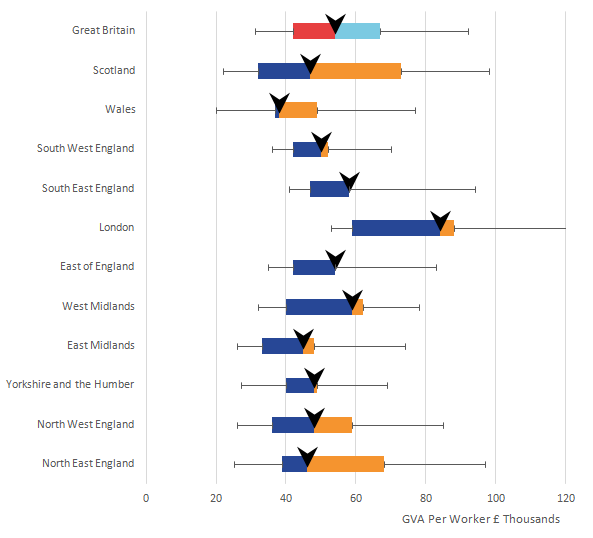
Figure 2: Distribution of firm level productivity (GVA per worker) in the non-financial business economy, City regions, 2014
Source: Annual Business Survey (ABS) 2014, Business Register and Employment Survey (BRES), Inter Departmental Business Register (IDBR) – Office for National Statistics
Download this image Figure 2: Distribution of firm level productivity (GVA per worker) in the non-financial business economy, City regions, 2014
.png (42.9 kB) .xls (34.3 kB)
The data shows that in 2014 in most regions and city regions in Great Britain had a large proportion of the firms with GVA per worker around £10,000 to £40,000. However, South East England and London have a larger proportion of firms with higher levels of GVA per worker (around £35,000 to 55,000) compared with the rest of the Great Britain countries, regions and city regions. This can be seen particularly in the very different shape of the distribution for London compared with other regions and countries in Figure 1. In Figure 2, Aberdeen city region also has an unusual distribution reflecting a significant number of firms with high GVA per worker as well as a share of firms with more typical productivity levels.
For Wales and regions in the North of England, the distribution of firm-level productivities is such that compared with the Great Britain average they have a slightly higher share of firms at lower productivities and a slightly lower share with higher productivities. This can be seen in Figures 1 and 2 and in the accompanying dataset.
Note that relatively high productivity firms (located in the right-hand tail of the distribution) can be found in almost every industry, however, some industries such as mining and production and professional, scientific and technical services, have a higher share of these firms.
Back to table of contents4. Firm-level productivity by Industry
Figure 3 shows firm level distributions within broad industry sections in selected industries comparing London and Yorkshire and The Humber regions. It shows the median level of gross value added (GVA) per worker (the arrow) and the inter-quartile range (the bars) and the 10th and 90th deciles (the lines). Users can explore data for other regions and countries in the accompanying dataset. It can be seen that median firm-level GVA per worker is higher in almost all industries in London compared with the firm-level GVA per worker in the Yorkshire and the Humber region. This illustrates the importance of firm-level productivity within industries in explaining the differences in aggregate labour productivity between the regions. London, in particular, has higher productivity firms in some of the service sectors such as professional, scientific and technical activities, real estate activities and information and communication.
Figure 3: GVA per Worker in broad industry groupings – London and Yorkshire & the Humber - 2014

Source: Annual Business Survey (ABS) 2014, Business Register and Employment Survey (BRES), Inter Departmental Business Register (IDBR) – Office for National Statistics
Download this image Figure 3: GVA per Worker in broad industry groupings – London and Yorkshire & the Humber - 2014
.png (33.8 kB) .xls (42.0 kB)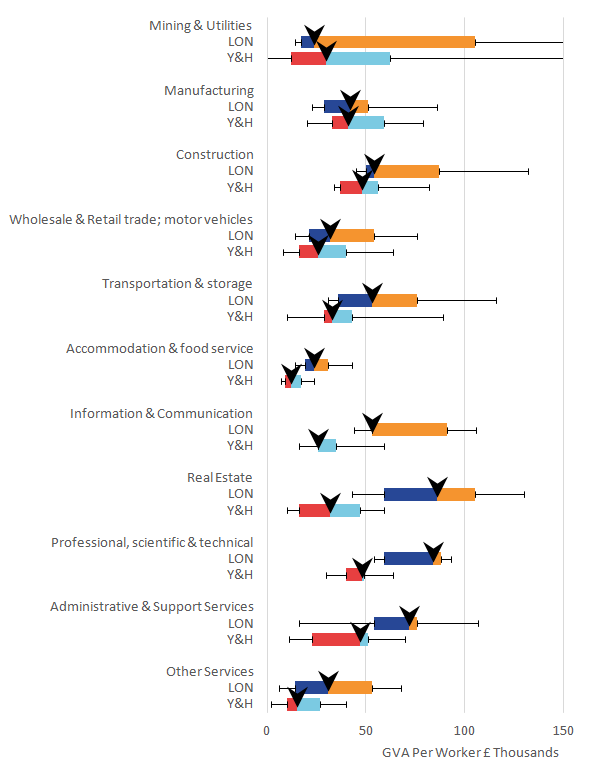
Figure 3 also shows the differences in the range of the firm-level GVA per worker within industries. The firm-level GVA per worker in the 2 regions shown has the widest spread in the production and utilities sector indicating that these industries consist of firms with both low and high productivity while accommodation and food services – a service sector with relatively low labour productivity – has the narrowest range among the industries. The spread of firm productivity within industries are also different between the regions with the spread of firm-level GVA per worker generally broader in most London industries than in Yorkshire and the Humber industries.
Another point to note is that not all industries have similar average productivity. While there are differences across regions, the general pattern is that median GVA per worker is generally lower in the accommodation and food service sector, other services sector and wholesale and retail trade sector than in most other sectors. The mining and utilities sector, by contrast, has relatively high productivity. The professional, scientific and technical activities sector and the information and communication sector also tend to have relatively high productivity, albeit this is not uniform across regions.
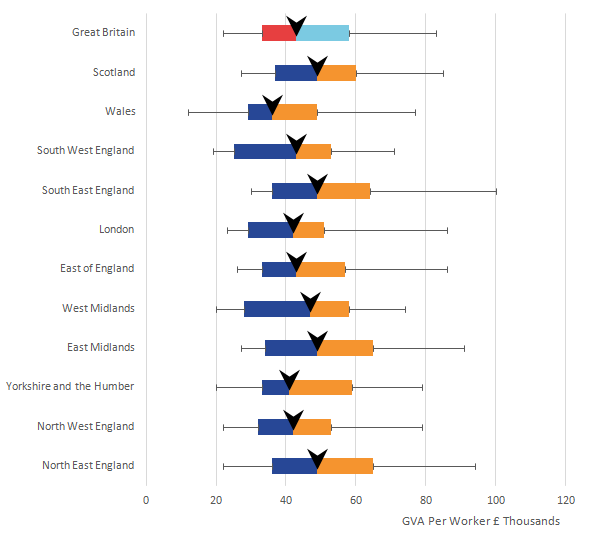
Figure 4 shows the distribution of GVA per worker in 3 selected industries in all the NUTS1 (Nomenclature of Territorial Units for Statistics) regions. It shows that for both the manufacturing and the wholesale and retail trade sectors the median firm productivity and the spread of the firm productivities are relatively similar in all the regions. In contrast the professional, scientific and technical activities sector is an example of an industry where the median and the range of firm productivities were notably different between regions. For example, London firms in this sector generally generated a higher GVA per worker than the rest of the firms in Great Britain in 2014, while in Scotland and North West England there were a wide spread of firms with different productivity levels in this sector.
Figure 4a: Distribution of GVA per Worker in Manufacturing – GVA per Worker 2014 – NUTS1 regions
Source: Annual Business Survey (ABS) 2014, Business Register and Employment Survey (BRES), Inter Departmental Business Register (IDBR) – Office for National Statistics
Download this image Figure 4a: Distribution of GVA per Worker in Manufacturing – GVA per Worker 2014 – NUTS1 regions
.png (19.5 kB) .xls (40.4 kB)
Figure 4b: Distribution of GVA per Worker in Wholesale and Retail trade; repair of motor vehicles and motorcycles – GVA per Worker 2014 – NUTS1 regions

Source: Annual Business Survey (ABS) 2014, Business Register and Employment Survey (BRES), Inter Departmental Business Register (IDBR) – Office for National Statistics
Download this image Figure 4b: Distribution of GVA per Worker in Wholesale and Retail trade; repair of motor vehicles and motorcycles – GVA per Worker 2014 – NUTS1 regions
.png (19.5 kB) .xls (35.8 kB)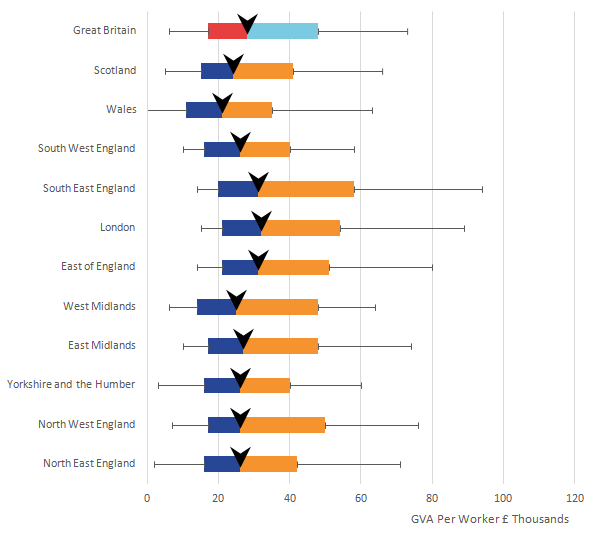
Figure 4c: Distribution of GVA per Worker in Professional, scientific and technical activities - GVA per Worker 2014– NUTS1 region
Source: Annual Business Survey (ABS) 2014, Business Register and Employment Survey (BRES), Inter Departmental Business Register (IDBR) – Office for National Statistics
Download this image Figure 4c: Distribution of GVA per Worker in Professional, scientific and technical activities - GVA per Worker 2014– NUTS1 region
.png (19.5 kB) .xls (44.0 kB)
5. Sources of variation in GVA per worker between NUTS1 regions and City regions
Differences in average labour productivity between regions can reflect differences in both firm characteristics in the areas and industry composition of an area. This section used a decomposition technique to investigate these sources of productivity and how they relate to differences in aggregate productivity between regions. The full technique is explained in the methodology section. In brief, the technique allows the decomposition of aggregate average labour productivity in each region into a number of indices of which the following 2 are particularly relevant:
- a Firm Productivity Index which shows the average level of productivity in a region assuming the industry composition in that region is the same as for the economy as a whole; this is designed to demonstrate the effect of the firm level productivities on the region's estimated average aggregate productivity
- an Industry composition1 index which shows the average level of productivity in a region assuming the productivity of each industry in that region equals nationwide average productivity for that industry; this is designed to demonstrate the effect of the industry composition on the region's estimated average aggregate productivity
Therefore, a higher value of the firm productivity index in a given region shows that productivity of the firms (hence industries in general) in that region are higher than firms in equivalent industries elsewhere. A higher value of industry composition index implies that the more productive industries in Great Britain have larger industry shares in that region.
For information, the residual covariance term provides a link between industry shares and industry productivity in an area. As an example, if an area has a high share of industry employment relative to Great Britain in the industries to which it has productivity advantages then it would likely have a large positive residual covariance. In reality, the residual covariance column is relatively small in most regions and city regions. Tables 1 and 2 show the firm productivity and industry composition indices for NUTS1 (Nomenclature of Territorial Units for Statistics) regions and City Regions. Each cell in the table has been divided by the aggregate productivity level for Great Britain in 2014 to provide results on a GB=100 basis.
Table 1: Sources of Aggregate Labour Productivity (GVA per worker) 2014 - NUTS1 Regions (GB=100)
| Region | Aggregate Average Labour Productivity | Firm Productivity Index | Industry Composition Index | Residual Covariance | Aggregate Average Labour Productivity, Great Britain |
| North East | 84 | 89 | 100 | -6 | 100 |
| North West | 91 | 96 | 97 | -2 | 100 |
| Yorkshire and The Humber | 75 | 77 | 98 | 1 | 100 |
| East Midlands | 82 | 83 | 100 | 0 | 100 |
| West Midlands | 86 | 84 | 104 | -1 | 100 |
| East of England | 89 | 93 | 97 | -1 | 100 |
| London | 154 | 154 | 102 | -2 | 100 |
| South East | 107 | 104 | 102 | 1 | 100 |
| South West | 78 | 82 | 95 | 2 | 100 |
| Wales | 72 | 72 | 96 | 4 | 100 |
| Scotland | 101 | 92 | 108 | 2 | 100 |
| Source: Annual Business Survey (ABS) 2014, Business Register and Employment Survey (BRES), Inter Departmental Business Register (IDBR) – Office for National Statistics | |||||
Download this table Table 1: Sources of Aggregate Labour Productivity (GVA per worker) 2014 - NUTS1 Regions (GB=100)
.xls (26.6 kB)Table 2: Sources of Aggregate Labour Productivity (GVA per worker) - City Regions (GB=100)
| City Region | Aggregate Average Labour Productivity | Firm Productivity Index | Industry Composition Index | Residual Covariance | Aggregate Average Labour Productivity, Great Britain |
| Bristol | 100 | 98 | 101 | 1 | 100 |
| Cardiff | 77 | 75 | 97 | 5 | 100 |
| Greater Manchester | 88 | 88 | 101 | -1 | 100 |
| Liverpool City Region | 87 | 92 | 95 | -1 | 100 |
| London | 154 | 154 | 102 | -2 | 100 |
| North East | 81 | 80 | 101 | 0 | 100 |
| Nottingham | 82 | 83 | 101 | -2 | 100 |
| Sheffield City Region | 69 | 70 | 96 | 2 | 100 |
| Tees Valley | 95 | 89 | 101 | 5 | 100 |
| West Midlands | 92 | 87 | 105 | 0 | 100 |
| West Yorkshire | 80 | 77 | 101 | 2 | 100 |
| Aberdeen | 216 | 137 | 182 | -2 | 100 |
| Edinburgh | 81 | 87 | 95 | -1 | 100 |
| Glasgow | 87 | 85 | 98 | 4 | 100 |
| Source: Annual Business Survey (ABS) 2014, Business Register and Employment Survey (BRES), Inter Departmental Business Register (IDBR) – Office for National Statistics | |||||
Download this table Table 2: Sources of Aggregate Labour Productivity (GVA per worker) - City Regions (GB=100)
.xls (27.1 kB)The indices show that the differences in aggregate labour productivity for the non-financial business economy (shown in the first column of the tables) in most regions appear to be more closely related to individual firm productivities than to the industry composition in the regions.
For example, in the Yorkshire and the Humber region the firm productivity index equals 77 (on a GB=100 basis). This is the productivity (23% below Great Britain average) that would exist if Yorkshire and Humber had a Great Britain industry structure whilst maintaining local average industry productivities. By contrast, the industry composition index for Yorkshire and The Humber is 98 (a 2% difference from Great Britain). This is the productivity that would exist if we kept the Yorkshire and The Humber industry structure, but applied average UK productivities within each industry.
Considering both these results we find that Yorkshire and The Humber’s relatively low aggregate average productivity is mostly due to low firm productivities within industries relative to Great Britain and only slightly impacted by local industry structure.
The case of Yorkshire and The Humber is typical of most UK regions and city regions in that the aggregate average productivity level is most closely related with the level of the Firm Productivity Index reflecting that differences in productivity across the regions are more closely related to different firm-level productivities within industries and less impacted by the local industry structure.
Table 2 shows Aberdeen city region to be the one clear exception to the above pattern. For Aberdeen, its industrial composition (focused around the oil sector) is shown to be the major source of its relatively strong overall labour productivity performance.
Notes for Sources of variation in GVA per worker between NUTS1 regions and City regions
- There are 2 widely accepted methods of defining industry composition. These are either using output such as shares of gross value added or inputs such as the shares of employment of each industry. The focus of this article is on labour productivity in industry. Defining the industry structure in terms of the inputs such as employment, therefore, appears to be more appropriate than using the output definition. Industry composition for each area is calculated as the employment share of 85 groups of 2-digit SIC industries in each area’s total employment.
6. Discussion
This article does not aim to provide a full analysis of all the drivers of firm productivity. Instead it has aimed to provide some information on the sources of spatial differences in labour productivity. Based on this analysis, however, it is possible to make a few observations on the factors behind the observed differences.
One key point is that labour productivity differs considerably between and within different industries and productivity differences within industries appears to play a more prominent role than the industry structure in explaining overall spatial differences in productivity in the non-financial business economy in Great Britain, in nominal terms.
For example, the data in this article has highlighted that London’s labour productivity advantage over other regions is not just about having more firms in certain industries. Rather it reflects that within certain industries (and particularly in the knowledge intensive service industries) London firms display a significantly higher level of labour productivity on average than firms in equivalent industries elsewhere in the country.
This question of why are firm-level productivities different within a particular industry between the regions is a vital one to consider. One explanation may be the variation in other factors affecting firm-level labour productivity such as production technology, capital intensity, infrastructure, investment, firm size, innovation, foreign ownership, managerial capability, competition between firms, extent of market power, characteristics of product and factor markets as well as consumer tastes and preferences.
A second explanation is that firm-level productivity may also be influenced by agglomeration effects. There is a body of evidence that clustering economic activity (agglomeration) makes a city or region more productive. For example, businesses have access to a larger pool of potential customers, suppliers and workers in the same city. Similarly, knowledge spillovers are likely to occur when many similar firms are located close to each other. This can either be because firms collaborate or because workers move from one company to another bringing their knowledge with them. However, some sectors benefit more than others from knowledge spillovers with knowledge-focused services businesses having the most to gain from a central location.
Another point to note is that even within a narrow industry sector (we have used 85 2-digit industry groupings for the industry composition index) the groupings could still cover a range of slightly different types of firms. More broadly, the results in this section are likely to reflect the fact that even within a particular industry sector, there can be differences in the types of outputs and the skills of workers involved that may explain productivity differences. For example, a multinational law firm in London may have different specialisation (hence different labour productivity levels) to a small local law firm elsewhere but both will have the same 2-digit industry grouping.
Finally, productivity indicators also depend on pricing. The productivity analysis in this article uses nominal GVA which does not by definition take account of any regional or local price difference1 or different factor prices faced by the firms. Therefore there is a possibility that if we were to control for regional price differences this may either strengthen or weaken these findings.
Further analysis on the sources and determinants of labour productivity differences between regions and city regions will follow in our subsequent productivity bulletins.
Notes for Discussion
- Local price effects may be particularly significant if the goods and services are not tradeable (that is, they are produced and consumed locally)
7. Methodology
The calculations in this section make use of a tailored micro-dataset constructed from Annual Business Survey (ABS)1. It includes all the local units2 of the firms and their plants registered in the Inter-Departmental Business Register (IDBR)3, the postcode of their location and the aGVA4 they have produced over a period of 12 months5. Employment data are not collected by the ABS, however, by using the unique identifier allocated to each plant the ABS dataset can be matched to a BRES dataset containing employment for Local Units.
ABS and BRES are 2 different surveys with different sample design, reporting periods, coverage and post-processing of the responses. Also, their sample frames are created from snapshots of the IDBR in different points in time, which means the business population may have changed in the meantime. Therefore, there is not a perfect match between the two surveys. BRES estimates employment for those LUs that have not been surveyed in a particular year. However, the methodology in this article uses employment from IDBR when there is no response from BRES.
This is because BRES is the preferred data source for employment microdata. It provides the most accurate and up-to-date employment information for businesses. However, employment data from IDBR is the second-best source if actual rather than estimated data is pursued.
Employment in IDBR is obtained from BRES if the business has been recently surveyed. For those not surveyed by BRES, but selected by the Short Term Employment Surveys (STES), the returns to these are used to update employment. For the rest of businesses, IDBR takes employment figures from HMRC administrative data on businesses registered for PAYE. As last resource, employment is imputed from VAT receipts, based on the turnover per head ratios6.
Once the employment variable has been selected, the LU postcode is used to match the Local Unit to NUTS1 regions or City Regions. City Regions geography in this section are built up from the Local Authority Districts7.
Using data from ABS has the disadvantage that the survey excludes the agricultural and financial sectors as well as some small firms, the self-employed and the public sector as such the ABS results represent approximately two thirds of the UK economy in terms of gross value added.
Calculation of the Productivity and Industry Composition Indices
This decomposition analysis technique is based on the original work of Olley and Pakes (1996)8.
Equation 1 shows the calculation of the indices which break down the aggregate productivity into two components.
Where
First term = Productivity Index which shows the average level of productivity in region r assuming the industry composition in that region is the same as for the economy as a whole;
Second term = Industry composition index which shows the average level of productivity in region r assuming the productivity of each industry in that region equals nationwide average productivity for that industry;
Term 3 = average labour productivity in Great Britain;
Term 4 = Residual Covariance between industry productivities and industry shares in region r. It shows the link between industry shares and productivity.
Notes for Methodology
- For more information on ABS Quality and Methods including a technical report visit the ONS archives.
- A firm or enterprise may have more than one plant in different locations. These are referred to as Local Units. Local Units of an enterprise may be engaged in different parts of the business such as production, accounting or head office therefore, each local unit is assigned a single SIC code, which corresponds to the unit’s principal activity.
- For an explanation of the IDBR visit our website.
- aGVA from ABS is known as approximate Gross Value Added (aGVA). ABS provides detailed information on the turnover and intermediate consumption of firms in the non-financial business economy and turnover minus intermediate consumption is called approximate value added. ABS is also the main source for GVA data in national accounts. However, several other data sources are added and some adjustments performed to obtain the final published regional and national accounts GVA numbers.
- ABS allows firms to report data for different 12-month periods. Most of them report for the calendar year. However, some firms report for the financial year and a few for other 12-month period.
- More information on the IDBR can be found on the ONS archive.
- In the previous section City Regions geography is built up using NUTS3 regions.
- Olley, G. S. and Pakes, A., 1996, The Dynamics of Productivity in the Telecommunications Equipment Industry, Econometrica, 64(6), 1263-1297.
Contact details for this Article
Related publications
- Labour productivity, UK: October to December 2019
- Productivity flash estimate and overview, UK: January to March 2026 and October to December 2025
- Volume index of UK capital services (experimental): estimates to Quarter 2 (Apr to Jun) 2017
- Regional and sub-regional productivity in the UK: Jan 2017
- Management practices and productivity in British production and services industries - initial results from the Management and Expectations Survey: 2016
- Public service productivity: quarterly, UK, October to December 2019
- Public service productivity, healthcare, England: financial year ending 2022
- Public service productivity, healthcare, England: financial year ending 2022