1. Abstract
This article contains updated estimates of output, inputs and productivity for public service healthcare in the UK between 1995 and 2013, and new estimates for 2014. Public service healthcare productivity is estimated by comparing the growth of service output with the growth of inputs used. Healthcare output is a measure of the quantity of healthcare delivered adjusted for the quality of delivery and is presented for separate healthcare sectors. Healthcare input is the quantity of labour, goods and services, and fixed capital consumption used in the provision of healthcare.
Back to table of contents2. Main points
The average annual growth rate of public service healthcare productivity in the UK from 1995 to 2014 was 0.9% per year.
In 2014, productivity grew by 2.3% relative to the previous year, due to output growth of 5.2% outstripping input growth of 2.8%.
This is the fifth consecutive year of positive public service healthcare productivity growth since 2009.
The quality adjustment added 0.5 percentage points to output growth in 2014, in line with the average rate for the series since 2001 when the quality adjustment was first applied.
Output growth of 5.2% in 2014 was higher than the average for the series of 4.7%, with hospital and community health services the largest driver behind this increase.
Input growth was 2.8% in 2014, up from 1.7% in 2013, but lower than the average growth rate since 1995 of 3.8%.
Figure 1a: Public service healthcare productivity index and growth rate, 1995 to 2014
Source: Office for National Statistics
Download this chart Figure 1a: Public service healthcare productivity index and growth rate, 1995 to 2014
Image .csv .xls3. Public service healthcare productivity overview
This article introduces the concepts of productivity, gives an overview of the trends in public service healthcare productivity in the UK between 1995 and 2014 and provides more detail on composition of the output and input measures used in calculating productivity1.
Public service healthcare productivity is estimated by comparing growth in the total quantity of healthcare output provided (adjusted for quality) with growth in the total quantity of inputs used. If the growth rate of output exceeds the growth rate of inputs, productivity increases, meaning that more output is being produced for each unit of input. Conversely, if the growth rate of inputs exceeds the growth rate of output, then productivity will fall, indicating that less output is being produced for each unit of input.
It is important to note that while these productivity estimates provide a measure of the amount of output which is produced for each unit of input, they do not measure value for money or the wider performance of public healthcare services. They do not indicate, for example, whether the inputs have been purchased at the lowest possible cost, or whether the desired outcomes are achieved through the output provided.
Healthcare output is the quantity of healthcare provided adjusted for the quality of delivery. The quantity output is measured as the number of individual healthcare activities performed and can also be described as volume output. The quality of delivery is measured using a combination of indicators including survival rates, waiting times, primary care outcomes and results from the National Patient Survey. Healthcare inputs are composed of labour (measured as full-time equivalent staff numbers), goods and services, and consumption of fixed capital. Further information on methods, including information about data used for the different component countries of the UK and how these are aggregated to a UK index, is available in our sources and methods paper2.
The estimates in this release are subject to an open revisions policy, meaning that each time a new article is published, revisions can occur for the whole of the time period. In addition to the incorporation of updated data for some sources, revisions have also been caused by the incorporation of data on agency staff in the goods and services inputs, and changes to the data source used for capital consumption. More information on revisions can be found in the revisions section.
Estimates are published on a calendar year basis to be consistent with the UK National Accounts, and form part of Public service productivity estimates: total public service, 2014.
Figure 1b: Public service healthcare output, inputs and productivity indices and growth rates, 1995 to 2014

Source: Office for National Statistics
Download this image Figure 1b: Public service healthcare output, inputs and productivity indices and growth rates, 1995 to 2014
.png (40.2 kB) .xls (29.2 kB)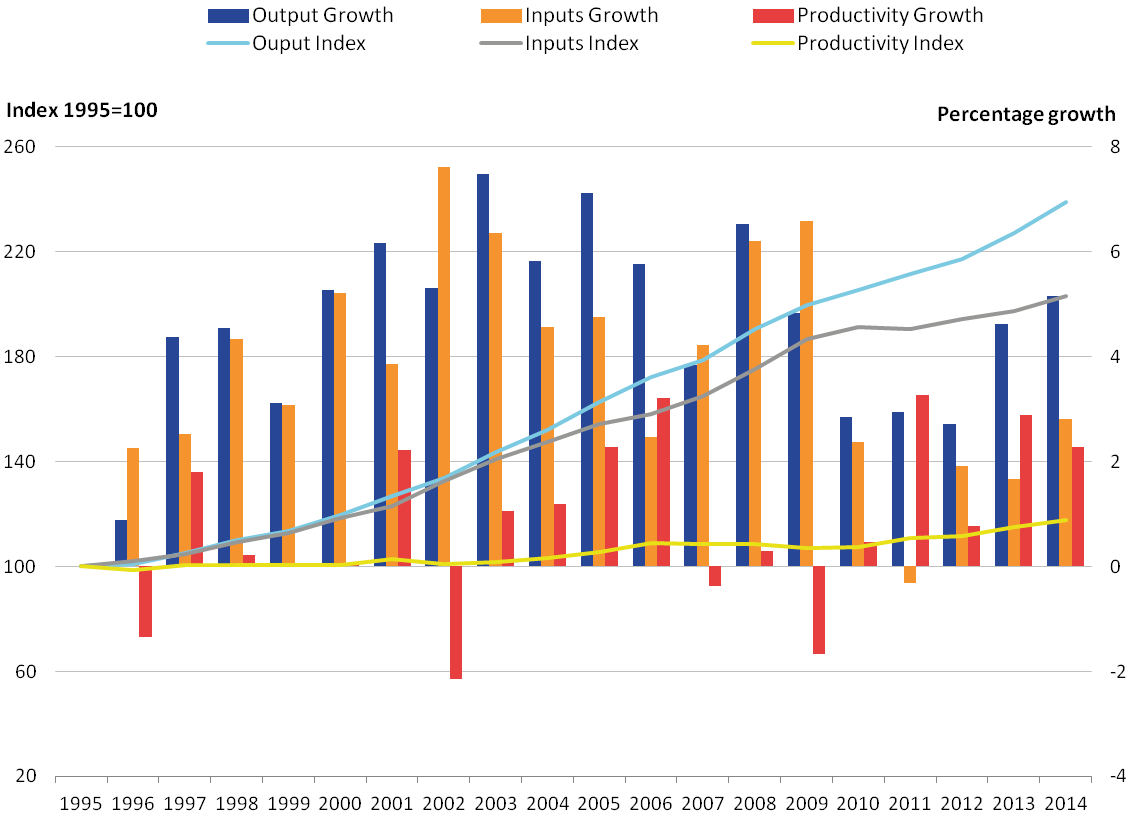
Figure 1b shows trends in public service healthcare output, inputs and productivity between 1995 and 2014. Annual growth rates for these 3 series are shown as bars (measured against the right axis) while the cumulative change in the 3 series since 1995 are shown by the lines (measured against the left axis and indexed to 100 in 1995).
Figure 1b shows that public service healthcare productivity rose by 2.3% in 20143, as a result of output growing at 5.2%, while inputs grew at a lower rate of 2.8%4. Productivity growth in 2014 was faster than the average for the whole series of 0.9%5.
Figure 1b also shows that the average growth rate of both inputs and output over the period 2009 to 2014 was lower than during the period 2000 to 2009. However, the fall in the growth rate of output during the period 2009 to 2014 was not as great as the fall in the growth rate of inputs, resulting in 5 consecutive years of rising productivity over this later period.
Notes for: Public service healthcare productivity overview
Productivity estimates included in this article are multi-factor productivity estimates as opposed to labour productivity estimates. This is because the inputs used include of goods and services and capital inputs, in addition to labour input. However, the public service productivity measures included in this article are not comparable with the ONS whole economy multi-factor productivity estimates due to differences in the definitions used. For more information on these differences see the article on Comparing public service productivity estimates with other productivity estimates.
ONS (2013a) - Sources and Methods Public Service Productivity Estimates: Healthcare.
Growth rates for each year given as the growth between the stated year and previous year. For example, the growth figure for 2014 is the growth measured between 2013 and 2014.
While productivity growth is calculated as the difference between output and input growth, productivity growth is calculated using unrounded data, and therefore the productivity growth figures in this article may differ from figures calculated using rounded output and input growth rates.
Average growth rates for cumulative growth across multiple years are geometric means.
4. Inputs
Inputs to publicly-funded healthcare are broken down into 3 components:
- labour – such as hospital consultants, registrars, nurses, technical staff, ambulance staff, support staff, General Medical Practitioners (GPs) and GP practice staff
- goods and services – such as non-staff costs of pharmaceutical services, dental and ophthalmic services , and the purchase of equipment by hospitals and GP practices including items such as gloves and syringes; this component also includes GP-prescribed drugs, services provided by non-NHS organisations and agency staff costs
- consumption of fixed capital – capital consumption covers the cost of depreciation of capital goods (items that are anticipated to be in use over several years and add to the stock of resources in the healthcare system, such as buildings and vehicles) over time
Estimates of labour inputs are based on direct measurement of the change in the number of full-time equivalent employees of the health service, weighted by their average salaries. Inputs for goods and services are estimated indirectly, using appropriate deflators for each sub-component, to remove the effects of price changes from current price expenditure. Capital consumption is measured using the perpetual inventory method, as used in the National Accounts.
In order to produce a measure for total inputs, the growth rates of the 3 input components are weighted by their share of total expenditure and then combined.
Figure 2a shows the inputs growth by component before it is weighted by expenditure share. Figure 2b presents this information after weighting, showing how growth in each component contributes to the growth in overall inputs. These charts show an increase in the growth rate of all 3 components of healthcare inputs in 2014, resulting in growth in total inputs of 2.8% in 2014, up from 1.7% in 2013.
Figure 2a: Public service healthcare inputs volume growth by component, 1996 to 2014
Source: Office for National Statistics
Notes:
- Capital growth was not included in figure 2a, due to its small expenditure weight, and therefore small impact on total inputs (see figure 2b).
Download this chart Figure 2a: Public service healthcare inputs volume growth by component, 1996 to 2014
Image .csv .xls
Figure 2b: Public service healthcare contributions to inputs growth by component, 1996 to 2014
Source: Office for National Statistics
Download this chart Figure 2b: Public service healthcare contributions to inputs growth by component, 1996 to 2014
Image .csv .xlsBetween 1995 and 2009, the growth rate of labour inputs averaged 2.7% per year. Since 2009, growth in labour inputs slowed considerably, averaging 0.6% between 2009 and 2014. The only fall in labour inputs was a fall of 1.0% in 2011, caused by absolute falls in the number of healthcare staff, especially amongst administrative, support and senior managerial categories. This resulted in the only fall in total public service healthcare inputs over the period. The average annual growth rate in labour inputs was 2.1% over the whole series, leaving labour inputs 49% higher in 2014 than in 1995.
Procurement of goods and services was the fastest growing of the 3 input components over the series, with an average growth rate of 6.4%. As with labour inputs, the growth rate of goods and services inputs fell after 2009 and averaged 3.0% between 2009 and 2014.
In terms of expenditure shares, the faster growth rate of goods and services inputs compared with labour inputs has led to a change in the balance of the composition of inputs. The expenditure share of goods and services rose from 35% at the start of the period to 50% at the end, overtaking labour’s expenditure share, which fell from 61% to 48% over the same time1. Procurement of goods and services provided the largest contribution to total inputs growth in every year between 1995 and 2014, with the exception of 2004.
In addition to labour, and goods and services, there is a third element to inputs – consumption of fixed capital. The expenditure share of capital consumption is much smaller than the other 2 components and has fallen over the series from 3.8% to 2.1%. This small expenditure share limits the effect of changes in capital consumption on total inputs, and so growth in capital consumption is not included in Figure 2a, although the contribution of capital consumption to total inputs growth is included in Figure 2b. Capital consumption grew by 1.6% in 2014, faster than its average growth rate of 0.6% over the period 1995 to 2014.
Total inputs
Public service healthcare inputs grew in every year of the series, with the exception of 2011, which had a fall of 0.3%. The annual average growth rate of inputs from 1995 to 2014 was 3.8%. However, there was lower growth in inputs after 2009, with an annual average growth rate over the period 2009 to 2014 of 1.7%.
The pattern of much slower inputs’ volume growth from 2010 onwards coincides with the Nicholson efficiency challenge2 and the QIPP programme (Quality, Innovation, Productivity and Prevention) targeting efficiency savings within the English NHS.
Notes for: Inputs
The measure of total inputs is aggregated from its sub-components using a Laspeyres index. To calculate a Laspeyres index, expenditure shares from the previous year are used and are therefore reported here. For more information, see Robjohns (2006).
5. Output quantity
Healthcare output is measured as the quantity of healthcare delivered adjusted for changes in the quality of delivery. The quantity measure of output is estimated using a cost-weighted activity index and can alternatively be described as volume output. To produce this measure, the growth rates for thousands of individual healthcare activities are calculated and then weighted by their proportion of total expenditure. As a result, growth in high-volume and expensive treatments have a greater impact on the outputs index than a similar rate of growth in uncommon and low-cost treatments.
The quantity of healthcare is estimated separately for each of the following sectors, which are weighted together to produce an overall quantity output series:
- Hospital and Community Health Services (HCHS) – includes hospital inpatient, outpatient and day case episodes
- Family Health Services (FHS) – includes General Practitioner (GP) and practice nurse consultations, publicly funded dental treatment and sight tests
- GP prescribing – includes all drugs prescribed by General Practitioners
- non-NHS provision1 – includes services funded by the government but provided by the private or third sector
Figure 3a shows the quantity output growth by component before it is weighted by expenditure share. Figure 3b presents this information after weighting each of the 4 components together to show how much growth in each component contributes to the growth in overall output quantity.
Figure 3a: Public service healthcare quantity output volume growth by component, 1996 to 2014
Source: Office for National Statistics
Notes:
- HCHS = Hospital and Community Health Services.
- FHS = Family Health Services.
Download this chart Figure 3a: Public service healthcare quantity output volume growth by component, 1996 to 2014
Image .csv .xls
Figure 3b: Public service healthcare contributions to quantity output growth by component, 1996 to 2014
Source: Office for National Statistics
Notes:
- HCHS = Hospital and Community Health Services.
- FHS = Family Health Services.
- Sum of components of quantity output growth may not equal total quantity output growth due to the method for splining data from financial to calendar year.
Download this chart Figure 3b: Public service healthcare contributions to quantity output growth by component, 1996 to 2014
Image .csv .xlsFigure 3a shows that the quantity output from Hospital and Community Health Services (HCHS) has grown in every year of the measured time series, averaging a growth rate of 3.4% per year. The growth rate of HCHS output was higher than this average between 2012 and 2014, following a period of lower-than-average growth rates between 2009 and 2012.
HCHS has the largest expenditure share, accounting for 64% of healthcare expenditure. Its large share means that growth in the HCHS sector was the dominant contributor to overall healthcare output growth in 2014, contributing approximately two-thirds of total output growth.
Family Health Services (FHS) is the second largest component of quantity output by expenditure share, at 16% of healthcare expenditure. Growth in the output of FHS has generally been lower than the other components of healthcare outputs over the period, with an average growth rate of 1.9% between 1995 and 2014. FHS output grew by 2.0% in 2014.
The remaining components of healthcare outputs, GP-prescribing and non-NHS activities, each have expenditure shares of approximately 10%.
There was a steady downward trend in the growth rates of GP-prescribed drug activities over the series, from a maximum of 14.2% in 2000 to 3.2% in 2011, after which it has levelled out. Growth remained at a similar level of 4.2% in 2014. The fall is partly due to the number of items prescribed growing at a slower rate than before and also expenditure falling as a result of reduced prices for drugs2 through negotiating discounts and increased use of generic (non-branded equivalent) drugs3.
The expenditure share of GP-prescribed drug activities has declined since 2000, which combined with lower growth rates has reduced the contribution of GP prescribing to overall output growth from 2.8 percentage points in 2000 to 0.1 percentage points in 2014.
Whilst growth in non-NHS provision was historically quite volatile, it has stabilised in recent years following a rapid decrease in growth rates from 21.8% in 2007 to 7.4% in 2010, although growth in non-NHS output rose to 9.7% in 2014. Despite its share of total expenditure more than doubling over the period to more than 10% in 2014, the impact of non-NHS provision on the high growth rates on total public service healthcare output was limited to no more than 2 percentage points during any year in the series.
Total output quantity
Public service healthcare output grew in all years across the series. As with inputs, growth rates for quantity output between 2000 and 2009 were higher than those between 2009 and 2014, averaging 5.3% and 3.3% per year respectively. However, the reduction in growth between 2009 and 2014 was less severe for output than inputs, resulting in stronger productivity growth during this later period.
Growth in the quantity of healthcare provided should be seen in the context of an ageing population and its implications for healthcare demand. While the total UK population grew at an annual average of 0.6% over the period 1995 to 2014, the population aged over 75 grew at 1.3%. However, research by bodies such as the Organisation for Economic Co-operation and Development suggests that demographic effects, such as a larger population and increasing number of people aged over 75, have a relatively small impact on healthcare expenditure and output growth. Factors such as medical advance, healthcare institutions and public expectations are viewed as more significant factors in explaining increases in healthcare expenditure over time4.
Notes for: Output quantity
Non-NHS provision is measured indirectly using expenditure, and uses the inputs=output convention, meaning implicit productivity for the non-NHS component is zero.
Nuffield Trust (2014) - Cost of Prescription Items in the UK.
The current methodology means that cost-efficiency gains from prescribing generic drugs instead of branded drugs are not captured in these statistics. We intend to investigate these issues in future, to determine if an alternative methodology could be adopted, which would adjust for the movement towards prescribing generic drugs.
OECD (2013) - Public spending on health and long-term care: a new set of projections.
6. Output quality
In line with the recommendations of the Atkinson Review1 a quality adjustment is applied to the estimate of healthcare quantity output2. The adjustment reflects 2 dimensions of quality:
- the extent to which the service succeeds in delivering its intended outcomes: a. for HCHS services, this is measured using short-term survival rates3, health gain following treatment in hospital and changes in waiting times b. for primary care, this is measured as the percentage of certain groups of patients meeting target ranges for cholesterol levels and blood pressure
- the extent to which the service is responsive to users’ needs: National Patient Survey results are used to measure patient experience of hospital inpatient services, mental health services, primary care, outpatient, and accident and emergency services
Figure 4 shows growth in the quantity and quality measures of healthcare output.
Figure 4: Public service healthcare quantity and quality adjusted output indices and growth rates, 1995 to 2014

Source: Office for National Statistics
Notes:
- QA = Quality adjusted.
- No quality adjustment is currently applied to non-NHS services.
Download this image Figure 4: Public service healthcare quantity and quality adjusted output indices and growth rates, 1995 to 2014
.png (33.2 kB) .xls (28.7 kB)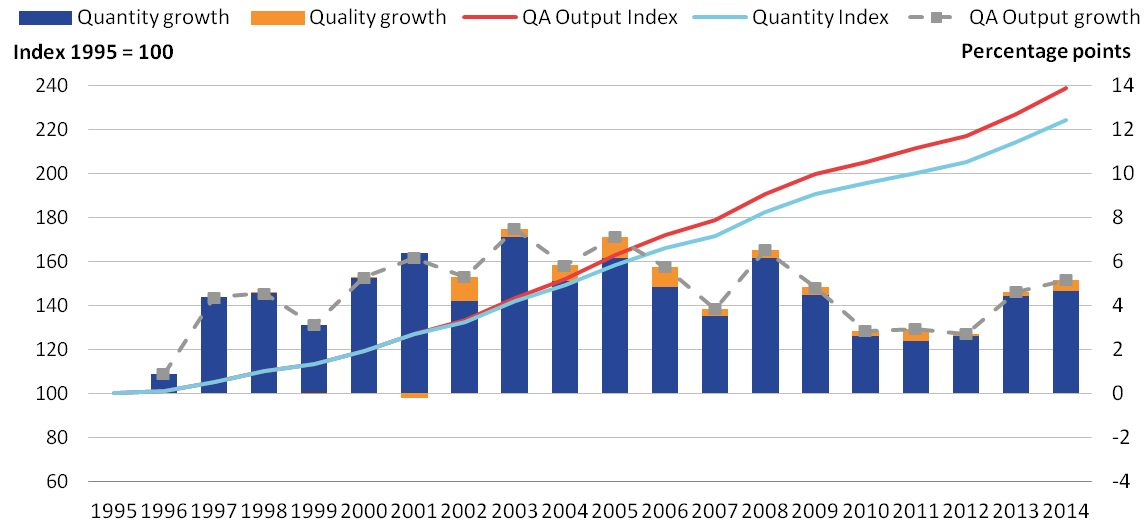
The impact of the quality adjustment was positive in all years, with the exception of a small negative impact in 2001, the first year it was applied. In 2014, the quality adjustment added 0.5 percentage points to the output growth rate, which was the highest quality adjustment growth since 2011. The average effect of quality adjustment on output growth from 2000 to 2014 was 0.4%.
Effect of quality adjustment on productivity
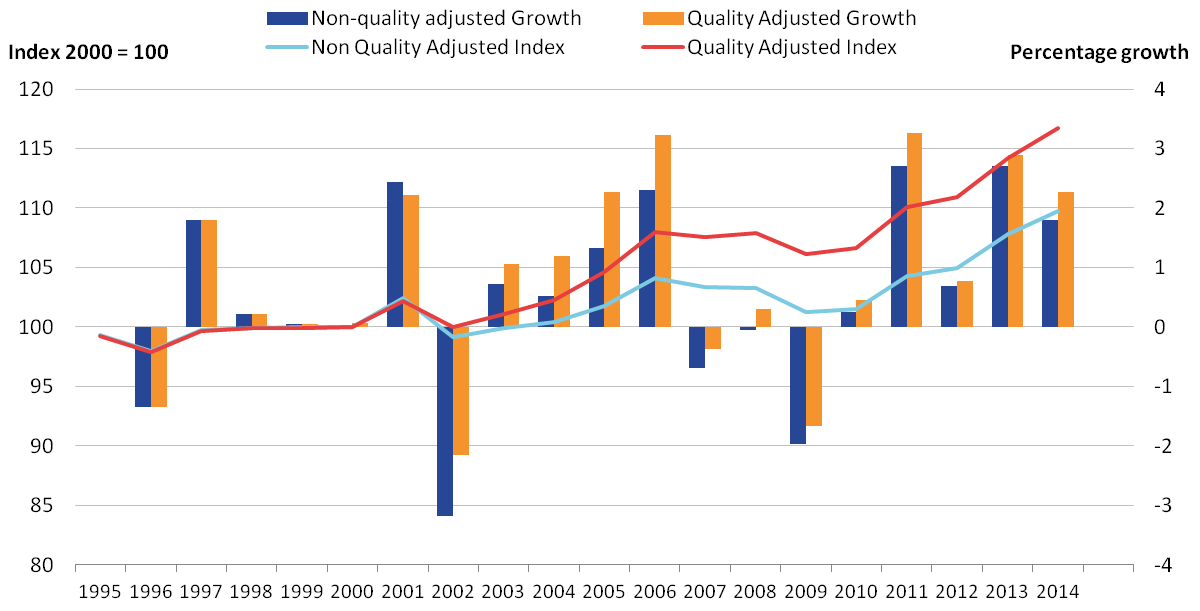
Figure 5 shows the growth of healthcare productivity with and without the quality adjustment applied, with total growth indexed to 2000, the year before the quality adjustment was introduced. This shows that the quality adjustment has had a positive effect on productivity over the series and accounted for over 40% of the overall increase in healthcare productivity between 2000 and 2014. The gap between quality adjusted and non-quality adjusted productivity has widened steadily over the period. This has occurred as, while the effect of quality adjustment on annual output growth has been small, the quality adjustment has been positive in every year except 2001.
Quality adjusted and non-quality adjusted productivity both recorded a fifth consecutive year of growth in 2014, with rates of 2.3% and 1.8% respectively. This compares with average quality-adjusted productivity growth of 1.1% and average non-quality adjusted productivity growth of 0.7% over the period 2000 to 2014.
Figure 5: Public service healthcare quantity and quality adjusted productivity indices and growth rates, 1995 to 2014
Source: Office for National Statistics
Download this image Figure 5: Public service healthcare quantity and quality adjusted productivity indices and growth rates, 1995 to 2014
.png (31.7 kB) .xls (27.6 kB)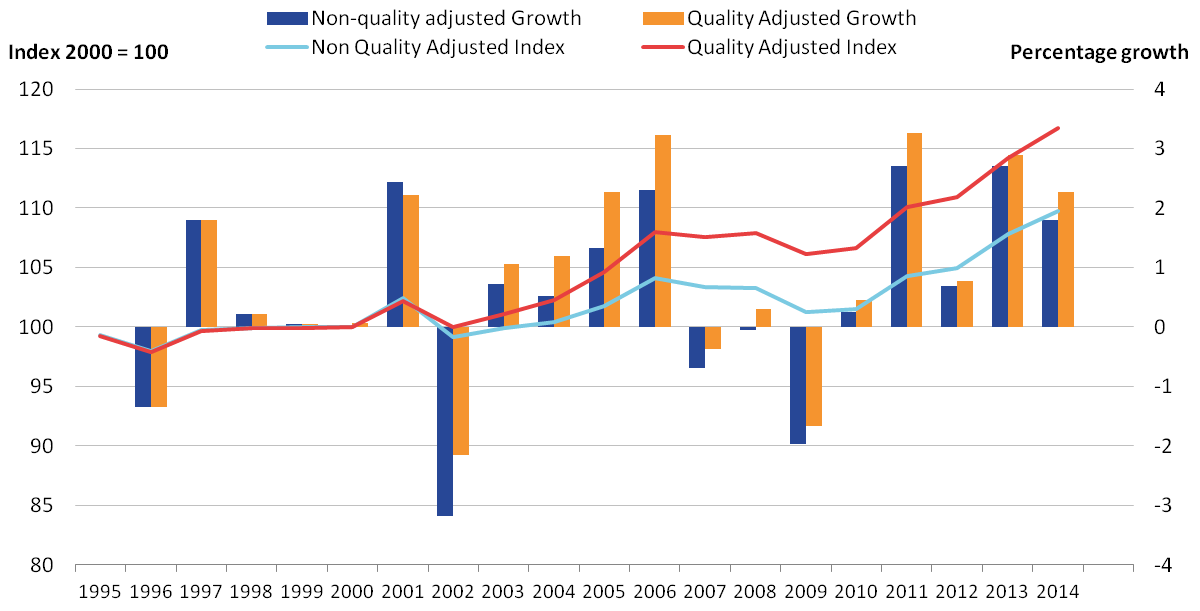
Notes for: Output quality
- Atkinson, T (2005) - Atkinson Review: Final Report. Measurement of Government Output and Productivity for the National Accounts, Palgrave MacMillan: UK.
- No quality adjustment is currently applied to non-NHS services.
- The quality adjustment for short-term survival rates in previous healthcare productivity releases was measured by the year-on-year change in 30-day post-operative mortality. However, this data was not available for the latest release, and so the short-term survival rate adjustment for 2014 is measured as the change in in-hospital mortality between 2013 and 2014.
7. Revisions
In constructing the productivity index, revisions to data sources have caused revisions to the estimates of productivity growth previously published in Public Service Productivity Estimates: Healthcare, 2013 for the years 1995 to 2013. Figure 6a shows the change in the productivity measure between this publication and the previous publication. Figure 6b shows the growth rates and index for productivity from this publication and the previous publication.
The revisions are a result of small methodological changes, as well as revisions to update the source data. This release incorporates data on agency staff in the goods and services inputs throughout the 1995 to 2014 time series, resulting in a revision to inputs. There has also been a change to the data source for consumption of fixed capital1, as a result of developments undertaken in the national accounts.
Figure 6a: Revisions to public service healthcare productivity growth rates, 1996 to 2013
Source: Office for National Statistics
Download this chart Figure 6a: Revisions to public service healthcare productivity growth rates, 1996 to 2013
Image .csv .xls
Figure 6b: Growth rate and index for public service healthcare productivity for current and previous publication, 1995 to 2014

Source: Office for National Statistics
Download this image Figure 6b: Growth rate and index for public service healthcare productivity for current and previous publication, 1995 to 2014
.png (33.6 kB) .xls (29.7 kB)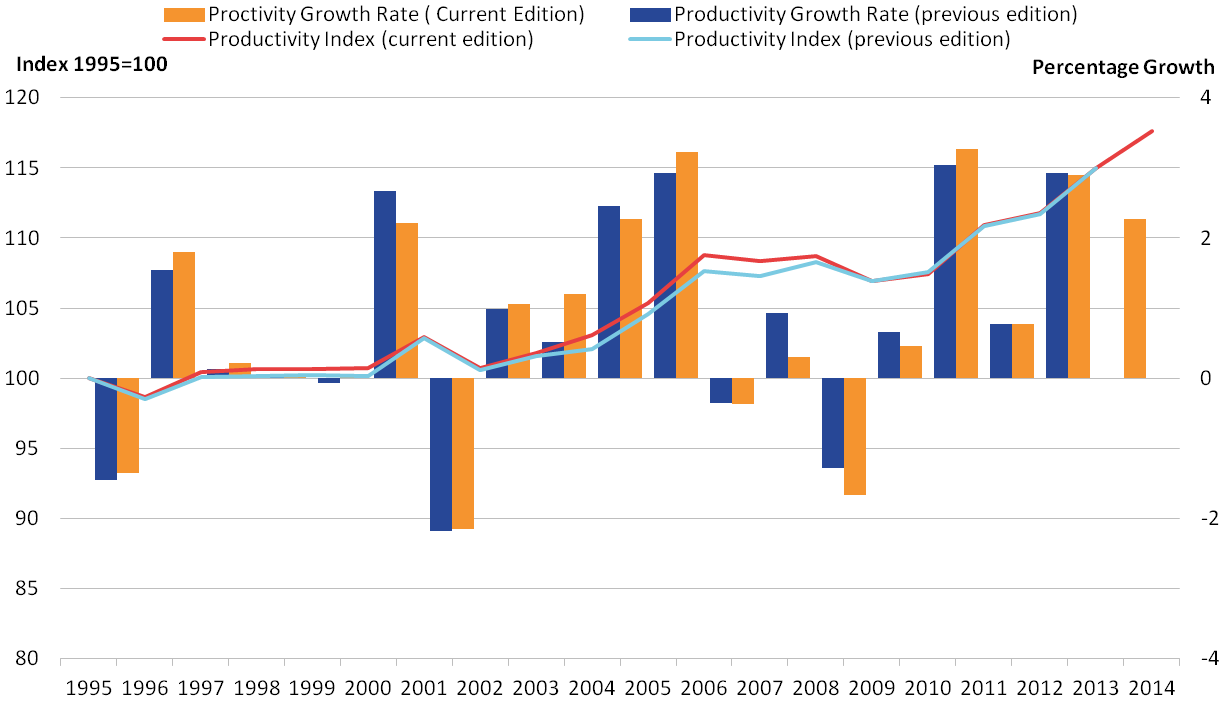
Figure 6a and 6b show that the largest revisions are for 2004 and 2008 (0.7 and negative 0.6 percentage points respectively). The largest upwards revision, which occurred in 2004, is mainly due to negative agency staff and capital consumption growth rates in 2004 reducing total inputs growth and thus increasing productivity growth. The largest downwards revision occurring in 2008 is mainly due to the addition of agency staff expenditure increasing inputs growth and therefore decreasing productivity growth. However, it is also important to note that the incorporation of updated source data will also be partly responsible for the revisions to productivity growth.
Despite changes in the productivity growth rate for some years, these revisions have not led to a change in the average annual growth rate over the period 1995 to 2013, relative to those published in Public service productivity estimates: healthcare, 2013.
Notes for: Revisions
- More information on changes to the data for consumption of fixed capital can be found in Total Public Service Productivity, 2014, and articles on the methodological changes to the estimation of capital stocks and consumption of fixed capital and the impact of the methodological changes to the estimation of capital stocks and consumption of fixed capital.
8. Quality and methodology
The Public service productivity estimates: healthcare Quality and Methodology Information document contains important information on:
- the strengths and limitations of the data
- the quality of the output, including the accuracy of the data and how it compares with related data
- uses and users
- how the output was created
More detailed information on methods is available in the healthcare sources and methods paper1.