Table of contents
- Abstract
- Main points
- Understanding public service productivity
- Total public service
- Contributions of service areas
- Quality adjustment
- Indirectly measured service output
- Healthcare
- Education
- Adult social care
- Children’s social care
- Social security administration
- Public order and safety
- Police, defence and other government services
- Revisions
- Annex A
- Annex B
1. Abstract
This release contains updated estimates of output, inputs and productivity for public services in the UK between 1997 and 2013, in addition to new estimates for 2014.
Productivity of public services is estimated by comparing the growth in the total amount of output with growth in the total amount of inputs used. Productivity will increase when more output is being produced for each unit of input, compared with the previous year.
Separate estimates of output, inputs and productivity are provided for:
- healthcare
- education
- adult social care (ASC)
- children’s social care (CSC)
- public order and safety (POS)
- social security administration (SSA)
Only inputs estimates are provided for police, defence, and other government services, as output is not easily measurable. It is therefore assumed that output is equal to the inputs used to create them and therefore productivity change in these services is zero.
Output, inputs and productivity for total public services are estimated by combining growth rates for individual services using their relative share of total government expenditure as weights.
Back to table of contents2. Main points
In 2014, total public service productivity grew by 0.2% compared to the previous year; productivity, as measured in this release, is at its highest since 1998
This is the fourth successive year of improving productivity and marks the longest consecutive period of productivity growth for total public services for which estimates are available.
Growth in 2014 was driven by growth in output for total public services of 1.6%, exceeding inputs which grew by 1.4%.
The annual average growth rate of total public service productivity from 1997 to 2014 was 0.1% per year.
Back to table of contents3. Understanding public service productivity
This release contains updated estimates of output, inputs and productivity for public services in the UK between 1997 and 2013, in addition to new estimates for 2014. Figures are published on a calendar year basis for consistency with the UK National Accounts.
UK public service healthcare output, inputs and productivity estimates are included in the measure of total public service productivity. More detail on healthcare output, inputs and productivity can be found in the separate article, Public Service Productivity Estimates: Healthcare 2014.
Productivity of public services is estimated by comparing growth in the total amount of output with growth in the total amount of inputs used. Productivity will increase when more output is being produced for each unit of input compared with the previous year. Estimates of output, inputs and productivity are given both as growth rates, which show the change from the previous year, and as indices, which show the trend over time (1997 to 2014).
Estimated growth rates of output and inputs for individual service areas are aggregated by their relative share of total government expenditure (expenditure weight) to produce estimates of total public service output, inputs and productivity. Therefore, where service areas have productivity growing at the same rate, a service area that accounts for a greater share of total expenditure will have a greater effect on overall growth rate for total public services.
Inputs are composed of labour (which can either be measured directly through means such as number of staff or indirectly by measuring service area expenditure on staff1), procurement (expenditure on goods and services), and consumption of fixed capital. These inputs, as appropriate, are adjusted for inflation using a suitable deflator. Expenditure data used to estimate inputs growth is based on annually published Maastricht (MAAST) supplementary data tables. These tables are consistent with estimates of government deficit and debt reported to the European Commission under the terms of the Maastricht Treaty. They are published on a calendar-year basis and provide the required detailed breakdown by the Classification of Functions of Government (COFOG).
The method of measuring output varies between and within service areas. Table 1 provides a breakdown of these, as well as a definition of output measure.
Table 1: Definitions of output measures
| Output Measure | Service areas | Coverage1(%) | Definition | ||||
| Quantity output | Social security administration | 100 | The number of activities performed and services delivered. Growth in individual activities are weighted together using the relative cost of delivery. | ||||
| Adult social care | 100 | ||||||
| Children’s social care | 40 | ||||||
| Public order and safety | 100 | ||||||
| Education | 25 | ||||||
| Quality- adjusted output | Healthcare | 90 | Quantity output is adjusted for the quality of the services delivered. If the quality adjustment is positive, estimates of output growth will increase. Healthcare quality is measured using a combination of indicators including survival rates, waiting times and patient satisfaction. Education quality is measured using examination performance. | ||||
| Education | 75 | ||||||
| “Inputs = output” | Police | 100 | Some services we cannot measure output directly, so we assume the volume of output equals the volume of inputs used to create them, meaning that productivity growth will always be zero. | ||||
| Defence | 100 | ||||||
| Other services | 100 | ||||||
| Healthcare | 10 | ||||||
| Children's social care2 | 60 | ||||||
| Source: Office for National Statistics | |||||||
| Notes: | |||||||
| 1. Coverage refers to the proportion of service area’s output accounted for by the associated type of output measure. | |||||||
| 2. For children's social care inputs isn’t strictly equal to output. Expenditure data are deflated to produce the inputs and outputs series, meaning that outputs are indirectly measured. However, different data sources are used for the inputs and output series so productivity growth is not expected to be zero. | |||||||
Download this table Table 1: Definitions of output measures
.xls (30.2 kB)A table summarising the methods for each service area is provided in Annex A, and further information on methods is available in our public service productivity sources and methods paper and quality and methodology information article.
Estimates in this release are provided for the UK, the amount of data included for each of the devolved administrations varies for each service area based on its availability. As England has the largest expenditure share, trends in output, inputs and productivity for England tend to determine the overall UK trend; therefore, much of the additional context provided in this article to aid interpretation of the estimates relates to services in England.
It is important to note that while these productivity estimates provide a measure of the amount of output produced for each unit of input, they do not measure value for money or the wider performance of public services. They do not indicate, for example, whether the inputs have been purchased at the lowest possible cost, or the extent to which the desired outcomes are achieved through the output provided.
The estimates in this release have an open revisions policy, meaning that each time a new article is published, revisions can occur for the whole of the period. Further details and explanation of revisions to previous estimates can be found later on in this article.
We also produce experimental quarterly estimates of total public service productivity. The experimental estimates use different sources to the annual estimates, containing less detail and necessarily involving a greater degree of estimation than the annual estimates. As a result, these experimental quarterly estimates are not replacements for the annual estimates in this article, and are merely intended to provide a more timely estimate for the more recent period. More detail on quarterly total output, inputs and productivity can be found in the separate article, Quarterly public service productivity (experimental statistics): July to Sept 2016.
Feedback on the use of these estimates and suggestions for improvements is essential for the future development of estimates for public service productivity. Therefore, we would like to invite you to complete a Data User Engagement Survey.
Notes for: Understanding public service productivity
- Agency staff are not captured as part of a service area's labour inputs but are instead included within a service area's procurement inputs.
4. Total public service
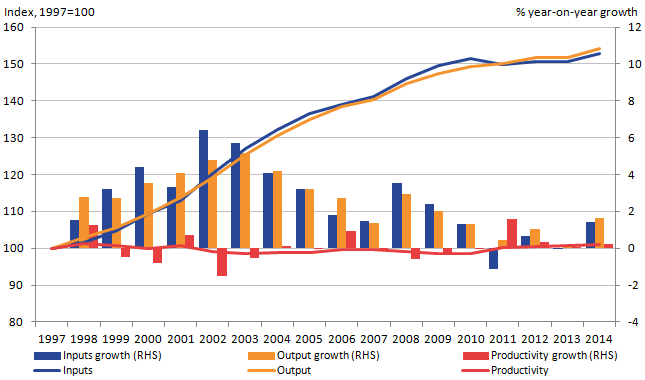
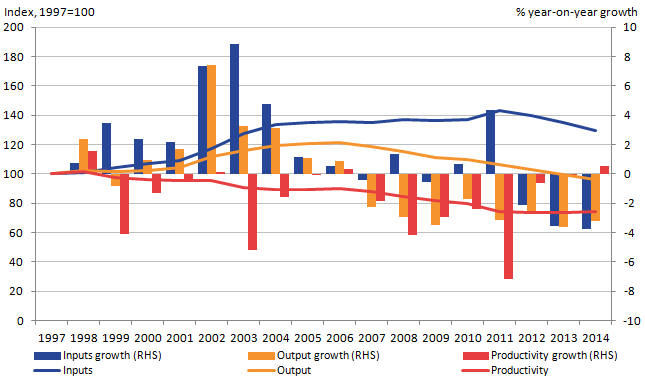
In 2014, productivity for total public services was estimated to have increased by 0.2%, as output grew by 1.6% exceeding inputs growth of 1.4%. This followed a productivity rise of 0.1% in 2013, with the output and inputs of total public service productivity growing by 0.0% and falling by 0.1% respectively.
Figure 1: Total public service inputs, output and productivity indices and growth rates, 1997 to 2014, UK
Source: Office for National Statistics
Notes:
- RHS stands for right-hand side
- Percentage growth rate shows the year-on-year growth
Download this image Figure 1: Total public service inputs, output and productivity indices and growth rates, 1997 to 2014, UK
.png (21.9 kB) .xls (30.2 kB)
While experiencing weak growth (reflecting the similar growth paths of inputs and output), total public service productivity has been on an upwards trend in recent years, increasing consecutively over the last 4 years.
Breaking down the productivity estimate into the underlying changes in inputs and output of total public services, Figure 1 shows that, throughout the series, inputs and output have followed each other closely. Initially experiencing an upwards trend, growth in inputs slowed in the latest decade and contracted for the first time in 2011. This coincided with reductions in some departments as part of the Spending Review 2010. Since then inputs growth has remained broadly flat, although volume of inputs is still around 53% higher than in 1997. Output, on the other hand, has grown throughout the entire time series, overtaking inputs in 2011. As a result, and while experiencing relatively slower growth in recent years, UK public services output are around 54% higher than in 1997.
Back to table of contents5. Contributions of service areas
To provide further context behind the recent changes in total public service productivity, as well as total inputs and output, we can observe the contributions of individual service areas to all 3 series.
The contribution an individual service area makes to growth in total public service measures is dependent on not only the growth in that service area, but also its weight relative to total expenditure. The breakdown of expenditure between service areas, for 2014, can be seen in Figure 2.
Figure 2: Expenditure weights by service area, 2014, UK
Source: Office for National Statistics
Notes:
- Sum of components may not equal 100 due to rounding
- Other refers to other government services which includes services such as economic affairs, recreation, and housing
- To combine growth rates for each component, expenditure shares for the previous year are used in calculation of a Laspeyres index. For more information, see Robjohns (2006) Methodological Note: Annual Chain Linking
- Public order and safety includes courts and probation services, prison service and fire service
Download this chart Figure 2: Expenditure weights by service area, 2014, UK
Image .csv .xlsSince 1997, public service productivity has been weak, falling over the early part of the time series, but experienced an upwards trend from 2011 onwards. Figure 3 highlights some of the drivers behind this trend, showing contributions to total public service productivity growth by service area since 1998.
Figure 3: Contributions to growth of total public service productivity, 1998 to 2014, UK
Source: Office for National Statistics
Notes:
- Individual contributions may not sum to the total due to rounding.
- The above figure does not include indirectly measured output as they do not contribute to productivity due to the assumption their "inputs = output"
- Public order and safety includes courts and probation services, prison service and fire service
- Other refers to other government services, which comprises of services such as economic affairs, recreation, and housing
Download this chart Figure 3: Contributions to growth of total public service productivity, 1998 to 2014, UK
Image .csv .xlsOver the whole of the series, both healthcare and education have been the key drivers of growth and contractions in total public service productivity. This is largely because, combined, they account for 54.3% of total public services.
Figure 3 shows that total public service productivity, while increased between 2010 and 2014, annual growth has slowed. While service areas such as healthcare, and public order and safety (POS) have provided a positive contribution to total productivity since 2010, negative contributions from the education service over the past 2 years and a negative contribution in 2014 from children’s social care, have meant productivity growth overall for UK public services has slowed.
It is worth noting that there is no observed contribution to total public service productivity from the indirectly measured service areas. This is in connection with the “inputs=output” convention and that these service areas can neither be more or less productive when comparing one year to another, as any growth or contract in inputs will be matched with an equally positive or negative growth in output.
Zero contributions from these service areas have a dampening effect on total public service productivity growth, relative to their expenditure weight. Estimates for total public service productivity growth in 2014, removing police, defence and other government services would have risen by 0.3%.
Figure 4 and Figure 5 show contributions of each service area to growth in total public service inputs and output respectively.
Figure 4: Contributions to growth of total public service inputs, 1998 to 2014, UK
Source: Office for National Statistics
Notes:
- Individual contributions may not sum to the total due to rounding
- Public order and safety includes courts and probation services, prison service and fire service
- Other refers to other government services, which comprises of services such as economic affairs, recreation, and housing
Download this chart Figure 4: Contributions to growth of total public service inputs, 1998 to 2014, UK
Image .csv .xlsAs mentioned earlier, a defining feature of recent growth in total public service productivity has been the relatively flat experience in inputs. Figure 4 helps identify some of the key drivers behind this.
Since the mid-2000s, growth in other government service inputs has slowed or contracted – this can also be seen in similar services like defence and police – and thereby have dampened growth of inputs. However, these service areas use the “inputs=output” convention and therefore growth or falls in inputs in these service areas are also reflected in falls in output.
From around 2009, positive contributions from most service areas began to shrink and a number of them turn negative. This is particularly prominent in 2011 where all service areas, barring adult social care and defence, contributed towards a contraction in total public service inputs. What this trend correlates to is reductions in departmental budgets and while growth in inputs has returned, it is noticeably subdued. Comparing average growth between the 2 periods, between 1997 and 2009 average annual growth for total public service inputs was 3.4%, whereas between 2009 and 2014, average growth was around 0.4% per year.
Figure 5: Contributions to growth of total public service output, 1998 to 2014, UK
Source: Office for National Statistics
Notes:
- Individual contributions may not sum to the total due to rounding
- Public order and safety includes courts and probation services, prison service and fire service
- Other refers to other government services, which comprises of services such as economic affairs, recreation, and housing
Download this chart Figure 5: Contributions to growth of total public service output, 1998 to 2014, UK
Image .csv .xlsThe UK’s total public service output since 1997 has grown, however, over the last few years that growth has slowed. While output experienced a return to growth in 2014, increasing by 1.6%, Figure 5 shows that the key driver of this was growth in healthcare outputs, reflecting healthcare outputs growing over the same period and the service area’s size relative to the entirety of UK public services. Negative contributions from service areas such as education, adult social care (ASC) and public order and safety (POS) subsequently dampened growth.
Back to table of contents6. Quality adjustment
There are 2 types of direct measures of output; the quantity of activities performed and services delivered (quantity output), and the quality of those activities and services (quality-adjusted output). The difference between the 2 types being that quality-adjusted output is quantity output, adjusted to account for changes in quality.
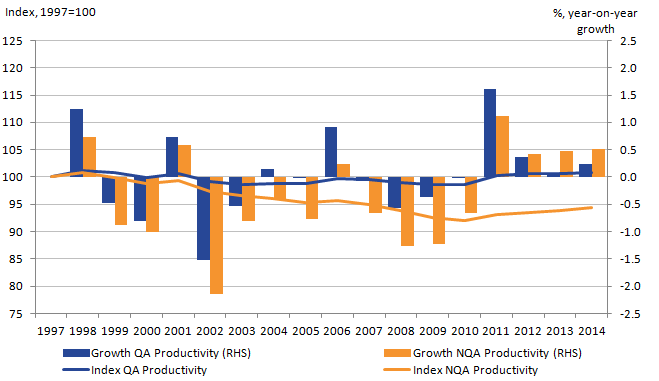
In the headline measures, quality adjustment is only applied to the output of healthcare and education. However, due to their combined size relative to total public services, this has a clear impact on the estimates of both total public service output and productivity.
Figure 6: Quality and non-quality adjusted total public service productivity indices and growth rates, 1997 to 2014, UK
Source: Office for National Statistics
Notes:
RHS stands for right-hand side.
Percentage growth rate shows the year-on-year growth
QA refers to quality-adjusted
NQA refers to non quality-adjusted
Download this image Figure 6: Quality and non-quality adjusted total public service productivity indices and growth rates, 1997 to 2014, UK
.png (17.6 kB) .xls (30.2 kB)
Figure 6 compares total public service productivity with and without the quality adjustment for public service healthcare and education. The indices show that between 1997 and 2014, if total public service productivity had not been quality adjusted, it would have fallen by 5.7%, whereas quality adjusted total public service productivity increased by 0.9% over the same period. However, in recent years the impact of quality adjustment has been to slow growth in overall UK public service productivity. In 2014, non-quality adjusted productivity grew by 0.5%, marking the third consecutive year that it exceeded growth of overall quality-adjusted productivity. With the inclusion of quality adjustment, productivity for total public services estimated to be slower, growing by 0.2% between 2013 and 2014.
Further information on the methods of quality adjustment and their impact on estimates of output and productivity for the healthcare and education services areas are available in their associated publications.
Back to table of contents7. Indirectly measured service output
For service areas where it is hard to estimate the quantity of output (due to the lack of market transactions and/or the services are collectively consumed) it is assumed that the volume of output is equal to the volume of inputs used in producing them. This is known as the “inputs=output” convention and it is estimated that productivity growth for these services is zero. This applies to the police, defence and other government services, which combined account for 31.8% of total public service expenditure in 2014.
In addition to police, defence, and other services, the “input=output” convention is also applied to approximately 10% of healthcare output (capturing services delivered by non-NHS providers). Children’s Social Care (CSC) output relating to non-looked after children (60% of all CSC output) is also measured indirectly using the volume of inputs to those services. Together these indirectly measured outputs account for a further 5.2% of total expenditure.
These zero contributions to productivity growth from indirectly measured or “inputs=output” service areas limits the growth in total public service productivity. The extent to which they affect growth of total public service productivity is proportional to their share of total expenditure. The proportion of total expenditure for indirectly measured service area output has been steadily decreasing from 41.7% in 1997 to 37.0% in 2014 – chiefly driven by defence’s share shrinking. The impact of indirectly measured output on total public service productivity has therefore decreased over the time series.
The following sections provide more detailed data on output, inputs and productivity growth rates and indices for the individual service areas. Where possible, commentary has been provided to aid interpretation.
Back to table of contents8. Healthcare
Healthcare productivity grew in 2014, by 2.3%, driven by growth in output of 5.2%, with a 2.8% increase in inputs. This is the fifth consecutive year of productivity growth with productivity growing on average 0.9% each year between 1997 and 2014.
Figure 7: Healthcare inputs, output and productivity indices and growth rates, 1997 to 2014, UK

Source: Office for National Statistics
Notes:
- RHS stands for right-hand side.
- Percentage growth rate shows the year-on-year growth.
Download this image Figure 7: Healthcare inputs, output and productivity indices and growth rates, 1997 to 2014, UK
.png (19.3 kB) .xls (31.2 kB)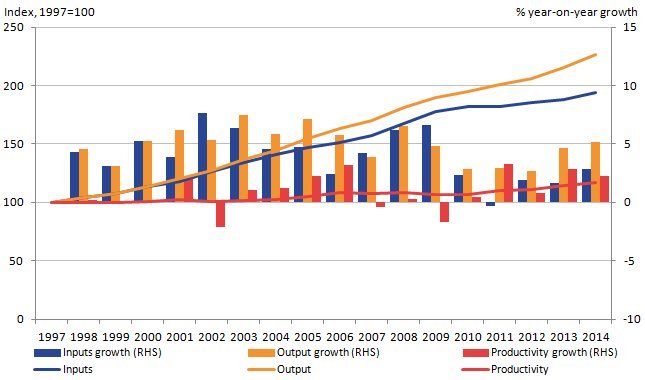
A fuller analysis of healthcare productivity can be found in the article Public Service Productivity Estimates: Healthcare 2014 that contains greater detailed information on both the estimates and methods used to create them.
Back to table of contents9. Education
In 2014, productivity of UK education services area are estimated to have fallen by 2.6%, as a result of inputs growing by 1.6% while quality-adjusted output fell by 1.0%. As shown in Figure 8, this is the second consecutive annual contraction in education service productivity. While the education service has experienced contractions in productivity previously, these 2 are different in that both the inputs and quality-adjusted output series are working against productivity growth, growing and contracting respectively.
Caution should be used when interpreting the change in the quality-adjusted output trend from 2008 onwards. Over this period, there have been changes to the examinations, which count towards school performance statistics in England that influenced both the number and type of examinations sat by some pupils. As a result, some of the change in attainment statistics used for quality adjustment may not be entirely caused by changes in the quality of education provided. In particular, changes to school performance tables announced by the Department for Education – as a result of Professor Alison Wolf’s review of vocational education – limited the size and number of non-GCSEs that counted towards performance which impacted on attainment statistics from academic year 2012 to 2013 (Revised GCSE and equivalents results in England, 2013 to 2014).
Figure 8: Education service inputs, output and productivity indices and growth rates, 1997 to 2014, UK

Source: Office for National Statistics
Notes:
- RHS stands for right-hand side
- Percentage growth rate shows the year-on-year growth
Download this image Figure 8: Education service inputs, output and productivity indices and growth rates, 1997 to 2014, UK
.png (19.6 kB) .xls (30.7 kB)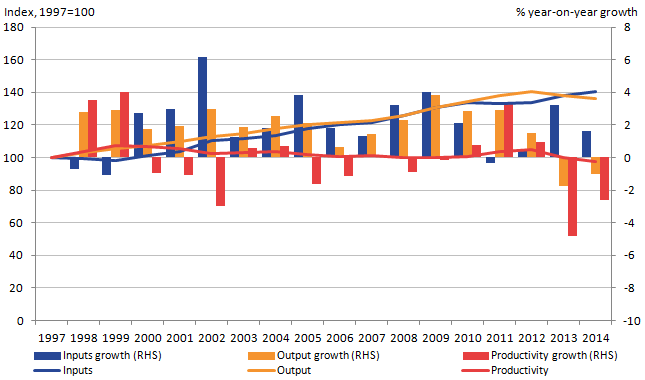
Investigating both inputs and output separately, Figure 9 shows inputs growth of education services by component weighted by expenditure share, showing how growth in one type of input (for example, labour) contributes to the growth in total education service inputs. In 2014, inputs growth was 1.6%; the majority of growth coming from labour, contributing an increase of 2.0 percentage points. However, this was partially offset by a contraction in procurement (the purchase of goods and services), pulling down growth by around 0.5 percentage points.
Figure 9: Contributions to education inputs growth by component, 1998 to 2014, UK
Source: Office for National Statistics
Notes:
- Individual contributions may not sum to the total due to rounding.
Download this chart Figure 9: Contributions to education inputs growth by component, 1998 to 2014, UK
Image .csv .xlsSince 2000, public service education inputs have grown, with the one exception of a 0.3% decrease in 2011. Historically, growth has been driven by changes in both labour and procurement inputs. Between 1997 and 2014, labour inputs have grown at an annual average rate of 1.0% while procurement has grown on average by 0.8%. The annual average growth rate of inputs over the whole series from 1997 to 2014 was 2.0%.
Consumption of fixed capital, on the other hand, has had a relatively smaller effect on overall growth – on average growing annually by 0.1%. After the largest contribution to growth in capital input of 0.4% in 2010, growth rates have slowed over time to 0.1% in 2014. Due to a change in data source, estimates of consumption of capital have decreased in magnitude across the entire series when compared to previous estimates. This is discussed in more detail in the revisions section for this article.
Focusing on education’s output, quality-adjusted output fell in 2014, contracting by 1.0%, following a fall of 1.7% in 2013. Quantity output, however, rose in both 2013 and 2014, increasing by 0.6% and 1.3% respectively. The cause of the difference between these 2 measures is the impact of quality adjustment. The impact of this quality adjustment, as well as annual growth in both quantity and quality-adjusted education output, is shown in Figure 10.
Figure 10: Contributions to quality-adjusted education output growth by component, 1998 to 2014, UK
Source: Office for National Statistics
Notes:
- Individual contributions may not sum to the total due to rounding.
- QA refers to quality-adjusted
Download this chart Figure 10: Contributions to quality-adjusted education output growth by component, 1998 to 2014, UK
Image .csv .xlsOverall, the quality adjustment for educational output has been positive, increasing the annual average growth rate of output between 1998 and 2014, from 0.4% to 1.8%. When observing the mid- to late-2000s we can see that it caused education output to be positive. However, over the last 3 years, quality in educational output is estimated to have fallen and had a negative contribution to education quality-adjusted output. As noted above, however, this fall in the quality adjustment does not necessarily reflect a fall in the quality of education received, but may instead reflect rather changes to the number and types of qualifications that count towards GCSE performance tables in England.
Back to table of contents10. Adult social care
Adult social care (ASC) services include activities such as nursing and residential care, and domestic home care provided to clients with old age, disability, and mental health-related reasons. Adult social care outputs are estimated with direct quantity measures. However, ASC outputs for 2014 have been estimated using Holt-Winters forecasting on historical data, as changes in the data source have prevented measurement of 2014 output that is consistent with previous years. We are developing a methodology to enable continued production of ASC output and productivity measures beyond 2014 using new data sources, and we intend to publish statistics on the new methodology in 2017.
Figure 11: Adult social care inputs, output and productivity indices and growth rates, 1997 to 2014, UK
Source: Office for National Statistics
Notes:
- RHS stands for right-hand side
- Percentage growth rate shows the year-on-year growth
Download this image Figure 11: Adult social care inputs, output and productivity indices and growth rates, 1997 to 2014, UK
.png (20.0 kB) .xls (31.2 kB)
Figure 11 shows that ASC productivity has fallen between 1997 and 2014. Between 1997 and 2006, inputs and outputs both grew, with inputs growing at a faster rate than outputs, resulting in falling productivity. The fall in productivity continued between 2006 and 2012, as, while inputs growth slowed (with the exception of 2011, where there was an increase in procurement expenditure), outputs fell in each year. Since 2012, outputs have continued to fall, but inputs have also fallen at a similar rate, resulting in productivity levels stabilising. Over this period, councils have been seeking to make efficiencies in the delivery of services through, for example, reducing bureaucracy, reducing the cost of commissioned services and outsourcing lower-level care to outside agencies. It is recognised that some of the reduction in spending has also been a result of service reduction as reflected in the falling output measure.
Prior to 20141, quantity output is measured by the number of care activities, ranging from weeks of residential care to the number of “meals on wheels” provided. Output has fallen for the eighth year in a row, with fewer people receiving local authority social care between financial year ending 2006 and financial year ending 2013 (Personal Social Services Research Unit: 2013). There are a number of potential reasons for this fall:
tightening of the eligibility criteria for publicly funded support
councils’ focus on prevention, improving independence and promotion of non-residential care as outlined in Adult Social Care funding 2014: state of the nation
a greater proportion of clients opting for Direct Payments and not receiving services directly
However, care should be taken when interpreting these estimates of output – as well as the associated productivity measures. The estimates may not fully reflect the true value of adult social care productivity for a number of reasons:
they do not account for changes in the quality of care provided
output is measured using quantity activity data, such as the number of weeks in residential care, or the number of hours of home care received, and does not take full account of the intensity of need of the individual being cared for; this may result in an underestimation of output as reductions in the number of people receiving care are focused on those with lower levels of need, leaving a higher proportion of high need individuals. The value of preventative activity which reduces demand for these services may also not be fully reflected
inputs used in providing direct payments are included within the measure of ASC inputs, but direct payments are not included in the activities that make up the output measure. Direct payments in England have increased in recent years (Personal Social Services Expenditure 2014-15) and this may therefore account for some of the recent fall in productivity
We are currently undertaking work to investigate methodologies to mitigate some of these issues.
Notes for: Adult social care
- ASC outputs for 2014 have been estimated using Holt-Winters forecasting on historical data, as changes in the data source have prevented measurement of 2014 output that is consistent with previous years.
11. Children’s social care
Accounting for around 2.8% of total expenditure in 2014 – shown in Figure 4 – children’s social care (CSC) had a relatively strong, positive contribution to growth in total public service inputs. This was because of the service area’s inputs experiencing above average growth, growing by 11.6% in 2014. Some of this growth in children’s social services inputs is due to a reclassification of “Services to young people” in England (local authority revenue expenditure final 2014 to 2015). While similar to growth in the early 2000s, this is larger than an average annual growth of 3.9% between 1997 and 2013.
As shown in Figure 12, output has increased each year since 2012, increasing by 2.3% in 2014. However, the larger increase in inputs resulted in estimated productivity for CSC to fall by 8.3%. This is the largest contraction in the series and, combined with a historic trend of inputs exceeding growth in output, productivity is estimated to be 22.3 percentage points lower than in 1997 – although this is higher than estimates for 2008.
Estimates of CSC output are not quality-adjusted and therefore do not capture any improvement in the suitability and quality of care, consequently the productivity measure does not reflect changes in quality of services.
One of the aims of Children and Families Act 2014 is to improve the quality of children’s social care services. We are exploring developing this measure to include a quality adjustment to reflect changing quality over time.
Figure 12: Children's social care inputs, output and productivity indices and growth rates, 1997 to 2014, UK

Source: Office for National Statistics
Notes:
- RHS stands for right-hand side
- Percentage growth rate shows the year-on-year growth
Download this image Figure 12: Children's social care inputs, output and productivity indices and growth rates, 1997 to 2014, UK
.png (22.9 kB) .xls (31.2 kB)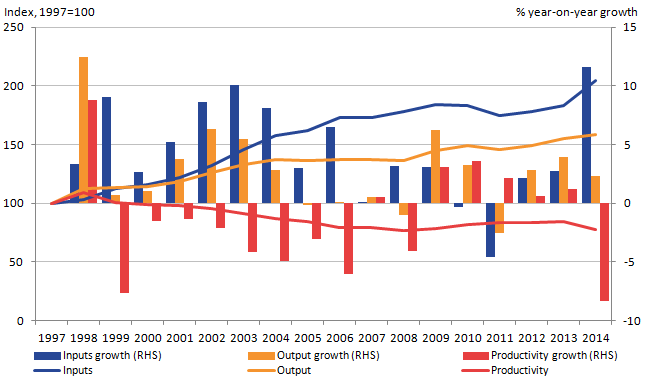
Taking a closer look at the latest growth in inputs, both labour and procurement expenditure are adding to CSC inputs growth – there is no contribution from capital, as there is no estimate of capital consumption in this service area.
With upwards revisions in 2013 – revising up a contraction of 4.6% to growth of 2.7%, driven by the availability of more complete data – and growth in 2014 coinciding with policy changes such as the Children and Families Act 2014, CSC inputs have been on an upwards trend since 2011 and the 2010 Spending Review.
Evidence shows that, while councils have reduced their overall spending in recent years in response to significant reductions in government funding, local authorities’ budgets show that spending on CSC was predicted to increase by 7% in real terms between 2010 to 2011 and 2014 to 2015 (Children in care, National Audit Office). This suggests, supported by evidence, that local authorities are protecting frontline childcare services.
Looking at output, Children’s social care output is calculated separately for looked after children (LAC) and non-looked after children (non-LAC). A child is classed as looked after (LAC) by a local authority if a court has granted an order to place them in care, or a council’s children’s services department has cared for the child for more than 24 hours. A child is classed as non-looked after (non-LAC) if they are not taken out of their home environment but are being monitored. While output for LAC is directly measured, Non-LAC is indirectly measured using deflated expenditure on children’s social care services provided by the respective countries administrations.
Since 1997, output for LAC has increased in all years except 2006, with the number of looked after children steadily increasing and it is now higher than at any point. Growth over the last 3 years has been driven by increasing output related to Non-LAC which relates to an increase in expenditure on activities such as assessments and preventative measures in children’s services.
Back to table of contents13. Public order and safety
Public order and safety (POS) saw productivity increase in 2014, rising by 4.6%. This is the second consecutive year of growth, POS productivity growing by 2.6% in 2013. However, between 1997 and 2014 productivity for POS has fallen, on average, by 1.8% per year.
Estimates for POS presented here include activities carried out by the fire services, courts (including probation) and the prison service. While a part of the public order and safety government expenditure classification (as defined by the Classification of Function of Government), the police service is treated as a separate service area within this publication. Other elements of public order and safety not listed as above (that is, POS not else wise classified) are captured with in estimates for other government services.
Figure 14: Public order and safety inputs, output and productivity indices and growth rates, 1997 to 2014, UK
Source: Office for National Statistics
Notes:
- RHS stands for right-hand side.
- Percentage growth rate shows the year-on-year growth.
- Public order and safety includes courts and probation services, prison service and fire service
Download this image Figure 14: Public order and safety inputs, output and productivity indices and growth rates, 1997 to 2014, UK
.png (21.2 kB) .xls (31.2 kB)
Breaking down the productivity estimates into the underlying changes in inputs and output of POS, Figure 14 shows that, prior to 2006, POS output had remained broadly flat but since then has been on a downwards trend.
The courts and probation service mainly drive variation in output, accounting for around 50% of total POS expenditure.
There was a fall in output for the courts service in 2014 of 4.8% caused by falls in activity in all services except Crown Courts. This fall is faster than the long-term trend with an annual average fall in output of 2.5% per year between 1997 and 2014, but is consistent with falls in the most recent years, with an annual average fall in output between 2010 and 2014 of 4.7% per year.
By contrast, growth in fire services and prison services output have had relatively less impact. Capturing activities such as responses to fires, flooding and assisting at road traffic collisions, fire service output continued its downward trend contracting by 3.9% in 2014. The largest proportion of activities involved attending false alarms, which have decreased over the series. A corresponding increase in output for prevention activities could be linked to a decrease in activities for fire responses.
Probation services experienced a continued decrease in output, falling by 1.0%. It's sixth consecutive contraction. While prison service output, following a contraction of 2.8% in 2013, grew by 1.2% in 2014.
Looking at inputs over time, prior to 2006 POS’s inputs were on a general upwards trend, driven by increasing spend on courts. However, a 7.1% fall in 2014 marks the fifth consecutive contraction in POS inputs. Excluding the fall in 2011, this has been as a result of a reversal of that trend. Now driven downwards by contraction of inputs into UK courts. In particular, falling expenditure on Legal Aid coinciding with the Legal Aid, Sentencing and Punishment of Offenders (LASPO) Act 2012, which, amongst other things, removed financial support for most cases involving housing, welfare, medical negligence, employment, debt and immigration.
Back to table of contents14. Police, defence and other government services
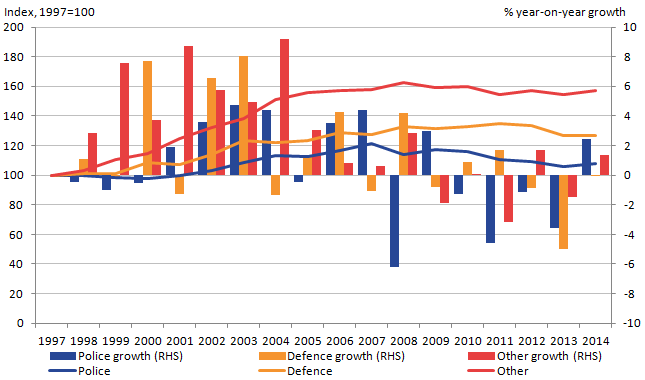
Output for police services, defence and other government services is measured using the “inputs = output” convention which assumes that the volume of output is equal to the volume of inputs used in producing the output. As output will always be equal to inputs under this convention, productivity remains constant with a growth rate of zero. Combined, police, defence and other government services had an expenditure share of 31.8% in 2014.
Figure 15: Indirectly measured UK public service areas inputs indices and growth rates, 1997 to 2014, UK
Source: Office for National Statistics
Notes:
- RHS stands for right-hand side.
- Percentage growth rate shows the year-on-year growth.
- Other refers to other government services, which comprises of services such as economic affairs, recreation, and housing.
Download this image Figure 15: Indirectly measured UK public service areas inputs indices and growth rates, 1997 to 2014, UK
.png (21.7 kB) .xls (31.2 kB)
Breaking down trends and growths into the 3 individual service areas, Figure 15 shows that while experiencing the slowest growth over the entire period – being 8.1% larger than in 1997 – police inputs experienced strong positive growth in 2014, growing by 2.5%. This is the service area’s first period of growth since 2009 and, while having a mixed experience amongst its components, has been driven by increases in expenditure on central government labour.
Defence, on the other hand, experienced flat growth (0.0%) in 2014 relative to the previous year. This followed a relatively sharp contraction in 2013 that reflected falls in expenditure on foreign military aid, although estimates were revised, showing a smaller contraction than previous estimated.
Finally, in 2014 other government services – comprising of services such as economic affairs, recreation, and housing (see Annex B for more details) – grew by 1.4%. Overall, other government services have experienced the strongest growth – relative to other indirectly measured service areas. However, this is chiefly attributable to strong growth in the early part of the series and since 2005, inputs growth has been relatively weak, averaging just 0.1% each year between 2005 and 2014.
Back to table of contents15. Revisions
All estimates, by definition, are subject to statistical “error”, but in this context, the word refers to the uncertainty inherent in any process or calculation that uses sampling, estimation or modelling. Most revisions reflect either the adoption of new statistical techniques, or the incorporation of new information, which allows the statistical error of previous estimates to be reduced.
Public service productivity estimates operate an open revisions policy. This means that new data or methods can be incorporated at any time, and will be implemented for the entire time series. As this article is produced using more timely data it involves a degree of estimation where data are incomplete.
Figure 16: Revisions to growth rates and indices of total public service productivity from previously published estimates, 1997 to 2014, UK

Source: Office for National Statistics
Notes:
- RHS stands for right-hand side.
- Percentage growth rate shows the year-on-year growth
Download this image Figure 16: Revisions to growth rates and indices of total public service productivity from previously published estimates, 1997 to 2014, UK
.png (21.9 kB) .xls (30.2 kB)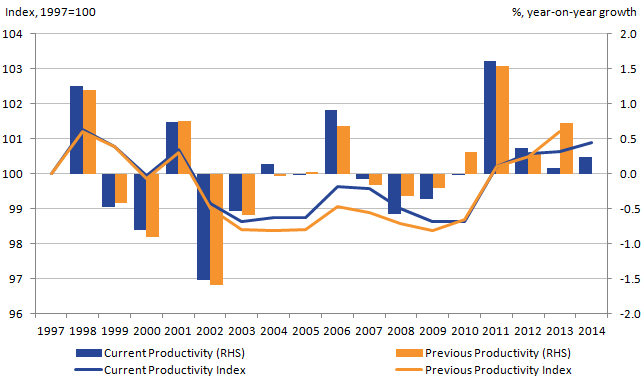
As shown in Figure 16, revisions to previous estimates mean that total public service productivity was lower than initially calculated, growing by 0.1% as opposed to growing by 0.7% in 2013.
However, when comparing over the entirety of the time series Figure 16 also shows that, while experiencing a contraction in the early 2000s, it was to a lesser degree than previously estimated.
Revisions have been made to estimates for all service areas due to:
revisions made to data by data providers
the replacement of projected data with actual data
re-estimation of forecasts and backcasts
revisions to UK National Accounts as a result of changes from the implementation of new guidelines under the European System of Accounts 2010 (ESA10)
Revisions due to methods and/or data changes in individual service areas are summaries below.
Changes to capital consumption data
Estimates of capital consumption within this article have experienced revisions across the entire time series.
These changes reflect a number of improvements and key changes made to the methodology and disaggregation for estimating capital stocks and the consumption of fixed capital. These changes have had a small impact on the data for the total economy as well as the asset and industry breakdowns as the assumptions within the PIM (perpetual inventory method) model are now applied at a total economy level rather than for each sector individually. However, it maintains sector (that is, Households and Central Government) proportions across time.
Implemented by National Accounts, these changes reflect, as well as complying with the European System of Accounts 2010 (ESA10), alterations and adjustments made to address a number of issues raised with the quality of the data that had led to the withdrawal of capital stocks estimate from publication in 2011.
A full explanation of these changes, including assessments of impact are available in the articles methodological changes to the estimation of capital stocks and consumption of fixed capital and impact of the methodological changes to the estimation of capital stocks and consumption of fixed capital.
Changes to education capital consumption data
Previously Volume Index of Capital Services (VICS) for non-market education estimates was used as the measure for capital consumption in the inputs of education services. This was used because movement in capital services (rather than capital stocks) are the preferred method to measure changes in capital inputs in the framework for measuring multi-factor productivity (MFP).
However, from 2014 onwards VICS is no longer produced for non-market services as explained within Volume index of UK capital services (experimental): estimates to 2014.
As a result, estimates within this article use an alternative data source; General Government consumption of fixed capital within the education industry. The impact of this has been changes to the magnitude of growth across the series, as well as reduce capital’s share of education expenditure. Previously accounting for, on average, 14.2% of total education expenditure; this has dropped to 3.7% on average between 1997 and 2014. This has the added benefit of bringing estimates of capital for education in line with the remaining government services.
Changes to other government services
When compared to previous estimates, estimates between 1997 and 2013 saw upwards revisions over the entire time series for other government services, having a minor but cumulative effect. The cause of these revisions was because of Bluebook 2015 complying with the European System of Accounts 2010 (ESA10) on determining the classification of a number of institutional units and flows. Therefore, Blue Book 2015 and Pink Book 2015 included the reclassifications of Network Rail, Transport for London’s subsidiaries, contributions to Multilateral Development Banks, 3G/4G licenses and the Vehicle Registration Tax. As a result, while expenditure has not necessarily been revised upwards, other government services now captures a number of other expenditures, previously classified elsewhere. More detail and guidance on these reclassifications and their impact are published in our Methodological Improvements to National Accounts for Blue Book 2015: Classifications
Back to table of contentsContact details for this Article
Related publications
- Productivity flash estimate and overview, UK: January to March 2026 and October to December 2025
- Volume index of UK capital services (experimental): estimates to Quarter 2 (Apr to Jun) 2017
- Regional and sub-regional productivity in the UK: Jan 2017
- Regional firm-level productivity analysis for the non-financial business economy: Jan 2017
- Management practices and productivity in British production and services industries - initial results from the Management and Expectations Survey: 2016
- Public service productivity: quarterly, UK, October to December 2019
- Volume index of UK capital services (experimental): estimates to Quarter 2 (Apr to Jun) 2017
12. Social security administration
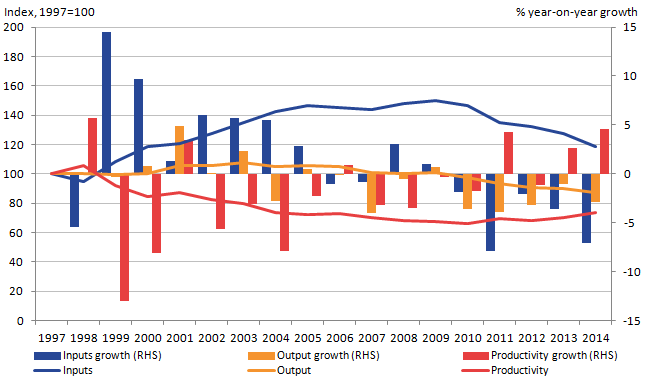
Productivity in social security administration (SSA) fell in 2014, contracting by 1.4% compared with the previous year. This decrease in SSA productivity reflects output falling by more than inputs, as shown in Figure 13.
Figure 13: Social security administration inputs, output and productivity indices and growth rates, 1997 to 2014, UK
Source: Office for National Statistics
Notes:
Download this image Figure 13: Social security administration inputs, output and productivity indices and growth rates, 1997 to 2014, UK
.png (24.3 kB) .xls (30.7 kB)Historically, growth in SSA output has been comparatively flat, although the 2014 estimate marks the fifth consecutive contraction in annual SSA output. Output growth for SSA is partly driven by the UK’s economic climate, as this influences the number of benefit claims. For example, output growth in 2008 and 2009 coincides with the economic downturn, a period in which claims for unemployment-related benefits experienced rapid growth. Recent falls, on the otherhand, are linked with a decrease in both new and existing benefit claims administered by Department for Work and Pensions (DWP).
Inputs have experienced much more volatility over the same period. Some of the volatility in the series may be caused by changes in the benefits provided which affected inputs through additional expenditure on administration and output through changes in eligibility and thus number of applications. Examples of this would be growth in inputs coincided with the replacement of the Minimum Income Guarantee with Pension Credit in 2003, while 2013 saw both the first stage rollout of Universal Credit and the introduction of Personal Independence Payments. However, recent falls or slow growth following the 2010 Spending Review were driven by factors such as reductions in staff numbers and the launch of digital services. Volatility in expenditure on goods and services may also be exaggerated in some years which have large quarterly changes by the presentation of data in calendar years instead of financial years.
While a large proportion of social security administration (SSA) covers activities undertaken in the administration of benefits by DWP, these estimates presented here cannot be taken as direct estimates of DWP productivity. As well as activities carried out by DWP, SSA includes activities carried out by of other government departments such as the administration of tax credits by Her Majesty’s Revenue and Customs (HMRC).
Equally, estimates of SSA productivity exclude a number of activities undertaken by DWP. These are subsequently classified as other forms of government expenditure and captured within other service areas.
Back to table of contents