1. Introduction
The Office for National Statistics (ONS) produces annual estimates of total public service productivity and breakdowns of specific areas including healthcare, education and adult social care. These annual estimates are produced with a 2 year lag reducing their value in public sector planning.
This article outlines a proposed ‘nowcasting’ method for new quarterly estimates of total public service productivity and compares them with previously published annual estimates to assess their quality. In summary, the quarterly estimates naturally have a more volatile path than the published annual estimates, but follow a similar long-term trend. Your feedback is most welcome, in particular on the most appropriate way to present the quarterly series.
These estimates will be published as Experimental Statistics later this year with a time lag of one quarter of a year, equivalent to the Quarterly National Accounts. Further research is being conducted into providing a breakdown of quarterly productivity estimates for individual services and accounting for changes in service quality where we have, for now, assumed the quality of service provided remains constant throughout the nowcast period.
This is a first step in developing new quarterly estimates and we are keen to make improvements over the coming year. We welcome comments on the methods and results presented in this article.
Back to table of contents2. Background
Public services represent around 20% of the UK economy, so improving their productivity and efficiency will make a significant contribution to strengthening the economy. Single departmental plans have recently been published for each of the major government departments, including the delivery of public services and actions to improve efficiency and to transform the way in which departments work. In order to monitor progress on public service efficiency, reliable timely performance measures are needed.
We currently produce annual estimates of public service productivity for individual public service areas as well as a combined estimate for total public services in the UK. These estimates are based on the principles outlined in the 2005 Atkinson Review on the measurement of government output and productivity for the National Accounts. These principles prioritise producing estimates of the highest possible accuracy, using detailed breakdowns of the underlying data and specific measures of the quality of public services provided. There is, however, a trade-off between accuracy and timeliness. The availability of data sources1prevents the publication of the annual public service productivity estimates on a timeline faster than with a 2 year lag.
The final report of Sir Charles Bean’s independent review of economic statistics identified the need for improvement in the timeliness of public service productivity estimates:
“Measures of public services output as part of the National Accounts are published on the same regular quarterly timetable as the expenditure measure of GDP. However, annual measures of public sector productivity, which reflect quality adjustments to health and education, appear roughly two years after the end of the reference year. Such a long lag reduces the value of the information in public sector planning. While the lags are in part a consequence of lags in the acquisition of the underlying information, there is perhaps scope for investigating whether other data within the public sector could be used to construct more timely preliminary estimates.”
The report accepts that early estimates based on incomplete information will be less reliable, but argues that the longer a decision maker has to wait for the statistics the less useful they are likely to be. The solution to this problem is to, “provide users with a sequence of estimates, based on increasingly richer underlying information”.
To improve timeliness, we have reviewed the basic method of estimating public service productivity to identify alternative data sources available on a more timely basis. In doing this we will be trading off some of the accuracy in the annual estimates to improve timeliness, as the alternative data sources will not be as detailed as those used to produce the annual estimates and will involve a degree of estimation.
Notes:
- For instance, estimating changes in output for public service healthcare requires data on tens of thousands of individual healthcare activities and their associated costs for each of the countries in the UK. These detailed data sets are available on a financial year basis with a lag of one year. The data necessary to produce the most recent estimates (for calendar year 2013) were first available for all countries in March 2015. This delivered an overall lag of around 15 months. Healthcare estimates are also adjusted for the quality of service provided measured by a suite of indicators including waiting times and survival rates. The detailed data sets required to produce this adjustment resulted in the estimates for calendar year 2013 being completed by December 2015, a lag of 23 months.
3. Methodology
We have identified more timely data sources in the Quarterly National Accounts (QNA) and related National Accounts publications. This section covers the proposed method for each of the main elements of estimating public service productivity.
3.1. Core theory
The productivity of public services is estimated by comparing the total amount of output with the total amount of inputs used. Productivity will increase when more output is being produced for each unit of input compared with the previous period. To make a valid comparison over time, we need output and input measures in volume terms to remove the impact of price changes. To estimate total public service productivity, at a minimum the following information is required:
expenditure at current prices on the inputs purchased by government to produce public services (usually referred to as General Government Final Consumption Expenditure, GGFCE)
price indices to adjust the current price expenditure for changes in the prices of inputs, to produce a volume measure of inputs
volume measure of government public service output1 , ideally taking into account changes in both the quantity and quality of activity
More accurate estimates of total public service productivity can be produced by combining output and input volume measures for individual services, rather than using data for total public services. Individual services can be combined using their share of total government expenditure on public services in the previous year2, taken from the current price General Government Final Consumption Expenditure (GGFCE) data3.
The quarterly nowcast estimates will be presented benchmarked to the latest quality adjusted annual public service productivity estimates. As new annual estimates become available, these will replace the quarterly nowcast estimates as the detailed data sources and methods which go into the production of the annual estimates mean they provide a more accurate picture of the historical trend.
3.2. Input volumes
Inputs are composed of labour, procurement of goods and services, and capital used in delivering public services. GGFCE in Quarterly National Accounts (QNA) is separated into these components and can also be split between local and central government and individual services.
For central government expenditure the main source of current price data is HM Treasury’s public spending database OSCAR (Online System for Central Accounting and Reporting) which collects financial information from across the public sector. Quarterly estimates are derived from monthly profiles of spending for the current financial year and data are modified with a number of adjustments to meet National Accounts requirements. Most local government expenditure data are financial year data, collated from detailed returns of expenditure compiled by local authorities. Further detail on data availability and methods of estimation is available in the technical annex.
To convert current price GGFCE into the volume of inputs series needed to estimate public service productivity, suitable deflators must be identified. The Atkinson Review recommends that deflators (price indices) are applied separately for labour, goods and services, and capital, and that the price indices should be specific to each function. In particular, price indices for procurement and labour should be sufficiently disaggregated to allow for changes in the inputs mix, meaning the range of goods and services purchased or the composition of the workforce. These specific deflators are used in the annual total public service productivity estimates, but it is not possible to compile them on a quarterly timely basis.
In selecting more timely deflators 2 main factors are taken into consideration:
- relevance – as far as possible the price indices should be specific to the input component and service expenditure which is being deflated
- timeliness – the price indices should be available on a quarterly basis with a lag no greater than the timeliness of QNA
As the focus of this method is to improve timeliness, the deflators chosen are those as relevant as possible which are available on the same time scale as QNA. Most of the deflators identified are input specific, for example using average weekly earnings for labour and some are specific to individual services with a generic public sector deflator used where a service level deflator was not available.
These deflators are applied separately to expenditure broken down by each inputs component, for central and local government, for individual services. The resulting volume series are aggregated to give a volume measure of inputs for each service, which are weighted together to give the volume of total public service inputs.
For services which use the “output = inputs” convention, deflators are already applied in the estimation of the chained volume measure4 (CVM) of government output, so no further work is required to derive deflators for these services. The technical annex lists the deflators used and provides a brief description.
3.3 Output volumes
The Quarterly National Accounts (QNA) provide estimates of government output as chained volume measures as part of the estimation of General Government Final Consumption Expenditure (GGFCE). The published volume series of total GGFCE from the QNA5 is taken as the volume of output for the estimation of timely quarterly public service productivity. Similarly, the same estimates of CVM output for individual services are used as the basis of the volume output measure in annual public service productivity estimates.
The method of estimating public sector output in the National Accounts is based on the recommendations of the Atkinson Review. Output of public services is generally non-market output in the sense that it is supplied free or at prices which are not economically significant and this absence of market transactions or prices makes the measurement of output for public services problematic. For this reason output for most service areas are measured by activities performed and services delivered, known as direct output measures.
For most service areas a range of activities are measured and aggregated into a single volume output using shares of GGFCE, known as a cost weighted activity index (CWAI). For collective services such as defence which are not provided to individuals, it is hard to define and therefore measure the nature of the output. For these services the “output = inputs” convention is applied which assumes that the volume of output is equal to the volume of inputs used to create them. In 2013, services which use the “output = inputs” convention made up 34% of total government expenditure on public services. Due to the availability of data sources, there is an element of nowcasting in producing the volume series of GGFCE data published in QNA. These nowcasts are replaced by actual data as data becomes available. Further detail on when actual activity and expenditure data becomes available for each service area and the method of estimation when data is not available, is provided in the technical annex.
3.4 Accounting for quality change
Ideally the output volume measure should be adjusted to account for changes in the quality of the service provided, as is done for public healthcare and education services in the annual public service productivity estimates. There is no adjustment for quality in the Quarterly National Accounts (QNA) measures of government output, so for now for the purpose of producing the new quarterly estimates we have assumed the quality of service provided remains constant through the nowcast period.
The investigation of nowcasting of more timely quality measures for healthcare, education and the remaining public services will form part of future investigations.
Notes:
- Output of public services is a volume measure of government final consumption expenditure, measured as the volume of activities. For more information on how this differs from value-added output used in other ONS measures of productivity see Comparing public service productivity estimates with other productivity estimates.
- Previous year expenditure shares are used in the calculation of a Laspeyres index as explained in these Methodology notes on annual chain linking.
- This is the method used in the annual public service productivity estimates where changes in the volume of output and inputs for individual services are combined using their relative share of total government expenditure on public services. This method is explained in more detail in the Quality and Methodology Information paper for total public service productivity estimates.
- Chained volume measures are time series which have the effects of inflation removed by considering changes in quantity between consecutive periods by holding prices constant at the values in the first period.
- Available through the ONS website as seasonally adjusted series NMRY and non-seasonally adjusted series NMRU.
4. Results
This section presents the quarterly nowcast estimates for total public services for the period Quarter 1 Jan to Mar 2011 to Quarter 4 Oct to Dec 2013, which allows them to be compared with the latest published annual estimates of total public service productivity. The following results are presented:
comparisons of the quarterly nowcast series to both the quality adjusted and non-quality adjusted annual series, to test both our assumption of constant quality in the nowcast period and the accuracy of the quarterly nowcast estimates
investigations into the seasonality and volatility of the quarterly nowcast series, inviting comments on the usefulness and potential smoothing of the quarterly series
extent of potential revisions to quarterly nowcast estimates of total public service productivity, as a result of revisions to the Quarterly National Accounts and deflators
4.1 Comparing annual and quarterly nowcast estimates
Figures 1 to 3 show the trend in the quarterly nowcast estimates of total public services based on Quarterly National Accounts data against the published annual estimates for productivity, output and inputs. Annual estimates are presented to show whether the quarterly nowcast series gives an accurate picture of the long-term trend, but cannot be used to assess the accuracy of the quarter on quarter change. A discussion of the potential quality of the within year changes in the quarterly series is provided in the following section on seasonal adjustment and volatility.
Both quality adjusted and non-quality adjusted annual estimates of output and productivity are shown, to test the impact of our assumption of no quality change in the period of the quarterly nowcast estimates. The similarity between the quality adjusted and non-quality adjusted annual series indicates that this assumption is reasonably robust and will not introduce a significant bias to the nowcast series.
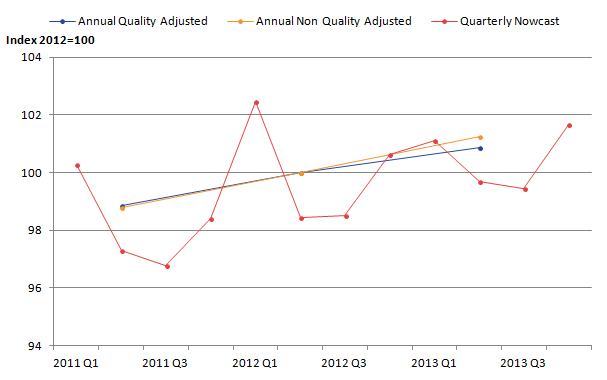
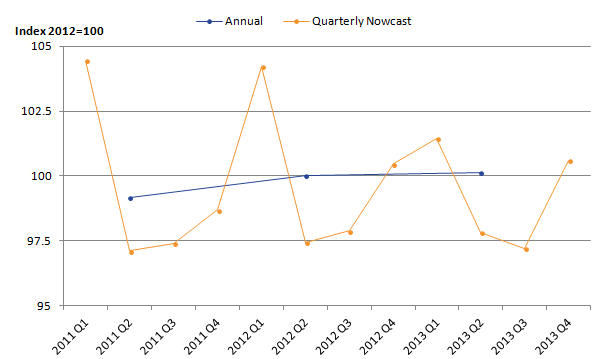
The quarterly nowcast productivity estimates in Figure 1 follow a broadly similar trend of rising productivity to the annual estimates, indicating that they provide a reasonably accurate picture of the more recent public service productivity trend. Differences between the annual and quarterly nowcast productivity estimates are a result of differences in the estimates of output and inputs shown in Figures 2 and 3. Quarterly nowcast estimates are more similar to annual total public service productivity estimates for outputs than for inputs. This is expected as the annual productivity estimates use output measures from the National Accounts Blue Book which are consistent with the Quarterly National Accounts (QNA) outputs volume measures, with some minor amendments such as the inclusion of direct output measures for further education. Differences between the inputs series are likely to come from 2 areas: the use of direct measures of labour inputs1 in some elements of the annual estimates and different deflators2 used to produce the volume estimates of inputs.
Figure 1: Indices of published annual and new quarterly nowcast estimates of total public service productivity, 2011 to 2013, non-seasonally adjusted, UK

Source: Office for National Statistics
Notes:
Published annual estimates are displayed in the second quarter of the year.
Download this image Figure 1: Indices of published annual and new quarterly nowcast estimates of total public service productivity, 2011 to 2013, non-seasonally adjusted, UK
.png (11.3 kB) .xlsx (9.2 kB)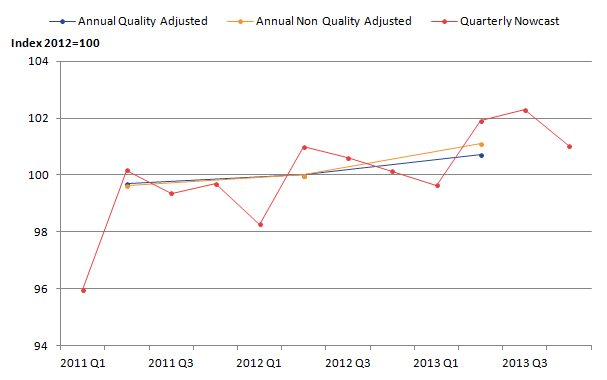
Figure 2: Indices of published annual and new quarterly nowcast estimates of total public service output, 2011 to 2013, non-seasonally adjusted, UK
Source: Office for National Statistics
Notes:
Published annual estimates are displayed in the second quarter of the year.
Download this image Figure 2: Indices of published annual and new quarterly nowcast estimates of total public service output, 2011 to 2013, non-seasonally adjusted, UK
.png (12.3 kB) .xlsx (9.2 kB)
Figure 3: Indices of published annual and new quarterly nowcast estimates of total public service inputs, 2011 to 2013, non-seasonally adjusted, UK
Source: Office for National Statistics
Download this image Figure 3: Indices of published annual and new quarterly nowcast estimates of total public service inputs, 2011 to 2013, non-seasonally adjusted, UK
.png (14.7 kB) .xlsx (9.1 kB)
4.2 Seasonal adjustment and volatility in the quarterly nowcast estimates
As there are no other quarterly public service productivity estimates against which to compare the quarterly nowcast series, it is not possible to assess the accuracy of the within year changes in the nowcast series. The quarterly nowcast estimates are naturally more volatile than the annual estimates, particularly when comparing quarter on quarter growth rates.
As the quarterly productivity series appears to exhibit some seasonality, tests were carried out to establish whether seasonality is contributing to the volatility of the quarterly series. Although the productivity, input and output series for total public services were not found to be directly seasonal, residual seasonality was found. Seasonality tests were also performed on individual services from which justice and fire productivity was found to be seasonal and both the current price expenditure and volume inputs for military defence3 are seasonal. Due to the residual seasonality, a seasonally adjusted (SA) total public service productivity series is estimated using 2 methods:
indirect method – using published SA values of total public service output volume and applying seasonal adjustment to the total public service input volumes, used to create a SA productivity series
direct method – using non-seasonally adjusted (NSA) values of total public service output and input volume to compile the NSA productivity series, which is then seasonally adjusted
Figure 4 compares the quarter on quarter growth rates in the NSA and SA quarterly nowcast total public service productivity series. The direct approach is methodologically more robust; however, as there is only residual seasonality in the inputs series there is no reason why the indirect method should not be used, so it may be preferred as it is slightly less volatile. Comments on which approach should be used are welcome.
Figure 4: Quarter on quarter growth rates of seasonally adjusted and non-seasonally adjusted new quarterly nowcast estimates of total public service productivity, Quarter 1 2011 to Quarter 4 2013
UK
Source: Office for National Statistics
Download this chart Figure 4: Quarter on quarter growth rates of seasonally adjusted and non-seasonally adjusted new quarterly nowcast estimates of total public service productivity, Quarter 1 2011 to Quarter 4 2013
Image .csv .xlsSeasonal adjustment reduces the volatility, but there is still volatility in the quarterly path of the seasonally adjusted nowcast estimates. To put this volatility in context, Figure 5 shows the quarter on quarter growth in both the current price and chained volume measure GGFCE series published in the quarterly national accounts4 which are the source data for the quarterly nowcast productivity estimates. The volatility in the published QNA data shows slightly more volatility than the quarterly nowcast productivity series.
Figure 5: Quarter on quarter growth rates of total public service QNA volume output and current price inputs, Quarter 1 2011 to Quarter 4 2013, seasonally adjusted
UK
Source: Office for National Statistics
Download this chart Figure 5: Quarter on quarter growth rates of total public service QNA volume output and current price inputs, Quarter 1 2011 to Quarter 4 2013, seasonally adjusted
Image .csv .xlsComments are requested on whether the quarterly series is useful. When considering this, it should be borne in mind that a large proportion of the activity data used to estimate the volume of output is annual data which has been converted to a quarterly series and local government expenditure data is on an annual basis split evenly among the 4 quarters. The technical annex provides a table showing which data sources are available on an annual or quarterly basis.
Figure 6 compares the quarter on quarter growth with 2 potential methods of smoothing the quarterly series:
- quarter on year – growth rates between one quarter and the same quarter in the previous year
- trailing average – growth rates smoothed using a moving average of 4 quarters
Other similar options which could be considered are a more sophisticated method of smoothing based in the trends in the series, or creating an annual series from the quarterly data by aggregating the quarterly series into complete calendar years. Comments are requested on whether an annual or smoothed series would be useful.
Figure 6: Comparing growth rates of new quarterly nowcast estimates of total public service productivity, Quarter 1 2011 to Quarter 4 2013, seasonally adjusted (indirect method)
UK
Source: Office for National Statistics
Download this chart Figure 6: Comparing growth rates of new quarterly nowcast estimates of total public service productivity, Quarter 1 2011 to Quarter 4 2013, seasonally adjusted (indirect method)
Image .csv .xls4.3 Revisions to public service productivity estimates
Quarterly National Accounts (QNA) are revised each quarter as more data becomes available and actual data replace estimates. The technical annex lists for Quarter 4 Oct to Dec 2015 when actual data for this quarter will be incorporated into QNA estimates of government output and expenditure. Figure 7 compares quarterly nowcast estimates of total public service productivity using 6 different QNA publications, to determine the potential size of revisions to the quarterly nowcast estimates due to source data revisions. With the exception of the earliest estimate from Quarter 1 Jan to Mar 2013, all the vintages of QNA data show the same trend in quarterly total public service productivity, so we do not expect to see large revisions to the quarterly nowcast series in terms of the long-term trend. More caution should be used in interpreting growth rates within the latest year, due to the amount of estimation used to produce the quarterly series.
Figure 7: Derived vintages of indices of quarterly nowcast total public service productivity, Quarter 1 2011 to Quarter 4 2013, non seasonally adjusted
UK
Source: Office for National Statistics
Download this chart Figure 7: Derived vintages of indices of quarterly nowcast total public service productivity, Quarter 1 2011 to Quarter 4 2013, non seasonally adjusted
Image .csv .xlsAnnual total public service productivity estimates are also subject to revision and have an open revisions policy, meaning that new data or methods can be incorporated at any time and will be implemented for the entire time series. Figure 8 compares the indices of total public service productivity from the last 4 published articles, which shows that the revisions to the quarterly nowcast estimates are within a similar magnitude of the revisions to the annual estimates. This again indicates that the revisions to the quarterly nowcast estimates are within an acceptable level, though comments on the level of revisions are welcome.
Figure 8: Indices of published annual total public service productivity showing revisions between consecutive published estimates, 1997 to 2012
UK
Source: Office for National Statistics
Download this chart Figure 8: Indices of published annual total public service productivity showing revisions between consecutive published estimates, 1997 to 2012
Image .csv .xlsNotes:
- For healthcare and education services in the annual estimates, labour inputs are measured directly using changes in the number of employees weighted using salaries.
- For example, annual estimates of adult social care labour inputs use the personal social services weighted pay index for local authorities covering adults, while the labour deflator for quarterly nowcast estimates of adult social care uses average weekly earnings for the public sector.
- Military defence is measured using the output = inputs convention, and so there is no productivity or volume output series for this service, meaning that seasonality of military defence does not contribute to seasonality of total public service productivity.
- Seasonally adjusted series of current price expenditure and volume output are published as part of QNA as series NMRP and NMRY respectively.
5. Next steps
This article presents a proposed method to produce more timely estimates of total public service productivity from the Quarterly National Accounts (QNA). These estimates represent the first step in developing this new method and provide the first quarterly estimates for total public service productivity.
Comparison with published annual estimates of total public service productivity show that this method produces quarterly nowcast estimates which follow a similar trend to the published estimates for historical series up to 2013. The quarterly series is naturally more volatile than the annual series and this volatility stems from volatility in the source data from the Quarterly National Accounts. Some volatility can be mitigated through application of seasonal adjustment.
We propose to publish Experimental Statistics using this method later this year, showing the quarterly total public service productivity estimates benchmarked to the latest published annual estimates of total public service productivity. Estimates will be published as part of the quarterly productivity bulletin, which brings together our different productivity estimates and will show estimates up to the quarter published in the latest QNA.
We acknowledge this is a first step and are keen to make improvements over the coming year. We are therefore keen to:
- discuss the methods and results presented in this article, particularly in relation to the usefulness and potential smoothing of the quarterly series
- receive feedback on our proposed investigations into presenting data for individual services and nowcasting of quality adjustments and to work with potential users in their development
Feedback is welcome at any time, but any received by the end of May will be particularly helpful in informing the first release of Experimental Statistics. Please send any comments or queries to sophie.danielis@ons.gov.uk.
Back to table of contents6. Technical Annex 1: Quarterly National Accounts
1. Introduction to Quarterly National Accounts
The Quarterly National Accounts (QNA) publication includes the third estimate of GDP and is published approximately 90 days after the end of the period. The Blue Book is the annual publication for the UK National Accounts and is usually published in July or October. The Blue Book includes data consistent with the QNA from the previous month and provides annual versions of the data in the QNA and more detail which is only available annually. For more information on National Accounts releases see A short guide to the UK National Accounts.
QNA and Blue Book include estimates of General Government Final Consumption Expenditure (GGFCE) which includes measures of government expenditure and activity which can be used to produce estimates of public service productivity as outlined in this article. More information on the process of compiling public sector expenditure data used in the National Accounts is available in the article Public Sector Finances, 2012: Sources and quality assurance procedures.
QNA are subject to revisions in accordance with the National Accounts revisions policy as further data, annual benchmarks and methodological improvements are implemented. Revisions are usually permitted as far back as the first quarter of the previous calendar year, for example, the December 2015 QNA publication for Quarter 3 July to Sep 2015 could include revisions as far back as the first quarter of 2014. Revisions are an inevitable consequence of the trade-off between timeliness and accuracy, as early estimates included in the QNA are based on incomplete data.
2. Government expenditure in QNA
For local government, expenditure data is primarily for financial years with some elements of quarterly data such as for consumption of fixed capital. Quarterly expenditure is derived by apportioning the annual spend equally between the quarters. For the current financial year, data is based on forecasted budgets provided by local authorities which are replaced by provisional outturn data for the majority of spending in September following the end of the financial year. Final outturn data is generally available for most countries by December following the end of the financial year. This means, taking Quarter 4 Oct to Dec 2015 as an example, estimates of local government expenditure will be based on forecasted budgets until approximately September 2016 and on final outturn data from around December 2016.
For central government, quarterly estimates are derived from monthly profiles of spending for the current financial year, though some departments report their expenditure in arrears. All expenditure data is subject to revision as more accurate returns are provided by departments as annual accounts are finalised throughout the following financial year.
3. Government output in QNA
Table 1 shows for estimates of government output, using Quarter 4 Oct to Dec 2015 as an example, when data for the latest quarter is incorporated in the QNA estimates and whether the estimates are based on quarterly or annual data.
Table 1: Availability of data for estimation of government output in Quarterly National Accounts
| Public Service Area | Data Frequency annual, quarterly or monthly | QNA release in which 2015 Q4 data are first incorporated |
| Health | Annual, quarterly or monthly | 2016 Q2 to 2016 Q4 |
| Education | Annual | 2015 Q4 to 2016 Q4 |
| Adult Social Care | Annual | 2016 Q3 |
| Children’s Social Care | Annual | 2016Q4 |
| Social Security Administration | Quarterly | 2016 Q2 |
| Prisons | Quarterly or monthly | 2015 Q4 to 2016 Q1 |
| Courts | Quarterly or monthly | 2016 Q1 |
| Probation | Quarterly | 2016 Q2 |
| Fire | Annual | 2016 Q4 |
| Source: Office for National Statistics | ||
| Notes: 1.In this table Q1 is Quarter 1 Jan to Mar, Q2 Quarter 2 Apr to June, Q3 Quarter 3 July to Sep and Q4 Quarter 4 Oct to Dec. | ||
Download this table Table 1: Availability of data for estimation of government output in Quarterly National Accounts
.xls (27.1 kB)For the period before data becomes available, estimates are generated through nowcasting, for the majority of services using a measure known as Holt Winters. Holt Winters is an automatic univariate forecasting measure (meaning it has only one explanatory variable, the historical series) which uses exponential smoothing to forecast data up to the latest quarter using weighted averages of past observed values. The weights decline exponentially which means that more recent data contributes more to the forecast results than older data points. The nowcasted values estimated using the Holt Winters method will be dependent on the level, gradient and seasonal components of the historical trend.
Back to table of contents7. Technical Annex 2: Quarterly deflators
To convert current price Gross Government Final Consumption Expenditure into the volume of inputs series needed to estimate public service productivity, suitable deflators were identified which were available on a quarterly basis. Deflators were identified for the 3 inputs components (labour, goods and services, and capital) and where possible for different services and for central and local government.
Table 2 lists the deflators used and provides a brief description.
Table 2: Quarterly inputs deflators
| Input component | Deflator | Description |
| Labour | Average weekly earnings | All services use one, or a weighted combination, of average weekly earnings indices for the public sector for industries: |
| O – Public Administration and Defence | ||
| P – Education | ||
| Q – Health and social care | ||
| The exception is defence which uses a specific defence labour deflator provided by the Ministry of Defence | ||
| Goods and services | Derived deflators | Combinations of Producer Price Indices (PPIs) and Service Producer Price Indices (SPPIs) for relevant products |
| Capital consumption | Implied deflator from Gross Fixed Capital Formation | Specific deflators for each capital asset (for example buildings, transport) are weighted together to produce a total public sector capital deflator which is applied to all services. |
| The exception is defence which uses a specific defence capital deflator provided by the Ministry of Defence | ||
| Source: Office for National Statistics | ||