1. Main points
These estimates are experimental using a degree of estimation to deliver more timely estimates, compared with our annual public service productivity figures, which are published with a 2-year lag. The methodology used in these estimates is explained in New nowcasting methods for more timely quarterly estimates of UK total public service productivity.
In Quarter 3 (July to Sept) 2016, productivity for total public services increased by 0.5% relative to the previous quarter. This followed on from a 0.3% decrease in Quarter 2 (Apr to June) 2016.
Comparing with the same quarter in the previous year, Quarter 3 2016 saw an increase in productivity of 0.5%.
In 2015, year-on-year productivity for total public services is estimated to have fallen by 0.3%, as year-on-year inputs growth (1.7%) exceeded output growth of 1.3%, leading to a drop in the ratio of output to inputs.
2. Understanding public service productivity
Productivity of public services is estimated by comparing growth in total output with growth in total inputs used. Productivity will increase when more output is being produced for each unit of input. Estimates of output, inputs and productivity are given both as growth rates between consecutive periods and as indices that show the cumulative trend over time.
Estimated growth rates of output and inputs for individual public services are aggregated by their relative share of total expenditure on public services (expenditure weight) to produce estimates of total public service output, inputs and productivity.
Inputs are composed of expenditure on labour, goods and services, and of consumption of fixed capital. They are adjusted for inflation using a suitable price index (deflator). Expenditure data used to estimate inputs growth are taken from the Quarterly National Accounts (QNA).
The QNA also provides estimates of government output based on direct measures where they are available and indirect measures where they are not. Direct measures use the number of activities performed and services delivered, which are weighted together using the relative cost of delivery. Indirect measures of services assume that the volume of output is equal to the volume of inputs used to create them. This means productivity growth will always be zero where indirect measures are used.
Further information on quality and methodology can be found in the Quality and Methodology Information paper, which describes the intended uses of the statistics presented in this release, their quality and a summary of the methods used to produce them.
Back to table of contents3. About quarterly public service productivity
We also produce annual estimates of total public service productivity and breakdowns of specific areas including healthcare, education and adult social care. These annual estimates are produced with a 2-year lag, which reduces their value in public sector planning.
This article presents experimental estimates for quarterly total public service productivity, inputs and output to provide a short-term, timely indicator of the future path of the annual total productivity estimates. Estimates are presented in annual growth rates up until 2015 and in quarterly growth up to Quarter 3 (July to Sept) 2016.
Annual estimates for 2015 are taken from annualised quarterly data and are comparable to the existing annual series over the period 1997 to 2014. Differences between the annual and quarterly “nowcast” public service productivity estimates are a result of differences in the estimates of output and inputs. This includes accounting for changes in service quality where we have, for now, assumed the quality of services provided remains constant throughout the nowcasted period. Further details of these differences can be found in New nowcasting methods for more timely quarterly estimates of UK total public service productivity.
Back to table of contents4. Quarterly public service productivity
In Quarter 3 (July to Sept) 2016, total public service productivity rose by 0.5% relative to the previous quarter. This followed on from a 0.3% decrease in Quarter 2 (Apr to June) 2016. Comparing with the same quarter in the previous year, Quarter 3 2016 saw an increase in productivity of 0.5%.
As shown in Figure 1, productivity was on a slight upwards trend from the start of 2011 until the end of 2014. Since then, productivity has been lower than in Quarter 4 (Oct to Dec) 2014.
Figure 1: Quarterly total UK public service productivity, Quarter 1 (Jan to Mar) 2011 to Quarter 3 (July to Sept) 2016, seasonally adjusted
Source: Office for National Statistics
Notes:
- All estimates are based on experimental quarterly total public service productivity.
- Estimates of productivity are indirectly seasonally adjusted, calculated using seasonally adjusted inputs and seasonally adjusted outputs.
- RHS stands for right-hand side.
- LHS stands for left-hand side.
Download this chart Figure 1: Quarterly total UK public service productivity, Quarter 1 (Jan to Mar) 2011 to Quarter 3 (July to Sept) 2016, seasonally adjusted
Image .csv .xlsBreaking down the productivity estimate into the underlying changes in inputs and output of total public services, Figure 2 shows that the latest rise in quarterly productivity was driven by a 0.5% decrease in inputs with output remaining flat. This meant there was an increase in the ratio of output to inputs, leading to an increase in productivity.
Figure 2: Quarterly total UK public service inputs and output, Quarter 1 (Jan to Mar) 2011 to Quarter 3 (July to Sept) 2016, seasonally adjusted

Source: Office for National Statistics
Notes:
- All estimates are based on experimental quarterly total public service productivity
- Estimates are seasonally adjusted.
- RHS stands for right-hand side.
- LHS stands for left-hand side.
Download this image Figure 2: Quarterly total UK public service inputs and output, Quarter 1 (Jan to Mar) 2011 to Quarter 3 (July to Sept) 2016, seasonally adjusted
.png (45.8 kB) .xlsx (11.6 kB)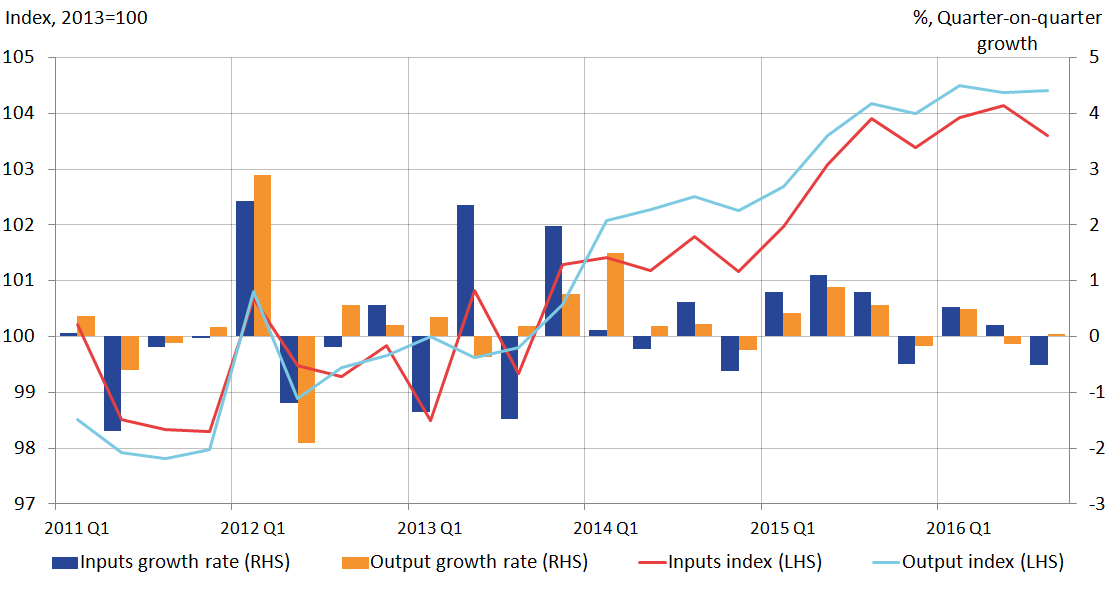
Trends in quarterly total public service output, inputs and productivity estimates are mostly determined by those service areas where quarterly data are readily available, for example, healthcare. A large proportion of activity data used to estimate the volume of output are annual data. This has subsequently been converted to a quarterly series – split evenly among the 4 quarters – reducing the impact these components have on volatility.
Further information on data sources for quarterly total public service productivity can be found in the Quality and Methodology Information paper and in New nowcasting methods for more timely quarterly estimates of UK total public service productivity. These articles highlight methods and caveats for producing the quarter-on-quarter growth estimates and they should be referenced when reporting on specific quarterly movements. This is especially the case for the latest quarters, which are more liable to be subject to revisions.
Back to table of contents5. Annual public service productivity
In 2015, total public service productivity is estimated to have fallen by 0.3% as inputs grew by 1.7%, exceeding output growth of 1.3%, based on these nowcast measures. This followed a productivity increase of 0.2% in 2014, with the output and inputs of total public services growing by 1.6% and 1.4% respectively, based on our existing annual series.
Figure 3 shows the annual total public service productivity series, with growth for 2015 taken from the quarterly nowcast series. It suggests that, while experiencing a contraction in the latest period, for the previous 5 years productivity of UK public services has been on an upwards trend. From 2010 to 2015, total public service productivity is estimated to have increased by 1.9% or an annual average 0.4% growth.
Figure 3: Total UK public service annual productivity with quarterly constructed estimate, 1997 to 2015

Source: Office for National Statistics
Notes:
- Estimates for 2015 reflect growth rates of the annualised quarterly total public service productivity applied to the quality-adjusted annual total public service productivity.
- RHS stands for right-hand side.
- LHS stands for left-hand side.
Download this image Figure 3: Total UK public service annual productivity with quarterly constructed estimate, 1997 to 2015
.png (30.1 kB) .xlsx (10.8 kB)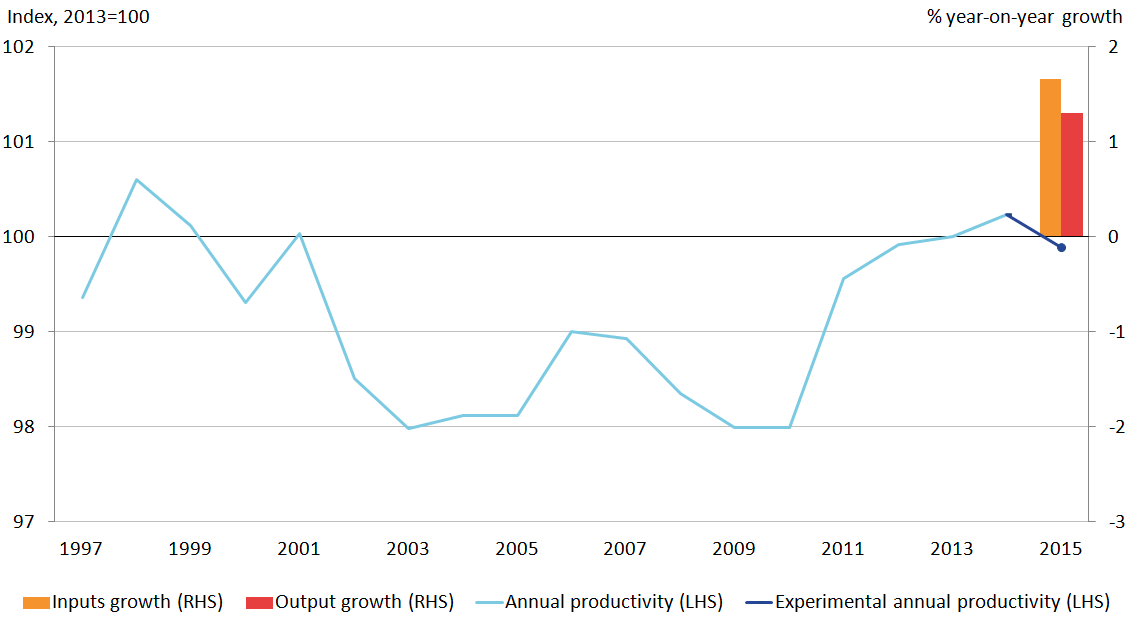
Productivity estimates between 1997 and 2014 have been revised since the previous publication due to changes in the annual public services productivity series. More information on these revisions and further analysis on annual total public service productivity prior to 2015, including the contribution of individual services, can found in Public service productivity estimates: total public service, 2014.
Back to table of contents6. Revisions
All estimates, by definition, are subject to statistical “error”, but in this context the word refers to the uncertainty inherent in any process or calculation that uses sampling, estimation or modelling. Most revisions reflect either the adoption of new statistical techniques, or the incorporation of new information which allows the statistical error of previous estimates to be reduced.
Public service productivity estimates operate an open revisions policy. This means that new data or methods can be incorporated at any time and will be implemented for the entire time series. As this article is produced using more timely data it involves a degree of estimation where data are incomplete.
Compared with the previous edition published on 6 October 2016, a number of revisions have been incorporated, including:
- revisions within the Quarterly National Accounts back to Quarter 1 (Jan to Mar) 2015
- use of alternative measures of price indices1
- revisions across the entire time series, as a result of the inclusion of additional transactions, which makes inputs more consistent with measures used in the annual public service productivity figures
These revisions mean that the fall in productivity in 2015 was less than previously estimated, revised upwards from negative 0.6% to negative 0.3%. This was as a result of decreased estimates for inputs, with inputs growth in 2015 revised downwards from 2.1% to 1.7%, although this was partially offset by output growth for 2015 being revised down from 1.5% to 1.3%.
Table 1 summarises the differences between previously published and the latest quarter-on-quarter and quarter on the same quarter a year ago estimates for inputs, output and productivity.
Table 1: Revisions to experimental quarterly total UK public service productivity, inputs and output, Quarter 1 (Jan to Mar) 2011 to Quarter 2 (Apr to June) 2016
| Percentage points | ||||||
| Inputs | Output | Productivity | Inputs | Output | Productivity | |
| Q-on-Q | Q-on-Q | Q-on-Q | Q-on-Q-a-year-ago | Q-on-Q-a-year-ago | Q-on-Q-a-year-ago | |
| 2011 Q1 | 0.5 | 0.0 | -0.5 | 0.5 | 0.0 | -0.5 |
| 2011 Q2 | 0.6 | 0.0 | -0.6 | 1.1 | 0.0 | -1.1 |
| 2011 Q3 | 0.2 | 0.0 | -0.2 | 1.2 | 0.0 | -1.2 |
| 2011 Q4 | 0.0 | 0.0 | -0.0 | 1.3 | 0.0 | -1.3 |
| 2012 Q1 | -0.2 | 0.0 | 0.2 | 0.7 | 0.0 | -0.7 |
| 2012 Q2 | -0.1 | 0.0 | 0.1 | 0.0 | 0.0 | -0.0 |
| 2012 Q3 | -0.0 | 0.0 | 0.0 | -0.2 | 0.0 | 0.2 |
| 2012 Q4 | 0.1 | 0.0 | -0.1 | -0.1 | 0.0 | 0.1 |
| 2013 Q1 | -0.1 | 0.0 | 0.1 | -0.0 | 0.0 | 0.0 |
| 2013 Q2 | -0.0 | 0.0 | 0.0 | 0.0 | 0.0 | -0.0 |
| 2013 Q3 | -0.4 | 0.0 | 0.4 | -0.3 | 0.0 | 0.3 |
| 2013 Q4 | 0.1 | 0.0 | -0.1 | -0.4 | 0.0 | 0.4 |
| 2014 Q1 | 0.0 | 0.0 | -0.0 | -0.3 | 0.0 | 0.3 |
| 2014 Q2 | -0.2 | 0.0 | 0.2 | -0.4 | 0.0 | 0.4 |
| 2014 Q3 | 0.4 | 0.0 | -0.4 | 0.4 | 0.0 | -0.4 |
| 2014 Q4 | 0.2 | 0.0 | -0.2 | 0.4 | 0.0 | -0.4 |
| 2015 Q1 | -0.3 | -0.0 | 0.3 | 0.1 | -0.0 | -0.1 |
| 2015 Q2 | -0.6 | -0.2 | 0.5 | -0.3 | -0.2 | 0.2 |
| 2015 Q3 | 0.2 | -0.1 | -0.2 | -0.6 | -0.2 | 0.3 |
| 2015 Q4 | -0.3 | -0.2 | 0.1 | -1.1 | -0.4 | 0.6 |
| 2016 Q1 | 0.1 | 0.0 | -0.1 | -0.6 | -0.3 | 0.2 |
| 2016 Q2 | 0.4 | -0.1 | -0.5 | 0.4 | -0.3 | -0.7 |
| Source: Office for National Statistics | ||||||
Download this table Table 1: Revisions to experimental quarterly total UK public service productivity, inputs and output, Quarter 1 (Jan to Mar) 2011 to Quarter 2 (Apr to June) 2016
.xls (29.2 kB)Table 1 shows changes to inputs across the entire time series. This is largely as a result of methodology changes for this article, to include additional transactions and take account of changes in the UK National Accounts.
For the majority of the time series, the impact of these methodology changes is minimal. However, we can observe that on average inputs were revised up in 2011 relative to the previous estimates, while in 2015 the increase in inputs was smaller compared with previous estimates. As a result, compared with previous estimates productivity growth in 2011 was lower and the decrease in productivity in 2015 was smaller relative to previous estimates.
These changes in the UK National Accounts were required under international standards and guidelines as a result of the implementation of European System of Accounts 2010 and are explained in detail in the publication Methodological Changes to National Accounts: Transition to ESA 2010 – Changes to treatment of Non-Market Output and Social Transfers in Kind. This brings our measure of inputs more in line to that used in the annual public services productivity estimates and consistent with the national accounts definition of government final consumption expenditure.
As well as this there are also revisions to inputs due to the use of alternative price indices and revisions within the Quarterly National Accounts (QNA). The only changes to the output series are in the most recent quarters, due to QNA revisions.
Notes for: Revisions
- Price indices used are still in line with those used within the methods paper (New nowcasting methods for more timely quarterly estimates of UK total public service productivity).
7. Future developments
This article presents updated experimental quarterly total public service productivity, inputs and output series, aiming to provide a more timely indicator of the likely trend in the existing annual series. These estimates are based on sources different from those used to estimate annual total public service productivity. The sources used here contain less detail and necessarily involve a greater degree of estimation than annual estimates produced later. As a result, they are not replacements for the annual estimates, and are merely intended to provide a more timely estimate for the more recent period. We aim to assess the impact of these differences and to address issues such as quality adjustment, direct measures, the treatment of annual data and the geographical and service level breakdown in future work.
Feedback on the use of these estimates and suggestions for improvements will be essential for the future development of timely estimates for public service productivity. All feedback is welcome and can be sent to sam.turnock@ons.gov.uk.
Back to table of contents8. Quality and methodology
The Quarterly public service productivity estimates: Total public services Quality and Methodology Information document contains important information on:
- the strengths and limitations of the data and how it compares with related data
- users and uses of the data
- how the output was created
- the quality of the output including the accuracy of the data
Contact details for this Article
Related publications
- Regional firm-level productivity analysis for the non-financial business economy: Jan 2017
- Public service productivity, healthcare, England: financial year ending 2022
- Volume index of UK capital services (experimental): estimates to Quarter 2 (Apr to Jun) 2017
- Labour productivity, UK: October to December 2019
- Productivity flash estimate and overview, UK: January to March 2026 and October to December 2025
- Subregional productivity in the UK: June 2023
- Management practices and productivity in British production and services industries - initial results from the Management and Expectations Survey: 2016