Table of contents
- Main points
- Statistician’s comment
- Things you need to know about this release
- UK population growth: UK population grows at same rate as last year
- UK population: balance between births and deaths at 14-year low, while international migration increases on 2017
- Ageing: number of over-65s continues to increase faster than the rest of the population
- England’s population continued to grow at a faster rate than the rest of the UK in mid-2018
- Local population change
- People tend to move to nearby areas and to more rural locations
- UK population in context: UK has third-highest population in the European Union
- You may also be interested in
- What has changed in this publication?
- Transformation of population statistics
- Quality and methodology
1. Main points
The population of the UK in mid-2018 was estimated to be 66,436,000.
The UK population grew by 0.6% between mid-2017 and mid-2018, the same rate of growth as in the previous year; growth in the years to mid-2017 and mid-2018 was slower than in any year since mid-2004.
In the year to mid-2018, there were fewer births (negative 2%) and more deaths (positive 3%) than in the last year; natural change was at its lowest since 2004.
Net international migration in the year to mid-2018 was 275,000, which was 6,000 higher than the average for the past five years and 45,000 higher than last year.
In the 12 months to mid-2018, the four local authorities with the fastest-growing populations were all in central London (City of London, Westminster, Camden and Tower Hamlets); the relatively high level of population growth in these areas is partly a reflection of the increase in net international migration between mid-2017 and mid-2018.
2. Statistician’s comment
“In the last two years, population growth in the UK has been at its lowest rate since 2004.
“For the fifth year in a row, net international migration was a bigger driver of population change than births and deaths.
“However, overall population change to the year mid-2018 has remained fairly stable as an increase in net international migration has been roughly matched by the fewest births in over a decade and the highest number of deaths since the turn of the century.”
Neil Park, Head of Population Estimates Unit, Office for National Statistics
Back to table of contents3. Things you need to know about this release
This release combines the first release of national and subnational population estimates for England and Wales for mid-2018 with those of Scotland and Northern Ireland to provide a picture of the UK population. This statistical bulletin also covers the mid-2018 internal migration estimates for England and Wales, previously covered in a separate bulletin.
Where possible the data accompanying this release are available for both local authorities in existence prior to April 2019 and those in place post-April 2019. These changes affect a small number of unitary and local authorities in Dorset, Somerset and Suffolk.
Back to table of contents4. UK population growth: UK population grows at same rate as last year
In mid-2018, the population of the UK was 66.4 million (66,435,550 with a confidence interval of plus or minus 0.2%). Over the year to mid-2018, the population of the UK increased by 0.6%, or 395,000 people, a very similar rate and amount of growth to that seen in mid-2017. Figure 1 shows this was the 36th consecutive year (since 1982) that the UK population increased in size.
Figure 1: UK population continues to grow, but at a slower rate than any year since 2004
UK, 1953 to 2018
Source: Office for National Statistics, National Records of Scotland, Northern Ireland Statistics and Research Agency – Population Estimates
Download this chart Figure 1: UK population continues to grow, but at a slower rate than any year since 2004
Image .csv .xlsFigure 1 shows that the current level of growth is higher than in 47 out of the past 65 years. While population growth in the year to mid-2018 was lower than the average since mid-2004 it was still higher than in any year between mid-1966 and mid-2003.
Back to table of contents5. UK population: balance between births and deaths at 14-year low, while international migration increases on 2017
In the year to mid-2018, international migration increased while there was a decrease in natural change in the population (the balance between births and deaths). Breaking this down further in the year to mid-2018 there were:
626,000 international immigrants, 54,000 more than the previous year (a 10% increase)
351,000 international emigrants, 9,000 more than the previous year (a 3% increase)
744,000 births, 18,000 fewer than the previous year (a 2% decrease)
623,000 deaths, 20,000 more than the previous year (a 3% increase)
For the fifth year in a row, net migration (275,000) was a bigger driver of population change than natural change (121,000; see Figure 2). However, population change over the last two years has remained stable as increasing net international migration has roughly matched increasing emigration and lower natural change.
Figure 2: In the 12 months to mid-2018 the UK population grew by a similar amount to mid-2017, despite the lowest natural change in 14 years
UK, 1992 to 2018
Source: Office for National Statistics, National Records of Scotland, Northern Ireland Statistics and Research Agency – Population Estimates
Notes:
Figures may not add exactly due to rounding.
Other changes include changes to the size of armed forces stationed in the UK and other special population adjustments; and is combined with net international migration for the purposes of this graph.
Download this chart Figure 2: In the 12 months to mid-2018 the UK population grew by a similar amount to mid-2017, despite the lowest natural change in 14 years
Image .csv .xlsFigure 2 shows the number of people being added to the UK population by natural change. The balance between births and deaths is currently at its lowest level since 2004, while net international migration is broadly in line with the average of the last five years.
Fewest births since 2006
The 744,000 births taking place in the year to mid-2018 are the fewest in any year since 2006. In mid-2012 the number of births peaked at 813,000 and have subsequently decreased by 69,000.
Fertility analysis is based largely on calendar year data, for example, Birth summary tables in England and Wales: 2017. The latest UK data in Vital statistics in the UK: births, deaths and marriages – 2018 update shows that in the calendar years 2012 to 2017, UK total fertility rates decreased from 1.92 children per woman to 1.74. However, the numbers of births are related to both the number of women of fertile ages as well as their levels of fertility.
Highest number of deaths in 18 years
There were 20,000 (3%) more deaths in the year to mid-2018 than in the previous year. The 623,000 deaths in the year to mid-2018 were the most since mid-2000. Since mid-2000, the population of the UK has grown by almost 7.5 million and there are 2.4 million more people aged 65 to 84 years and 489,000 more aged 85 years or over. Further analysis of mortality is available:
on a calendar year basis, from individual country deaths bulletins, for example, Deaths registered in England and Wales: 2017 and Excess winter mortality
as long-term trends for England and Wales, available in Causes of death over 100 years
as life expectancies, in the National life tables, UK: 2015 to 2017
in terms of the effects of deprivation, for example, in Health state life expectancies by national deprivation deciles, England and Wales: 2015 to 2017
Net international migration
The level of net international migration seen in the year to mid-2018 (275,000) was broadly in line with the average of the last five years (269,000). Over the last five years, net international migration has ranged between 183,000 and 336,000.
Analysis of the International Passenger Survey (IPS) data that form the basis of the international migration estimates in this release was first published in November 2018 in the Migration Statistics Quarterly Bulletin. It covers, for example, the different patterns for EU and non-EU migration.
Accounting for the indirect impact of international migration
In addition to the direct impact of migration on the size of the population, current and past international migration also has indirect effects on the size of the population as it changes the numbers of births and deaths in the UK. A fuller assessment of the indirect effect of migration on the size of the population would consider:
births to, and deaths of, people who had migrated to the UK
births to, and deaths of, people who emigrated from the UK (and who would have given birth, or died, in the UK had they not emigrated)
how to account for births to, and deaths of, UK-born people who had emigrated and subsequently returned to the UK
how to account for births to, and deaths of, UK-born people who had parents (or grandparents) who were themselves immigrants
Some additional information for England and Wales can be obtained in Parents’ country of birth 2017; this showed that in the calendar year 2017, of all births in England and Wales, 28.4% were to mothers born outside of the UK.
Other changes
The three main constituents of other changes are:
changes to the number of armed forces personnel and dependants stationed in the UK
changes to foreign armed forces based in the UK – mainly US Air Force personnel and dependants
changes to the prison population
These groups, often referred to as special populations, tend to have small effects on the national population but can have a larger impact at a local level. For example, while the prison population in England and Wales fell in the year to mid-2018, the prison population living in Wrexham increased, as prisoners have been transferred to the new HMP Berwyn.
In the year to mid-2018, the UK population decreased by 680 because of these changes, compared with increases in previous years. These changes reflect trends such as the slowing of the return of British armed forces based in Germany and the number of air force personnel and their dependants resident in England and Wales.
Back to table of contents6. Ageing: number of over-65s continues to increase faster than the rest of the population
The composition of the UK population is determined by the patterns of births, deaths and migration that have taken place in previous years. The result is that the broad age groups in the UK population are changing at different rates, with the number of those aged 65 years and over growing faster than those under 65 years of age:
the number of children (those aged up to 15 years) increased by 7.8% to 12.6 million between 2008 and 2018
the working age population (those aged 16 to 64 years) increased by 3.5% to 41.6 million between 2008 and 2018
number of people aged 65 to 84 years increased by 23.0% to 10.6 million between 2008 and 2018
the number of people aged 85 years and over increased by 22.8% to 1.6 million between 2008 and 2018
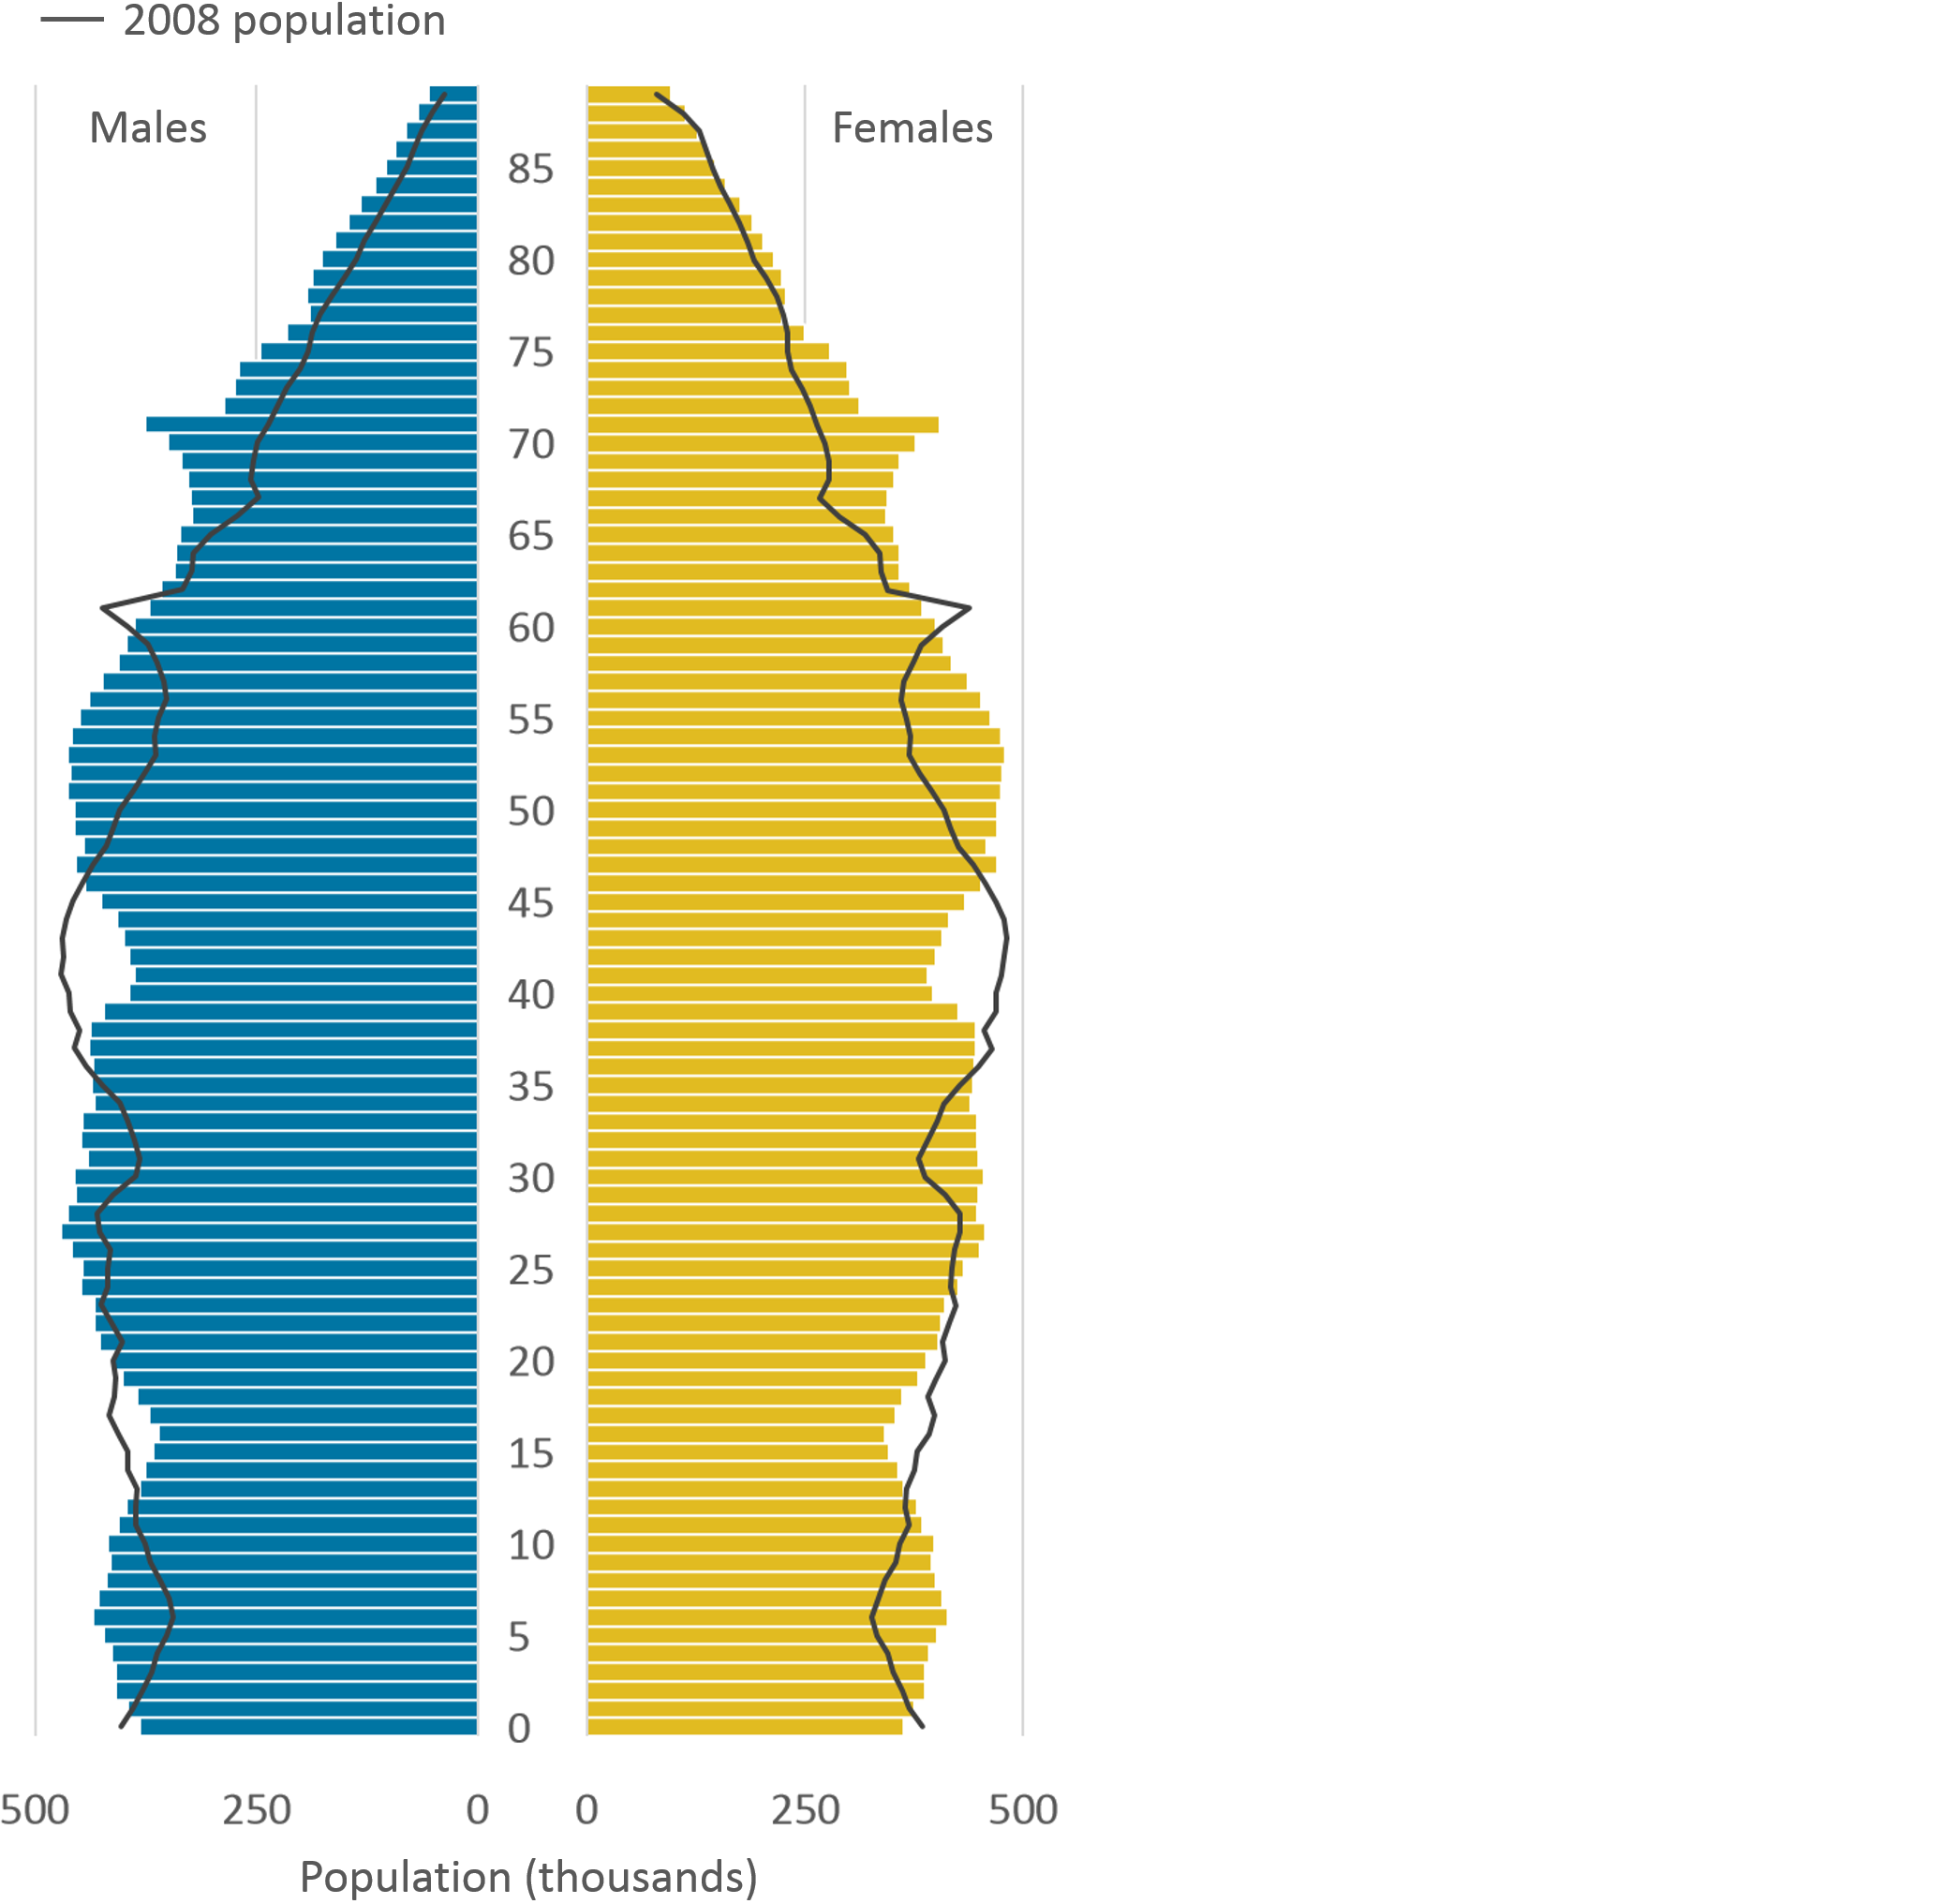
The population pyramid in Figure 3 compares the age structure of the population at mid-2018 and 10 years previously. The most visible change between 2008 and 2018 is the increase in population for those aged 65 years and over, reflecting the ageing of the UK population.
Figure 3: Population pyramid for the UK, mid-2018, single year of age 0 to 89
Source: Office for National Statistics, National Records of Scotland, Northern Ireland Statistics and Research Agency – Population Estimates
Download this image Figure 3: Population pyramid for the UK, mid-2018, single year of age 0 to 89
.png (264.8 kB) .xlsx (14.4 kB)
The effects of international immigration to the UK since mid-2008 are visible in the pyramid. For most ages, the peaks and troughs present in the pyramid in mid-2008 are visible in the mid-2018 data, shifted by 10 years. However, for the population aged 22 to 39 years in mid-2018, the pyramid is wider than for the same cohort 10 years previously (when they were aged 12 to 29 years). This change has been generated by net international migration adding to the population.
The population pyramid in Figure 4 is interactive, allowing you to compare the population structures of different areas and over time. This shows that the age structure of different parts of the UK can vary considerably.
For example, in Barking and Dagenham, 27% of the population were aged 0 to 15 years and 9% were aged 65 years and over, while in the newly-formed Dorset unitary authority, 16% of the population were aged 0 to 15 years and 29% were aged 65 years and over. An interactive pyramid that can be customised further is available as part of the Analysis of population estimates (APE) tool.
Figure 4: Interactive population
Embed code
7. England’s population continued to grow at a faster rate than the rest of the UK in mid-2018
Table 1 shows that, of the four countries of the UK, England’s population grew the fastest to mid-2018, over both a one-year period and a 10-year period.
| Population 2018 | Share of UK population | Increase on 2017 | Percentage change since 2017 | Percentage change since 2008 | |
|---|---|---|---|---|---|
| England | 55,977,000 | 84.3% | 358,000 | 0.64% | 8.0% |
| Wales | 3,139,000 | 4.7% | 14,000 | 0.43% | 3.7% |
| Scotland | 5,438,000 | 8.2% | 13,000 | 0.25% | 4.5% |
| Northern Ireland | 1,882,000 | 2.8% | 11,000 | 0.58% | 5.8% |
| UK | 66,436,000 | 100.0% | 396,000 | 0.60% | 7.5% |
Download this table Table 1: Population growth for UK countries, mid-2018
.xls .csvAs Table 1 shows, population growth in Scotland and Wales has been slower than in England and Northern Ireland. Some of the differences in growth rates are explained by differences in international and internal migration, but a large part of the variation can be explained by differences in natural change, the balance between births and deaths.
These differences are a reflection of the different age structures of the four countries and that younger populations tend to have more births and fewer deaths than older populations. Table MYE6 shows that in mid-2018, Northern Ireland had the youngest population of the four countries of the UK (median age of 38.7 years), followed by England, Scotland and then Wales (median ages of 39.9, 42.1 and 42.5 years respectively).
Figure 5 shows natural change per 100,000 people in each country in the UK since mid-2013. Natural change has been below zero for the last two years in Wales (negative 84 in mid-2018) and four years for Scotland (negative 141 in mid-2018) while it remains positive in Northern Ireland (358) and England (224). Figure 5 shows that natural change has been decreasing in all four countries of the UK in the recent past.
Figure 5: Scotland and Wales continue to have more deaths than births
UK constituent countries, mid-2013 to mid-2018
Source: Office for National Statistics, National Records of Scotland, Northern Ireland Statistics and Research Agency – Population Estimates
Download this chart Figure 5: Scotland and Wales continue to have more deaths than births
Image .csv .xlsNatural change in the UK in the year to mid-2018 was 121,000 – less than half the figure that occurred in the year to mid-2012 (254,000). A time series of natural change back to 1951 and an introduction to a wide range of our statistics on the UK population is available in the Overview of the UK population: November 2018. Section 10 suggests that this trend has been observed in many other EU countries, which as a whole have more deaths than births.
Back to table of contents8. Local population change
Changes in local populations can be driven by international migration, internal migration, births and deaths. The interactive maps in Figure 6 show the overall change in population and that caused by different components of change between mid-2017 and mid-2018 for each local authority in the UK.
To use this interactive tool select a local authority to view the population change and the components of change in the mid-2018 population estimates. Other changes (including changes in the numbers of armed forces and prisoners, also referred to as “special populations”) are included in the datasets that accompany this bulletin, but are not presented in Figure 6.
Figure 6: Map of population change mid-2017 to mid-2018 and main components of change, local authorities in UK
Embed code
A more conventional map of local authority boundaries is available from the Office for National Statistics geoportal site. The following text demonstrates examples of patterns that can be observed in the remaining components.
The four fastest-growing local authorities in mid-2018 were in central London
Using the local authority boundaries as of April 2019, the population grew in 337 local authorities in the year to mid-2018. This was the same as the proportion for the previous year; at 88% of local authorities this proportion was only slightly below the average for the previous five years:
the four fastest-growing local authorities can be seen on the cartogram as a cluster in central London, containing the City of London, Westminster, Camden and Tower Hamlets
a number of other local authorities with high population growth are spread across England with no clear pattern
a variety of trends can be seen in areas within each country; for example, in Scotland, areas in and around Edinburgh have consistently grown in the past five years (including Edinburgh City, Midlothian and East Lothian), whereas some councils in the West of Scotland and the Islands have experienced population decline over recent years
While many of the 45 authorities with decreasing populations in mid-2018 are on the coasts of England, Scotland and Wales, many local authorities situated inland also had decreasing populations. These are a mix of areas with older populations, areas with decreasing international migration and areas with decreasing special populations.
Northern Ireland and most London areas have more births than deaths
The younger age-structures of places like London and Northern Ireland tend to lead to higher numbers of births than deaths, resulting in relatively high levels of positive natural change. This can be seen in Figure 6.
However, the most notable pattern in the year to mid-2018 is that natural change was negative in many areas with older age structures, which tend to be coastal or rural areas, for example, in Dorset, Devon and Somerset. As shown by Figure 7 and Table MYE6, many have high median ages and are home to relatively high proportions of people aged 85 years and over.
Figure 7: Maps of population age structure by local authority area
Embed code
These maps, alongside Table MYE6, show that within the UK there are clear local differences in age structures. There are high proportions of children in Northern Ireland and many large urban areas such as the West Midlands, Central Lancashire and West Yorkshire. The pattern in London, however, differs, with a group of Inner London areas having lower than average proportions of children, and the rest of London and many areas where London commuters live having higher than average proportions.
Many of the fastest-growing authorities have high net international migration
Figure 6 shows a cluster of central London boroughs having the highest levels of net international migration in the year to mid-2018. It also shows a scattering of urban centres across England, Wales and Scotland with high international migration. These tend to have large student populations, such as Coventry, Newcastle-upon-Tyne and Oxford (these areas have high numbers of population aged 18 to 24 years and can be seen in Figure 7). However, the notable pattern from the map is that most of the UK has relatively similar levels of net international migration, as was the case in mid-2017.
Internal migration for London continues to be negative
There were 242 local authorities with more people moving in than out, of which 43 had a net inflow of over 10 people per 1,000. These were predominantly in the South East, South West and East of England.
In the year to mid-2018, there were 140 local authorities with more people moving out than in, of which 30 had a net outflow of more than 10 people per 1,000. Of these 31, there were 19 in London, with the rest predominantly in the south and east.
For the year to mid-2018, London as a whole had an overall net outflow of 11.7 per 1,000 people to other areas of England and Wales (Figure 8). As described in the 2017 mid-year estimates release, there is a distinctive age structure to these moves, with children (aged under 18 years) most likely to leave, followed by adults aged over 25 years. However, there was a net inflow among the 18 to 25 years population. Broadly this corresponds to families with children tending to leave London while young adults aged in their 20s tend to move to London.
Figure 8: London continues to see net outflow of residents to other parts of the UK
Embed code
Download this chart
Flows are expressed per 1,000 to allow comparison where population sizes differ.
In every region outside London, there was a net inflow of children and of adults aged 25 to 64 years. This was also true for the 65 years and over age group, except for very small net losses in the West Midlands and the North West.
There were large net outflows of 18 to 20-year-olds from the East of England. The South East also had large net outflows of 18 to 20-year-olds, but with smaller net outflows continuing for most of those aged in their 20s. The net flows for the other regions were much smaller.
Back to table of contents9. People tend to move to nearby areas and to more rural locations
Our internal migration estimates show that the most rural parts of England have net inward internal migration while the most urban parts have net outward internal migration.
In the year to mid-2018, the most rural local authorities gained an average of 9.5 people per 1,000 population and the most urban local authorities lost an average of 6.0 per 1,000. This is shown in Figure 9.
The 2011 Rural-Urban Classification of Local Authorities groups English local authorities into six categories, according to the extent to which the resident population live in urban, or in rural and rural-related settlements. The common factor within categories is the location of the population relative to the settlements, rather than the landscape or the physical use of the land.
The three most rural categories of local authority had positive net internal migration and two of the three categories of urban local authorities had net outflow. The category “Urban with minor conurbation” does not follow the trend; however, it is less stable as it only contains nine local authorities and 4% of the population.
Figure 9: Within England internal migration often involves moves to more rural areas and away from more urban areas
Embed code
Download this chart
Internal migration flows vary by age, with the most clear-cut pattern for those of student ages and those aged in their early 20s. For example:
net outflows amongst young adults are highest in the most rural areas, as many leave to study at universities, which are generally based in or near urban centres
as a consequence, local authorities in the “Urban with city and town” category, many of which have universities such as Oxford and York, have a strong inflow at these ages
aside from post-university net inflows, rural local authorities gain population from pre-school children and from adults aged in their 30s, with a smaller increase at older ages
other than an inflow for young adults aged 20 to 30 years, there is continuous net outflow in the most urban category (urban with major conurbation), most pronounced among pre-school children and adults aged in their 30s
The interactive map (Figure 10) shows that the internal migration generally occurs between neighbouring areas. As an example, for Bristol this shows that the three largest internal migration flows are with the local authorities that immediately surround it (South Gloucestershire, North Somerset, and Bath and North East Somerset). In addition, Figure 10 shows that many of the large migration flows between Bristol and local authorities in other regions of England and Wales are with areas with large higher education institutions (for example, Leeds, Manchester, Oxford, Reading).
By selecting a local authority of interest and hovering or clicking on the map to select another local authority, the interactive internal migration map in Figure 10 will show the flows to and from the pair of local authorities.
Figure 10: Most internal migration is to neighbouring local authorities
Embed code
10. UK population in context: UK has third-highest population in the European Union
Population estimates for calendar years rather than mid-years are produced and supplied to Eurostat (the European Statistics Agency) by each member of the EU. These allow comparisons of the populations of European countries to be made. Figure 11 shows how the populations of selected EU countries have changed over the past five years and one year.
Figure 11: UK growth in 2017 and in previous five years is faster than that of EU as a whole
Source: Eurostat – Demographic balance and crude rates at national level
Download this chart Figure 11: UK growth in 2017 and in previous five years is faster than that of EU as a whole
Image .csv .xlsFigure 11 shows that UK growth in the calendar year 2017, at 0.65%, was more than three times that of the whole EU (0.20%), or five times that of the EU without the UK (0.13%). The UK in 2017 formed an eighth of the whole population of the EU (12.9%).
Eurostat’s article analysing these data Population and population change statistics, notes that Ireland had the highest natural change of all EU countries, that is, more births than deaths. However, 14 EU countries had more deaths than births, as did the EU as a whole.
Further information on EU citizens living in the UK population is available in Population of the UK by country of birth and nationality: 2018.
Back to table of contents11. You may also be interested in
There are a number of ways to obtain population estimates data:
for a simple population estimate – see the latest datasets accompanying this release
to extract population totals by specific ages, places and years – you may wish to use NOMIS or the Office for National Statistics’s customise your data
to explore component of change – the Analysis of population estimates tool provides tables and graphs back to mid-2011
to quantify the quality of the estimates – please see the quality tools and uncertainty measures
It is possible to aggregate local authorities up to other geographies, including:
combined authorities, for example, Liverpool City Region
police force areas (which typically correspond to counties or pairs of counties)
NUTS areas, used for European research and funding
However, it is not possible to produce estimates for national parks or a complete set of clinical commissioning groups (CCGs) until small area population estimates become available in the autumn. Populations for major towns and cities are also available from this source.
The mid-year population estimates are essential building blocks for a wide range of National Statistics. Table 2 illustrates the wide variety of related products and a number of tables and online sources for obtaining population estimates data.
Table 2: Where to find data on...
| UK mid-year pop estimates – in more detail | Local authority single-year of age estimates | Interactive population pyramids, or Tables MYE2 and MYEB2 |
| Time series data | Table MYEB2 or NOMIS | |
| Previous mid-year estimates series | ONS archive website | |
| Components of population change for local authorities | Tables MYE3 and MYEB2 | |
| Other local authority-based geographies | Regions and counties are available in Tables MYE2, 3, 5 and 6; others can be obtained via the open geography portal | |
| Small areas and geographies built from them -– clinical commissioning groups, Parliamentary constituencies, national parks | Small area population estimates or NOMIS | |
| Similar data – but not UK mid-year population estimates | Median ages | Table MYE 6 |
| Population density | Table MYE 5 | |
| Census estimates | 2011 Census – UK local authority statistics | |
| Forward in time – population projections | National population projections table of contents; English subnational population projections | |
| Going beyond age 90 years – estimates of the very old | ONS ageing statistics | |
| Calendar year population estimates | Eurostat | |
| Population registered to vote | Electoral statistics for the UK | |
| Families | Families and households in the UK | |
| Specific countries or themes | Wales’s population estimates | Welsh Government |
| Scotland’s population estimates | National Records of Scotland | |
| Northern Ireland’s population estimates | Northern Ireland Statistics and Research Agency | |
| Births | Available for England and Wales, Scotland and Northern Ireland | |
| Deaths | Available for England and Wales, Scotland and Northern Ireland | |
| Internal migration | Internal migration tables | |
| International migration | Migration Statistics Quarterly Report, Local area migration indicators, UK | |
| Characteristics of the population | Population of the UK by country of birth and nationality Population estimates by marital status and living arrangements, England and Wales |
A number of key indicators covering the UK economy and international migration are already available until mid-2018. Many of them have been presented together in the What's changed since the Brexit vote? article.
Back to table of contents12. What has changed in this publication?
An important recent change is that these bulletins combine commentary formerly published separately as Internal migration, England and Wales and Population estimates for UK, England and Wales, Scotland and Northern Ireland. This reflects the importance of internal migration as a component of the population estimates and the benefits of using the two publications together.
Further changes compared with last year’s releases include:
immigration has been estimated using the latest data; mid-2017 estimates are based on an alternative method using average geographical distributions
where publication tables contain local authority data, two versions are available using both the new amalgamated local authorities and the pre-April 2019 ones
new issues that might affect mid-year population estimates have been documented in the QMI report, covering potential under-estimation of the proportion of emigrants that are children, and issues with the estimates of EU student immigration
Methods applied this year are described in the Methodology guide for mid-2018 UK population estimates (England and Wales). We welcome your comments on the usefulness and presentation of the population estimates in this release. Please contact the population estimates team using the email address pop.info@ons.gov.uk
Back to table of contents13. Transformation of population statistics
It is our mission to provide the best insights on population and migration using a range of new and existing data sources to meet the needs of our users.
We have set ambitious targets to put administrative data at the core of our evidence on international migration and population by 2020 and will deliver a predominantly online census in 2021. The ambition is to deliver a fully transformed system for producing population and migration statistics by 2023.
We will iteratively develop our transformed population and migration statistics system, taking on board feedback from users and making the best use of new data and new methods as they become available. We will rigorously quality assure new methods and share the impact of any changes made, demonstrating the benefits and improvements before implementing them.
We will say more about our plans for the mid-2019 population estimates later in 2019, when we plan to publish an article setting our design for putting administrative data at the core of population and migration statistics in 2020.
The Transformation of the population and migration statistics system: overview gives more information on this work.
The mid-year population estimates continue to remain the official population estimates for England and Wales, carrying the National Statistics accreditation. Benefits delivered from ongoing administrative data research will be used to better understand the current population estimates process and drive potential improvements wherever possible.
Back to table of contents14. Quality and methodology
The Population estimates Quality and Methodology Information report and Internal migration Quality and Methodology Information report contain important information on:
the strengths and limitations of the data and how it compares with related data
uses and users of the data
how the output was created
the quality of the output including the accuracy of the data
Methods guides, which detail the data sources and methodology used to produce the mid-year population estimates are available for the UK countries:
England and Wales Methodology Guide for mid-2018 UK Population Estimates (England and Wales)
Northern Ireland Methodology Report (PDF, 135KB)
Scotland Mid-Year Population Estimates for Scotland: Methodology Guide 2018
Internal migration refers to the movement of people across administrative boundaries within England and Wales. Estimates of internal migration moves for areas within Northern Ireland are produced by the Northern Ireland Statistics and Research Agency (NISRA); estimates of internal migration moves for areas within Scotland are produced by National Records of Scotland (NRS). A comparison of the Office for National Statistics’s (ONS’s), NISRA’s and NRS’s methods is available.
Revisions policies for population statistics include the mid-year estimates. It explains how revisions to statistics are categorised and implemented by the ONS, including revisions following a census.
Mid-year population estimates relate to the usually resident population. They account for long-term international migrants but not for short-term. This approach is consistent with the standard UN definition for population estimates, which is based upon the concept of usual residence and includes people who reside, or intend to reside, in the country for at least 12 months, whatever their nationality. Short-Term International Migration for England and Wales: year ending June 2017 provides data on an additional 3.1 million short-term visitors.
These are the official population estimates for the UK as at 30 June 2018 and therefore reflect the size of the usually-resident UK population two years on from the EU referendum (23 June 2016). A future release will provide a snapshot of the UK population before EU exit itself occurs.
Mid-year population estimates are compiled to provide information about the size of the population and how it changes over time. This information is used for planning services, managing the economy and in the calculation of rates where a population denominator is required, such as social and economic indicators.
Measures of statistical uncertainty are available for the year’s mid-2012 to mid-2016 (note these reflect the international emigration methods used prior to the March 2018 revised series of population estimates).
Back to table of contents