1. Main points
There were an estimated 2.85 million residents moving between local authorities in England and Wales between July 2014 and June 2015. This is the same level shown in the previous 12-month period.
There were 53,200 moves from England and Wales to Northern Ireland and Scotland, compared with 45,600 from Northern Ireland and Scotland to England and Wales. This means there was a net internal migration loss for England and Wales of 7,600 people.
For the total number of internal migration moves the sex ratio is fairly neutral; in the year to June 2015, 1.4 million (48%) of moves were males and 1.5 million (52%) were females.
Young adults were most likely to move, with the biggest single peak (those aged 19) reflecting moves to start higher education.
Of the English regions, London had the highest rate of internal migration net outflow (9.1 per 1,000 residents as at mid-2014). The region with the highest rate of internal migration net inflow was the South West (5.5 per 1,000 residents as at mid-2014).
Back to table of contents2. Things you need to know
This bulletin summarises total moves, moves by age, moves by sex and moves by area.
Internal migration is defined as residential moves between local authorities and regions in England and Wales, as well as moves to or from the rest of the UK (Scotland and Northern Ireland). It excludes moves within a single local authority, as well as international moves into or out of the UK.
These internal migration statistics exclude some moves into and out of the armed forces and prisoners, which are predominantly men.
Figures for total flows across the borders of England and Wales (either to or from Scotland and Northern Ireland) are agreed with National Records of Scotland (NRS) and the Northern Ireland Statistics and Research Agency (NISRA) respectively. This is because the figures are adjusted to take account of differing methods in the respective countries.
Age of internal migrants is based on age at mid-2015 (specifically 30 June) rather than age at date of move – this enables the statistics to integrate with our mid-year population estimates. This provides an approximation of what percentage of people move at each age.
The move totals in the bulletin text are rounded to the nearest hundred. The underlying data tables contain unrounded figures
The statistics are based on a combination of several administrative datasets and represent the best available source of information on internal migration. Over time data sources change and new data sources become available. We are researching improvements to the current methods and intend to introduce them in 2018. Our internal migration methodology page has further information on how our internal migration estimates meet your needs along with information on the data sources, methods and their fitness for purpose, including strengths and limitations.
The statistics have a wide range of uses across central and local government, as well as academia and business:
the Office for National Statistics (ONS) use these data in population estimates and projections
central government uses them to inform policy-making and resource allocation to local authorities, who in turn use the statistics to help estimate the demands on their services – for example, the number of school places required
clinical commissioning groups use them to help forecast requirements for health services, particularly for maternity and geriatric services
various universities research internal migration: for example the University of Leeds, the University of Manchester and Newcastle University
providers of services across the public and private sectors: for example, housing associations, developers and utility companies may use internal migration statistics to predict demand for their respective services in their area
the media may use them to inform articles and debate on migration and related topics
3. Tell us what you think
This publication is intended to meet your needs and provide an interesting summary of the main messages in the data. But are we achieving this? If you have any comments on what you like, what you don’t like, or what we could do differently, please let us know at: migstatsunit@ons.gov.uk.
Back to table of contents4. Moves between local authorities in England and Wales
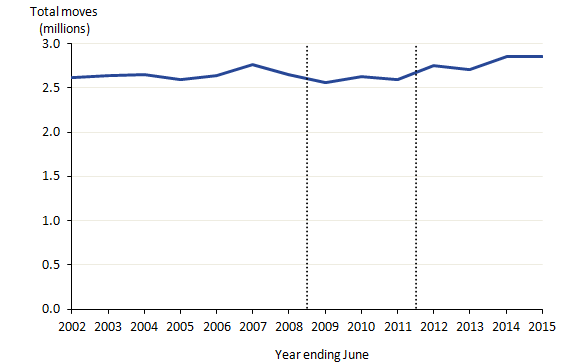
In the 12-month period between July 2014 and June 2015, there were an estimated 2.85 million residential moves between local authorities in England and Wales. This is the same level shown in the previous 12-month period.
Figure 1: Total moves between local authorities in England and Wales, years ending June 2002 to June 2015
Source: Office for National Statistics
Notes:
- The black dotted lines indicate methodological changes, information on which can be found in the internal migration estimates methodology document.
Download this image Figure 1: Total moves between local authorities in England and Wales, years ending June 2002 to June 2015
.png (7.7 kB) .xls (53.8 kB)
5. Cross-border moves
Cross-border moves are those where people move, in either direction, between England and Wales (combined) and Scotland and Northern Ireland.
Figure 2a: Cross-border moves to and from Scotland by age, year ending June 2015
Source: Office for National Statistics
Download this chart Figure 2a: Cross-border moves to and from Scotland by age, year ending June 2015
Image .csv .xls
Figure 2b: Cross-border moves to and from Northern Ireland by age, year ending June 2015
Source: Office for National Statistics
Download this chart Figure 2b: Cross-border moves to and from Northern Ireland by age, year ending June 2015
Image .csv .xlsNet cross-border moves refer to the difference between flows from England and Wales into Scotland and Northern Ireland and the flows from Scotland and Northern Ireland into England and Wales. In the year ending June 2015, the net number of cross-border moves was -7,600 (meaning more moves took place out of England and Wales than into England and Wales). This is a change compared with the net flow from the previous 12-month period (-8,900). Flow levels are largest for residents aged 20 to 29. This trend is consistent with the age characteristics of movers within England and Wales (section 6).
Estimates of internal migration moves for areas within Northern Ireland are produced by the Northern Ireland Statistics and Research Agency (NISRA); please visit the NISRA website for more information. Estimates of internal migration moves for areas within Scotland are produced by National Records of Scotland (NRS); for more information please visit the NRS website. A comparison of ONS’s, NISRA’s and NRS’s methods is available.
Back to table of contents6. Characteristics of movers
In this section we look at internal migration in the year ending June 2015 by age, sex and area.
6.1 Age
Figure 3: Moves into local authorities in England and Wales (including moves from Northern Ireland and Scotland), year ending June 2015, as a proportion of the mid-2015 population estimates
Source: Office for National Statistics
Notes:
- Age of internal migrants is based on age at mid-2015 (specifically 30 June) rather than age at date of move – this enables the statistics to integrate with our mid-year population estimates. This provides an approximation of what percentage of people moved at each age. However, the percentages will not be exact because:
many people’s age at mid-2015 will have been 1 year older than when they moved. This will have had particular impact at age 0 (approximately half of people who moved aged 0 will have been aged 1 by mid-2015) and at student ages.
some people will have moved more than once during the year.
some people will have moved during the year, but no longer live in England and Wales by the end of the year, either because they have moved elsewhere or died. These people will be included in the internal migration data but not in the population estimates.
Download this chart Figure 3: Moves into local authorities in England and Wales (including moves from Northern Ireland and Scotland), year ending June 2015, as a proportion of the mid-2015 population estimates
Image .csv .xlsFigure 3 shows a comparatively high likelihood of moving for very young children. Part of this may be simply because their parents are at an age where moving is still common. The addition of children to a family may also lead to a move, however, once children are at school moves are much less common, potentially because of the disruption it would cause the children as well as the parents who may be at an age where they’re settled into their career.
It is in early adulthood where most moves occur, with the peak age for moves being 19, the main age at which people leave home for study. There is another smaller peak at age 22; in many cases this will reflect graduates moving for employment, further study, returning to their home address or moving in with a partner.
Levels of movement remain comparatively high through those aged in their 20s and 30s but gradually decline with age. This may reflect people becoming more settled in their employment, in an area or in relationships, as well as because they have school-age children.
However, from those aged in their late 70s onwards, the proportion of people moving rises slightly. There are many reasons why people of this age may wish to move, including being closer to their family, downsizing, or to access support and care.
Figure 4 shows how the latest data have changed in percentage terms compared with the previous 12-month period. The largest increase is at age 68 (an increase of 28% (3,000 moves), due partly because of the large increase in the total number of 68 year-olds in the UK (up 178,000 from the previous 12-month period) as people born in the baby boom following the Second World War reach that age.
Figure 4: Percentage change in internal migration moves (including moves from Northern Ireland and Scotland) by age, year ending June 2015 compared with year ending June 2014
Source: Office for National Statistics
Notes:
- “Age” is age at mid-2015.
Download this chart Figure 4: Percentage change in internal migration moves (including moves from Northern Ireland and Scotland) by age, year ending June 2015 compared with year ending June 2014
Image .csv .xls6.2 Sex and comparison with population
Another way of considering the age and sex profile of internal migrants is to consider how it compares with the age and sex profile of the general population. For the total number of internal migration moves the sex ratio is fairly neutral; in the year to June 2015 around 1.4 million (48%) of moves were by males and 1.5 million (52%) were by females.
Figure 5: Population pyramids showing movers into local authorities in England and Wales (including moves from Northern Ireland and Scotland), year ending June 2015, and the total population of England and Wales, mid-2015

Source: Office for National Statistics
Notes:
- Ages of 90 and above are combined into a single “90” category.
- “Age” is age at mid-2015.
Download this image Figure 5: Population pyramids showing movers into local authorities in England and Wales (including moves from Northern Ireland and Scotland), year ending June 2015, and the total population of England and Wales, mid-2015
.png (37.6 kB) .xls (178.2 kB)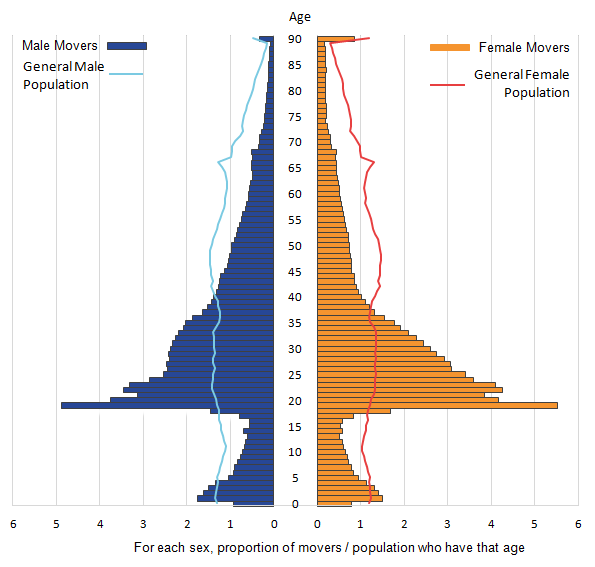
If the solid pyramid is wider than the outline pyramid, people at that age had a higher propensity to move. This applies to very young children and adults aged between 19 and the late 30s. For all other ages the outline pyramid is wider than the solid pyramid, these people have a lower propensity to move.
Figure 5 also shows that among older people there were more female movers than male movers – in fact 67% of movers aged 80 or over (and 75% of movers aged over 90) were female. This reflects the fact that 61% of the UK population aged 80 and over (71% aged 90 and over) is female and is likely to be enhanced by the higher likelihood of females to be widowed.
Back to table of contents7. Area
The following comparisons consider internal migration at regional and local authority level. There are several other factors which will influence total population change in an area, including births, deaths and international migration. This means that total population change will not necessarily be in the same direction as net internal migration. Information on total population change in the year ending June 2015 is available in the mid-2015 population estimates publication.
7.1 Region
Figure 6 and Table 1 show that the 2 regions with the highest numbers of moves in and moves out are London and the South East. These regions also have the largest population and by comparing net moves per thousand population we can take account of the effect of population size. The main messages are:
regions in the south of England had greater net change than regions in the north of England during the year ending June 2015
except for London, regions in eastern and southern England had a positive net internal migration flow; the region with the highest rate of net migration inflow was the South West (net of 5.5 moves in per 1,000 mid-2014 population)
the North East had the smallest inflows and outflows with an absolute net change of -0.2 thousand (indicating a net rate per thousand population of -0.1)
London had significantly the largest rate of net internal migration flow and also the largest net change in relation to population size (net of 9.1 moves out per 1,000 mid-2014 population)
Previous years’ internal migration estimates show that this general pattern of a large net outflow from London and a large net inflow to other parts of southern and eastern England has existed for a number of years.
Figure 6: Internal migration moves (including cross-border moves), year ending June 2015, for the regions of England and the country of Wales
Source: Office for National Statistics
Notes:
- Totals may not sum due to rounding.
- Aggregating figures: Regional netflows may be added together but not regional inflows and outflows, as the totals will include moves between those regions. If you require such totals you are advised to derive them from our matrix of interregional flows.
Download this chart Figure 6: Internal migration moves (including cross-border moves), year ending June 2015, for the regions of England and the country of Wales
Image .csv .xls
Table 1: Internal migration moves (including cross-border moves), year ending June 2015 and mid-2014 population estimates, for the regions of England and the country of Wales
| Area | Mid-2014 population (thousands) | Net moves per thousand population |
| South West | 5,423.3 | 5.5 |
| East of England | 6,018.4 | 2.4 |
| East Midlands | 4,637.4 | 2.0 |
| South East | 8,873.8 | 1.8 |
| North West | 7,133.0 | 0.5 |
| Wales | 3,092.0 | 0.3 |
| North East | 2,618.7 | -0.1 |
| West Midlands | 5,713.3 | -0.4 |
| Yorkshire and The Humber | 5,360.0 | -0.4 |
| London | 8,538.7 | -9.1 |
| Source: Office for National Statistics | ||
Download this table Table 1: Internal migration moves (including cross-border moves), year ending June 2015 and mid-2014 population estimates, for the regions of England and the country of Wales
.xls (26.1 kB)Table 1 shows the number of internal migration moves into and out of the regions of England and Wales (including moves to or from Northern Ireland or Scotland) in the year ending June 2015. The table is presented in order of net moves per thousand mid-2014 population. The mid-2014 population is used because it is the starting point of the year ending June 2015.
7.2 Local Authority
Embed code
Embed code
In total there were 216 local authorities with more people moving in than out, of which 85 had a net inflow of more than 5 per 1,000 population (mid-2014). Most of those are in regions that also had a higher net inflow: South West, East of England, South East and East Midlands. However, some local authorities in all of these regions experienced a net outflow, demonstrating that there is considerable within-region variation.
Conversely, there were 132 local authorities with more people moving out than in, of which 43 had a net outflow of more than 5 per 1,000 population (mid-2014). London had a particular concentration of local authorities with high net outflows, reflecting the high net outflow for the London region overall. An important explanation for this is that many parents with young children move out of London. London is also the most common region of first residence for international migrants to the UK and some of these may later move to other regions, potentially also with children. Similar factors may also contribute to the high net outflows from many provincial cities.
Back to table of contents8. International comparisons
Making international comparisons of internal migration statistics is not straightforward. Complications include:
different data sources for creating internal migration statistics, which may also have different levels of quality
different frequencies of production: UK statistics are available on an annual basis, but this is not true for all countries
different definitions of what constitutes internal migration
different geographic structures and sizes of geographic areas; in theory 2 countries could have the same number of people changing address but have differing internal migration totals because one country has larger regions or local authorities than the other
However, Bell et al (2015) have developed “national migration intensities”, which are intended to provide reasonably comparable estimates of levels of internal migration levels in different countries. These suggest that there is considerable variation around the globe but that the intensity in the UK, although fairly high, is lower than in countries in North America, Oceania and Scandinavia. Countries in Asia, Central America, and southern and eastern Europe typically have lower migration intensities, while the picture in Africa and South America is varied.
Back to table of contents9. Where can I find more information?
This statistical bulletin is part of our Internal Migration by Local Authorities in England and Wales, Year Ending June 2015 publication. The publication includes:
detailed internal migration moves dataset; this provides information on moves between every pair of local authorities by age and sex, allowing you to do your own detailed analysis
square matrices showing the total number of moves between each region and each local authority; as well as the 9 English regions, the regional matrix includes the other 3 UK countries: Northern Ireland, Scotland and Wales
tables of total inflows, outflows and netflows for each region and local authority (total flows for the country of Wales are included in the regional table)
table of inflows and outflows for each region and local authority by sex and 5-year age group (flows for the country of Wales are included in the regional table)
table of all moves by age and sex
Internal Migration Questions and Answers, year ending June 2015
The mid-2015 population estimates publication contains an analysis tool which includes internal migration inflows, outflows and netflows for each local authority, broken down by sex and single year of age up to 90 and over. The publication also contains country, region, county and local authority internal migration inflows, outflows and netflows; these are in Table MYE3.
Back to table of contents