Table of contents
- Main points
- Statistician’s comment
- Things you need to know about this release
- Excess winter deaths in 2017 to 2018 are the highest recorded since the winter of 1975 to 1976
- Pronounced increase in mortality over the winter months
- Females and the elderly were most affected by excess winter mortality
- Respiratory disease caused most excess winter deaths
- Predominant strain of influenza in winter 2017 to 2018 impacted the elderly the most
- Relationship between excess winter mortality and temperature is complex
- Excess winter mortality significantly increased in all regions of England and in Wales in 2017 to 2018
- What causes excess winter mortality?
- Links to related statistics
- Quality and methodology
1. Main points
In the 2017 to 2018 winter period, there were an estimated 50,100 excess winter deaths in England and Wales.
The number of excess winter deaths in 2017 to 2018 was the highest recorded since winter 1975 to 1976.
During the winter months of 2017 to 2018, the number of daily deaths exceeded the daily five-year average for all days except 25 March.
Excess winter mortality in 2017 to 2018 significantly increased from 2016 to 2017 in all English regions and Wales, with Wales having the highest regional index.
Excess winter mortality continued to be highest in females and people aged 85 and over.
Excess winter mortality doubled among males aged 0 to 64 years between 2016 to 2017 and 2017 to 2018.
Over one-third (34.7%) of all excess winter deaths were caused by respiratory diseases.
2. Statistician’s comment
“The number of excess winter deaths in England and Wales in 2017 to 2018 was the highest recorded since the winter of 1975 to 1976. However, peaks like these are not unusual – we have seen more than eight peaks during the last 40 years. It is likely that last winter’s increase was due to the predominant strain of flu, the effectiveness of the influenza vaccine and below-average winter temperatures”.
Nick Stripe, Health Analysis and Life Events, Office for National Statistics
Back to table of contents3. Things you need to know about this release
In common with other countries, more people die in the winter than in the summer in England and Wales. This statistical bulletin presents provisional figures for excess winter deaths (EWD) and the excess winter mortality (EWM) index in England and Wales for the winter period 2017 to 2018 and final figures for the winter period 2016 to 2017. Historical trends from the winter of 1950 to 1951 onwards are also provided for comparison. Figures are presented by sex, age, region and cause of death. Information on temperature and influenza incidence is also given to add context to the mortality figures.
We provide early access for quality assurance purposes to a small number of analysts within Public Health England (PHE) and Public Health Wales (PHW). The analysts are not permitted to share the findings or the report wider in their organisations. The report is provided for the analysts to provide technical epidemiological comment on our findings around influenza and weather. However, Office for National Statistics (ONS) itself independently produces these statistics, including determining the focus, content, commentary, illustration and interpretation of the measures presented and the comments provided are purely advisory.
Method for calculating excess winter mortality
Excess winter deaths (EWD)
Johnson and Griffiths (2003) investigated seasonal mortality and reported that historically, above average mortality is typically seen between December and March (PDF, 97KB) in England and Wales. Therefore, our standard method defines the winter period as December to March and compares the number of deaths that occurred in this winter period with the average number of deaths occurring in the preceding August to November and the following April to July. The calculation used is:
This produces the number of EWD. Provisional EWD figures are produced for the most recent winter using special estimation methods (see the “How the output is created” section of the Quality and Methodology Information report) and so are rounded to the nearest 100 deaths. Final EWD figures for the previous winter are rounded to the nearest 10 deaths.
Excess winter mortality (EWM) index
The EWM index is calculated so that comparisons can be made between sexes, age groups and regions, and is calculated as the number of EWD divided by the average non-winter deaths:
The EWM index is presented with 95% confidence intervals, which are calculated as:
The EWM index shows the percentage of extra deaths that occurred in the winter and is reported to one decimal place.
The term “significant” is used throughout this release and refers to statistically significant changes or differences. As a general rule, significance is determined by the 95% confidence intervals, where non-overlapping confidence intervals between figures demonstrates that the difference is unlikely to be due to random fluctuation.
More details about how EWM is calculated and how to interpret and use confidence intervals are available in the Quality and Methodology Information report.
Back to table of contents4. Excess winter deaths in 2017 to 2018 are the highest recorded since the winter of 1975 to 1976
In the 2017 to 2018 winter period, there were an estimated 50,100 excess winter deaths (EWD) in England and Wales (Figure 1). The number of EWD observed in 2017 to 2018 was higher than all years since the 1975 to 1976 winter period when there were 58,100 EWD. However, the increase in EWD was similar to peaks observed in previous years such as 2014 to 2015, 1999 to 2000 and 1998 to 1999.
Compared with recent winters, the EWD observed in 2017 to 2018 were 45.1% higher than the 2016 to 2017 winter and more than doubled since the 2015 to 2016 winter. The most recent peak in EWD was observed in 2014 to 2015, however, 2017 to 2018 EWD exceeded this by approximately 6,000 deaths.
Figure 1: Excess winter deaths and five-year central moving average
England and Wales, between 1950 to 1951 and 2017 to 2018
Source: Office for National Statistics
Notes:
Excess winter deaths (EWD) figures are based on deaths occurring in each period (August through to the following July). Numbers of deaths from January to July 2018 are provisional, and have been adjusted to take account of late registrations (see Excess Winter Mortality Quality and Methodology Information report).
Figures for the latest winter are provisional and are rounded to the nearest 100, figures for all other winters are final and are rounded to the nearest 10.
Central moving averages were calculated using the winter period of interest, along with the two winter periods before and two periods after.
Figures for England and Wales include deaths of non-residents.
Download this chart Figure 1: Excess winter deaths and five-year central moving average
Image .csv .xlsLarge fluctuations in EWD between years are common, so a five-year moving average is included in Figure 1 to smooth out short-term fluctuations and make the trend over time clearer. Generally, historical trends in EWD in England and Wales show that the steady decrease since the 1950 to 1951 winter period has levelled off in recent years, particularly evident in the increase of the five-year average.
The excess winter mortality (EWM) index in 2017 to 2018 was 30.3%, which means that 30.3% more deaths occurred in the winter months compared with the non-winter months (Figure 2). The most recent winter’s index was statistically significantly higher than all previous years since 1991 to 1992 when the index data series began.
Figure 2: Excess winter mortality index
England and Wales, between 1991 to 1992 and 2017 to 2018
Source: Office for National Statistics
Notes:
Excess winter mortality (EWM) figures are based on deaths occurring in each period (August through to the following July). Numbers of deaths from January to July 2018 are provisional, and have been adjusted to take account of late registrations (see Excess Winter Mortality Quality and Methodology Information report).
The EWM index is calculated as excess winter deaths divided by the average non-winter deaths, expressed as a percentage.
Figures for England and Wales include deaths of non-residents.
Download this chart Figure 2: Excess winter mortality index
Image .csv .xls5. Pronounced increase in mortality over the winter months
For the 2017 to 2018 winter period the peak in daily deaths occurred towards the beginning of January, which is in line with previous winters. A second smaller peak was observed at the beginning of March (Figure 3).
The number of deaths per day in 2017 to 2018 exceeded the daily five-year average for all days during the winter months with the exception of 25 March. These increases could be explained partly by temperature, as colder weather was observed in December, February and March compared with the five-year average. Specifically, Central England daily temperatures show there was a particularly cold period between 22 February and 3 March, which could account for the second peak in daily deaths. The peak in January could also be a result of influenza, whose activity increased in the first weeks of January, reaching a peak in week 3.
Figure 3: Number of daily deaths and five-year average daily deaths
England and Wales, August 2017 to July 2018
Source: Office for National Statistics
Notes:
Figures are based on deaths occurring each day. Numbers of deaths from January to July 2018 are provisional, and have been adjusted to take account of late registrations (see the Excess Winter Mortality Quality and Methodology Information report).
Five-year averages for each day are calculated using data from the previous five years, excluding the current year.
Figures for England and Wales include deaths of non-residents.
Download this chart Figure 3: Number of daily deaths and five-year average daily deaths
Image .csv .xls6. Females and the elderly were most affected by excess winter mortality
Of the estimated 50,100 excess winter deaths (EWD) in 2017 to 2018, there were 43.7% (21,900 EWD) among males and 56.1% (28,100 EWD) among females. EWD are generally higher in females than males, which may partly be explained by the higher proportion of females aged 85 years and over compared with males; 63.9% of the population aged 85 years and over are female.
Figures 4a and 4b show the excess winter mortality (EWM) index for males and females respectively for the last three winter periods, by age group. For both sexes, the EWM index for the 2017 to 2018 winter statistically significantly increased across all age groups since the 2016 to 2017 winter. The highest EWM index in the recent period was for males and females aged 85 years and over (36.1% and 43.3% respectively). This may be due to the co-circulation of influenza A(H3N2) and influenza B (PDF, 1.6MB), which predominately affected older adults.
The largest percentage point differences observed in the EWM index from 2016 to 2017 and 2017 to 2018 were in females aged 85 years and over whose index increased from 32.3% to 43.3%. However, for males, the youngest age group (0 to 64 years) had the largest percentage point increase from 8.7% to 19.2%. This meant the EWM index for males aged 0 to 64 years in 2017 to 2018 was higher than females aged 0 to 64 years and higher than all age groups across both sexes in 2015 to 2016 too.
Overall for all ages, the EWM index for males shows a statistically significant increase from 17.6% in 2016 to 2017 to 26.8% in 2017 to 2018 and for females a statistically significant increase from 24.3% to 33.6% during the same period.
Figure 4a: Excess winter mortality index by age group, males
England and Wales, between 2015 to 2016 and 2017 to 2018
Source: Office for National Statistics
Notes:
Excess winter mortality (EWM) figures are based on deaths occurring in each period (August through to the following July). Numbers of deaths from January to July 2018 are provisional, and have been adjusted to take account of late registrations (see Excess Winter Mortality Quality and Methodology Information report).
Totals for all ages will not be equal to the sum of the individual age groups due to rounding.
The EWM index is calculated as excess winter deaths divided by the average non-winter deaths, expressed as a percentage.
Figures for England and Wales include deaths of non-residents.
Download this chart Figure 4a: Excess winter mortality index by age group, males
Image .csv .xls
Figure 4b: Excess winter mortality index by age group, female
England and Wales, between 2015 to 2016 and 2017 to 2018
Source: Office for National Statistics
Notes:
Excess winter mortality (EWM) figures are based on deaths occurring in each period (August through to the following July). Numbers of deaths from January to July 2018 are provisional, and have been adjusted to take account of late registrations (see Excess Winter Mortality Quality and Methodology Information report).
Totals for all ages will not be equal to the sum of the individual age groups due to rounding.
The EWM index is calculated as excess winter deaths divided by the average non-winter deaths, expressed as a percentage.
Figures for England and Wales include deaths of non-residents.
Download this chart Figure 4b: Excess winter mortality index by age group, female
Image .csv .xls7. Respiratory disease caused most excess winter deaths
Figure 5 presents the excess winter mortality (EWM) index by the three leading causes of death: circulatory diseases (defined as International Classification of Diseases ICD-10 codes I00 to I99), respiratory diseases (defined as ICD-10 codes J00 to J99) and dementia and Alzheimer’s disease (defined as ICD-10 codes F01, F03 and G30).
Respiratory diseases remained the most prominent underlying cause of excess winter deaths (EWD) with 84.9% more respiratory deaths in the winter months compared with the non-winter months in 2017 to 2018. This equates to 17,400 EWD caused by respiratory diseases and accounted for 34.7% of all EWD.
The EWM index for respiratory diseases in 2017 to 2018 was statistically significantly higher in all years since 2000 to 2001. Of these excess respiratory deaths, pneumonia (specifically ICD-10 code J18) and chronic obstructive pulmonary diseases (specifically ICD-10 code J44) accounted for the largest proportions. The prominence of pneumonia is likely related to the relationship between EWM and a range of bacterial and viral respiratory pathogens including influenza.
Figure 5: Excess winter mortality index by underlying cause of death
England and Wales, between 2015 to 2016 and 2017 to 2018
Source: Office for National Statistics
Notes:
Underlying cause of death is defined using the International Classification of Diseases, Tenth Revision (ICD-10) using I00-I99 for circulatory diseases, J00-J99 for respiratory diseases and F01, F03 and G30 for dementia and Alzheimer’s disease.
Excess winter mortality (EWM) figures are based on deaths occurring in each period (August through to the following July). Numbers of deaths from January to July 2018 are provisional, and have been adjusted to take account of late registrations (see Excess Winter Mortality Quality and Methodology Information report).
The EWM index is calculated as excess winter deaths divided by the average non-winter deaths, expressed as a percentage.
A more detailed verion of Figure 5 showing excess winter mortality, broken down by sex and age group can be found in Table 1 of the accompanying dataset.
Figures for England and Wales include deaths of non-residents.
Download this chart Figure 5: Excess winter mortality index by underlying cause of death
Image .csv .xlsIn the winter of 2017 to 2018, there were 28.0% more deaths from circulatory diseases compared with non-winter months, which accounted for nearly a quarter of all EWD (23.0% or 11,500 deaths out of 50,100). The EWM index for circulatory diseases for the current period was the highest observed since the beginning of the time series in 1991 to 1992. The number dying from circulatory diseases remained quite high throughout the year, therefore the seasonal differences tend to be lower than respiratory diseases, and dementia and Alzheimer’s disease.
Dementia and Alzheimer’s disease accounted for 21.6% of all EWD (10,800 deaths out of 50,100) in the winter of 2017 to 2018, with 54.1% more deaths occurring in winter months than non-winter months. The EWM index was statistically significantly higher than 2016 to 2017 and 2015 to 2016, however, the increase was not statistically significant compared with 2014 to 2015. The reasons for the seasonal pattern in deaths from dementia and Alzheimer’s disease are not clear. It may be related to the greater vulnerability of people with these conditions to respiratory diseases, difficulties with self-care, and falls, all of which may have greater impact in winter months.
Similar relationships between underlying cause and age can be seen for both males and females. Table 1 in the accompanying dataset is a more detailed version of Figure 5 and shows the number of EWD and EWM index in England and Wales between the winters of 1991 to 1992 and 2017 to 2018, by sex and age group for respiratory diseases, circulatory diseases, dementia and Alzheimer’s disease, and injury and poisoning (up to 2016 to 2017). Injury and poisoning are not included in Figure 5 due to the unreliable nature of the latest provisional data (long delays in registration). More information is available in the Quality and Methodology Information report.
Back to table of contents8. Predominant strain of influenza in winter 2017 to 2018 impacted the elderly the most
Influenza is a respiratory disease caused by a viral infection that affects the lungs and airways (World Health Organisation, 2008). Influenza infections can become potentially life-threatening when complications such as bacterial pneumonia occur. Those at most risk of developing complications are persons with other underlying health conditions and the elderly and such complications may result in hospitalisation or death.
Figure 6 plots the weekly number of all cause deaths and weekly influenza-like illness (ILI) consultation rates in primary care from week 31 in 1999 to week 30 in 2018 (where week 1 is the first week of the year). The ILI consultation rate peaked in week 3 of 2018 (56.9 consultations per 100,000 population) occurring later than last season when the ILI consultation rate peak occurred in week 1 of 2017. The highest number of weekly deaths in 2017 to 2018 occurred in week 1 of 2018 with 14,010 deaths. Following week 3 of 2018, there was a decline in both weekly deaths and the weekly ILI consultation rate.
This season saw moderate to high levels of influenza activity particularly in Wales (PDF, 2.6MB). According to Public Health England’s UK surveillance report (PDF, 1.6MB), during the 2017 to 2018 period, co-circulation of influenza A (H3N2) and influenza B was observed impacting predominantly older adults with increased care home outbreaks. The influenza vaccine uptake in 2017 to 2018 was higher compared with 2016 to 2017 across all target groups, particularly in those aged 65 years and over. However, the vaccine was more effective (PDF, 151KB) in those aged 2 to 17 years (26.9% effective) and 18 to 64 years (12.2% effective) compared with those aged 65 years and over (10.1% effective). This may explain why the influenza virus had a greater impact on the elderly.
Figure 6: Weekly deaths from all causes and Royal College of General Practitioners (RCGP) and Public Health Wales (PHW) influenza-like illness (ILI) consultation rates
Rates per 100,000 population, England and Wales, 1999 to 2018
Source: Office for National Statistics, The Royal College of General Practitioners Research and Surveillance Centre and Public Health Wales
Notes:
Figures are based on deaths occurring each week. Numbers of deaths from January to July 2018 are provisional, and have been adjusted to take account of late registrations (see Excess Winter Mortality Quality and Methodology Information report).
The method for calculating influenza-like illness rates changed from week number 2015(31), so rates from this week onwards are not directly comparable to previous weeks. For more information, see the ‘Methological changes’ section of the statistical bulletin.
Figures for England and Wales include deaths of non-residents.
Download this chart Figure 6: Weekly deaths from all causes and Royal College of General Practitioners (RCGP) and Public Health Wales (PHW) influenza-like illness (ILI) consultation rates
Image .csv .xls9. Relationship between excess winter mortality and temperature is complex
Research has shown that as the temperature gets colder mortality increases, but temperature is only able to explain a part of the variance in excess winter mortality (EWM)(PDF, 293KB).
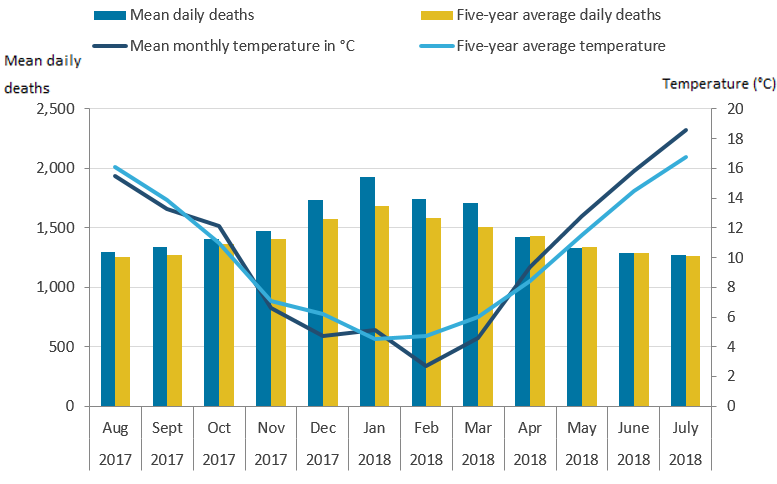
During the winter period, the months December to March had higher mean daily deaths compared with the five-year average (Figure 7). Similar to previous winter periods, January had the highest mean daily deaths with 1,927, which was 246 more deaths than the five-year average. The majority of non-winter months also had higher mean daily deaths than the average, apart from April to June where there were slightly less mean daily deaths.
Below-average temperatures were observed in 6 of the 12 months particularly during the winter months of December (4.7 degrees Celsius), February (2.7 degrees Celsius) and March (4.6 degrees Celsius). Higher than average temperatures were observed in the non-winter months April to July with the highest mean monthly temperature occurring in July at 18.6 degrees Celsius.
Figure 7: Mean number of daily deaths each month and mean monthly temperatures
England and Wales, August 2017 to July 2018
Source: Office for National Statistics and The Met Office
Notes:
The mean number of daily deaths is based on deaths occurring in each month. Number of deaths from January to July 2018 are provisional and have been adjusted to take account of late registrations (see Excess Winter Mortality Quality and Methodology Information report).
Five-year averages for each month are calculated using data from the previous five years, excluding the current year.
Figures for England and Wales include deaths of non-residents.
Download this image Figure 7: Mean number of daily deaths each month and mean monthly temperatures
.PNG (52.0 kB) .xls (41.0 kB)
Colder than average temperatures for the winter months of 2017 to 2018 may partially explain the increase in winter deaths. However, previous years demonstate a weak relationship between temperature and EWD (Figure 8). Increased EWD are not always coupled with unusually cold winters and conversely winters with decreased EWD are not always coupled with milder winter temperatures, indicating factors other than temperature, such as influenza, are also relevant in explaining trends in excess winter mortality (EWM).
Figure 8: Excess winter deaths and average winter temperature
England and Wales, between 1999 to 2000 and 2017 to 2018
Source: Office for National Statistics and The Met Office
Notes:
Excess winter deaths (EWD) figures are based on deaths occurring in each period (August through to the following July). Numbers of deaths from January to July 2018 are provisional, and have been adjusted to take account of late registrations (see Excess Winter Mortality Quality and Methodology Information report).
Figures for the latest winter are provisional and are rounded to the nearest 100, figures for all other winters are final and are rounded to the nearest 10.
Mean winter temperature is calculated using average temperatures from December to March.
Figures for England and Wales include deaths for non-residents.
Download this chart Figure 8: Excess winter deaths and average winter temperature
Image .csv .xls10. Excess winter mortality significantly increased in all regions of England and in Wales in 2017 to 2018
Figure 9a shows the excess winter mortality (EWM) index for the most recent period (2017 to 2018) whereas Figure 9b shows the index for the latest three periods. In 2017 to 2018, the highest regional EWM index was in Wales with 32.8%, followed by the North East and East of England, both with 31.0%. In comparison with the England and Wales average (30.3%), only Wales’ EWM index was statistically significantly higher whereas London was the only region whose index was statistically significantly lower (27.3%). The large increase in Wales’ EWM index may be due to the high levels of influenza activity (PDF, 2.6MB).
Figure 9a: Excess winter mortality index for regions of England and in Wales
Winter period 2017 to 2018

Source: Office for National Statistics
Notes:
Excess winter mortality (EWM) figures are based on deaths occurring in each period (August through to the following July). Numbers of deaths from January to July 2018 are provisional, and have been adjusted to take account of late registrations (see Excess Winter Mortality Quality and Methodology Information report).
The EWM index is calculated as excess winter deaths divided by the average non-winter deaths, expressed as a percentage.
Figures for England, English regions and Wales exclude deaths of persons usually resident in each area. Figures for England and Wales combined include deaths of non-residents.
Based on boundaries as of August 2018.
Download this image Figure 9a: Excess winter mortality index for regions of England and in Wales
.png (133.8 kB) .xls (37.9 kB)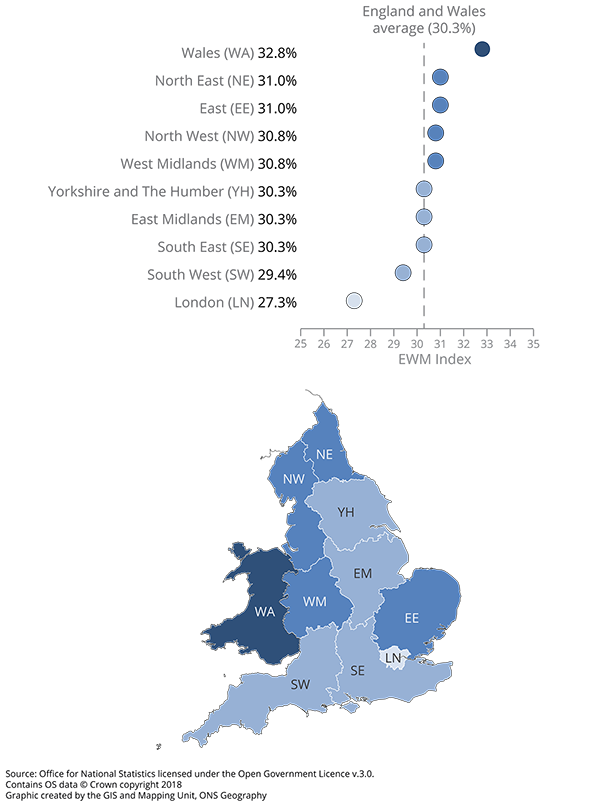
Overall, the EWM index for all English regions and Wales has increased for two consecutive periods (between 2015 to 2016 and 2017 to 2018) with all increases being statistically significant except for Wales between 2015 to 2016 and 2016 to 2017. Figure 9b shows that there was no consistent pattern in EWM over time for the English regions and Wales. This is particularly evident in Wales whose EWM index was the highest in 2015 to 2016 and 2017 to 2018, however, it was the second-lowest in 2016 to 2017. This can also be seen for London whose EWM index was the lowest in 2017 to 2018 and second-lowest in 2015 to 2016, however, was one of the highest in 2016 to 2017.
Figure 9b: Excess winter mortality index for regions of England and in Wales
Between 2015 to 2016 and 2017 to 2018
Source: Office for National Statistics
Notes:
Excess winter mortality (EWM) figures are based on deaths occurring in each period (August through to the following July). Numbers of deaths from January to July 2018 are provisional, and have been adjusted to take account of late registrations (see Excess Winter Mortality Quality and Methodology Information report).
The EWM index is calculated as excess winter deaths divided by the average non-winter deaths, expressed as a percentage.
Figures for England, English regions and Wales exclude deaths of persons usually resident in each area. Figures for England and Wales combined include deaths of non-residents.
Based on boundaries as of August 2018.
Download this chart Figure 9b: Excess winter mortality index for regions of England and in Wales
Image .csv .xls11. What causes excess winter mortality?
A study by Healy (2003) showed that excess winter mortality (EWM) varied widely within Europe. The results show that countries with low winter temperatures in Scandinavia and Northern Europe, such as Finland and Germany, had very low rates of EWM. Conversely, countries with very mild winter temperatures in Southern Europe such as Portugal and Spain had very high rates of EWM. England and Wales both have higher than average EWM and exhibit high variation in seasonal mortality. These results were echoed in a more recent study by Fowler and others (2014).
There are many reasons why countries with milder winter climates have such a high level of winter mortality. For example, people who live in countries with warmer winters tend to take fewer precautions against the cold. The Eurowinter group (1997) reported that compared with people living in countries with cold winters, those from warmer countries were less likely to wear warm protective clothing in cold weather.
Countries with milder winters also tend to have homes with poorer thermal efficiency (for example, fewer homes have cavity wall insulation and double glazing), which makes it harder to keep homes warm during the winter (Healy, 2003). It has been shown that low indoor temperature is associated with higher EWM from cardiovascular disease in England (Wilkinson and others, 2001).
Although EWM is associated with low temperatures, conditions directly relating to cold, such as hypothermia, are not the main cause of EWM. The majority of additional winter deaths are caused by cerebrovascular diseases, ischaemic heart disease, respiratory diseases, and dementia and Alzheimer’s disease. Although cancer causes more than a quarter of all deaths annually, previous research by Johnson and Griffiths (2003) found that there was no clear seasonal pattern for these deaths (PDF, 97KB).
The cold can have various physiological effects, which may lead to death in vulnerable people. Woodhouse and others (1993) reported that colder home temperature was associated with increased blood pressure in older people. The Eurowinter group (1997) noted that cold causes haemoconcentration, which leads to thrombosis, and that cold can also lower the immune system’s resistance to respiratory infections. Additionally, the level of influenza circulating in the population increases in winter. In vulnerable groups, for example, in the elderly or those with pre-existing health problems, influenza can lead to life-threatening complications, such as bronchitis or secondary bacterial pneumonia (Public Health England, 2014).
Previous research has shown that although mortality does increase as it gets colder, temperature only explains a small amount of the variance in winter mortality and high levels of EWM can occur during relatively mild winters (PDF, 293KB) (Brown and others, 2010). Curwen and Devis (1988) showed that both temperature and levels of influenza were important predictors of EWM. The relationship between temperature, influenza and winter mortality is complex.
Back to table of contents13. Quality and methodology
The Excess winter mortality in England and Wales Quality and Methodology Information report contains important information on:
the strengths and limitations of the data and how it compares with related data
uses and users of the data
how the output was created
the quality of the output including the accuracy of the data