1. Main points
Output per hour worked increased by 0.4% in Quarter 3 (July to Sept) 2016.
Estimates of labour productivity for the UK regions suggest wide variation in productivity, ranging from 32% above the UK average in London, to almost 20% below the UK average in Wales and Northern Ireland in 2015.
New analysis of data on the management practices of manufacturing businesses suggests that firms with more structured management practices tend to have a higher level of labour productivity.
Experimental estimates suggest that market sector capital services grew by 1.8% in 2015, the fastest annual rate since 2008, albeit well below the pre-downturn average.
New estimates indicate that public service productivity increased by around 0.2% in 2014, supported by productivity growth in public service healthcare of 2.3% over the same period.
2. Introduction
Output per hour worked increased by 0.4% in Quarter 3 (July to Sept) 2016, following growth of 0.4% and 0.5% in the 2 preceding quarters. As a result, labour productivity was around 0.4% higher in Quarter 3 2016 than in the same period a year earlier, and has grown consistently over the past 3 quarters. Against this backdrop, this edition of the productivity bulletin summarises our recent statistics on and analysis of productivity.
Alongside data on aggregate UK labour productivity, this release contains:
new estimates of sub-national labour productivity for 2015 which suggest that output per hour worked varies considerably across the UK; from around 32% above the UK average in London, to almost 20% below in Wales and Northern Ireland
new estimates of public service productivity, including for both public healthcare and for the total public sector, which suggest that productivity grew by around 0.2% in 2014, supported by productivity growth in public service healthcare of 2.3% over the same period
This release also contains new experimental estimates on the extent of UK capital services. These estimates suggest that the services derived from the accumulated capital stock in the market sector increased by around 1.8% in 2015 – the fastest rate of growth since 2008. However, this growth of capital services has not kept track with the growth of employment. As a result, the market sector has experienced a degree of capital shallowing each year since 2009.
Finally, this release also includes new analysis of the pilot Management Practices Survey (MPS) of the manufacturing industry. Using data from this new survey with information from the Annual Business Survey (ABS), this analysis shows that businesses with more structured management practices tend to have higher levels of labour productivity. The detailed analysis shows that after accounting for business characteristics, a 0.1 increase in management score is associated with an increase in labour productivity of 6.7%
Back to table of contents3. Labour productivity
Output per hour worked – our preferred measure of labour productivity – increased by 0.4% in Quarter 3 (July to Sept) 2016. This follows growth of 0.4% and 0.5% in the 2 preceding quarters, and reflects growth of around 0.3% quarter on quarter in the services industries, which represents the largest share of the UK economy. This service-sector led growth was, however, offset to some extent by a slight fall in the productivity of manufacturing (0.2%). Labour productivity in the production industries as a whole is estimated to have grown by around 0.2% over the same period as a result of the strong performance of the Oil and Gas industry1.
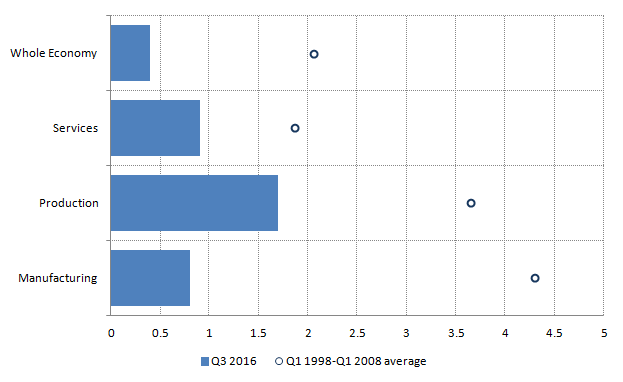
The stable rate of productivity growth over the last 3 quarters is in contrast to the relatively volatile profile of output per hour growth during 2015 – which concluded with a relatively sharp contraction. As a result, whole economy output per hour worked in Quarter 3 2016 was around 0.4% higher than in the same period a year earlier (Figure 1), reflecting growth of 0.9% and 0.8% in the services and manufacturing industries over the same period2. However, each of these rates is considerably below the average annual growth rates recorded in the decade prior to the economic downturn. Average annual output per hour growth has weakened in Manufacturing in particular: falling from 4.3% per year in the decade prior to Quarter 1 (Jan to Mar) 2008 to just 0.8% per year in the 4 quarters to Quarter 3 2016.
Figure 1: Average annual growth of output per hour worked
UK, seasonally adjusted, whole economy and selected industries, Quarter 3 (July to Sept) 2016 and Quarter 1 (Jan to Mar) 1998 to Quarter (Jan to Mar) 1 2008 average,
Source: Office for National Statistics
Download this image Figure 1: Average annual growth of output per hour worked
.png (9.3 kB) .xls (25.6 kB)
Productivity growth for the economy as a whole in the year to Quarter 3 2016 was notably lower than that in both the services and production industries as a result of a considerable reallocation of labour towards the services industries over this period. The headline labour productivity statistics reflect both changes in the productivity of specific industries and their relative shares of output and employment.
While productivity in the production and services industries grew by 1.7% and 0.9% respectively over the year to Quarter 3 2016, hours worked fell by 0.6% in the Production industries (which have a relatively high level of output per hour) over this period and increased in the services industries (which have a lower level of output per hour). This shift in labour, other things being equal, has helped to push down average labour productivity over the last year. Much of the fall in hours worked in production can be accounted for by mining and quarrying where hours worked have fallen by 18% over the last year.
This recent weak performance relative to the UK’s long-term average is a continuation of the subdued rate of productivity growth since the onset of the economic downturn. Figure 2 shows the annualised 5-year growth rates of output, jobs, and output per job between 1965 and 2016. In this presentation, jobs growth has been inverted, as positive (negative) jobs growth has a negative (positive) impact on output per job growth. It shows that on this basis, labour productivity growth has averaged around 2% per year through much of the past half-century, with notable deviations above (in the 1960s, early 1970s and mid-1980s) and below (in the mid-1970s) this benchmark. The UK’s recent experience – since the onset of the economic downturn in 2008 – is highly unusual. On this basis, the weakness of labour productivity between 2008 and 2012 is unprecedented in the last half-century, and the UK’s recent productivity recovery continues to be little stronger than the weakest recorded point prior to 2008.
Figure 2: 5-year annualised output, jobs, and output-per-job growth
UK, seasonally adjusted, Quarter 1 (Jan to Mar) 1965 to Quarter 3 (July to Sept) 2016
Source: Office for National Statistics
Download this chart Figure 2: 5-year annualised output, jobs, and output-per-job growth
Image .csv .xlsThis analysis of how labour productivity growth is delivered – whether through changes in output or jobs growth – can be instructive. The panels of Figures 3 and 4 plot the 5-year growth rates of output (on the vertical axis) and jobs (on the horizontal) for the industry groupings for which labour productivity information is available. The 45-degree line shows equal output and jobs growth rates, indicating zero productivity growth. Industries which lie to the left of the 45-degree line – indicating faster output than jobs growth – experience positive productivity growth, while points which lie to the right of the 45-degree line – indicating faster jobs than output growth – imply negative productivity growth. The relative size of each industry – measured by the number of jobs in an industry – is represented by the depth of the blue shade around those industries: deeper blue shades consequently indicate the performance of industries with a relatively large number of workers. Figure 3 provides some information about the pre-downturn period, while Figure 4 shows equivalent analysis for 2012 and 2016.
This analysis indicates that productivity growth on this measure was positive in a majority of industries in the early 2000s, but was being delivered in quite different ways across different industries. In the first panel of Figure 3, all but 3 industries lie to the left of the 45-degree line, indicating positive productivity growth, but they are broadly divided into 2 groups. Productivity growth in the manufacturing industries – shown by the cluster of orange points – was largely a consequence of broadly stable output combined with falling numbers of jobs. By contrast, productivity growth in the services industries was achieved by stronger output growth than jobs growth. As the weight of jobs is centred in the services industries, the majority of labour input was concentrated in these latter industries.
Figure 3: Annualised 5-year growth in jobs and output for selected industries
UK, seasonally adjusted, Quarter 4 (Oct to Dec) 2002 (top panel) Quarter 4 (Oct to Dec) 2007 (bottom panel)

Source: Office for National Statistics
Download this image Figure 3: Annualised 5-year growth in jobs and output for selected industries
.png (101.5 kB) .xls (103.4 kB)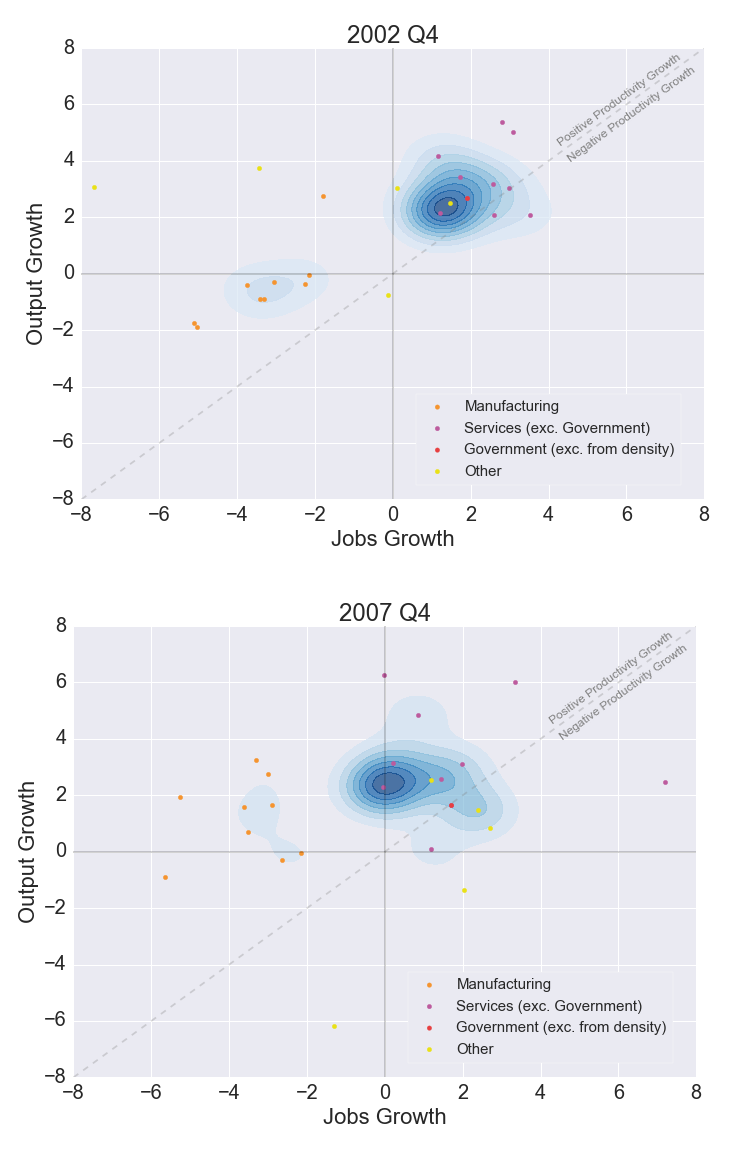
Immediately prior to the economic downturn in 2007 (Figure 3, second panel), this picture is little changed. A majority of industries continue to record positive productivity growth. Productivity growth in the manufacturing industries continues to be delivered by stronger output than jobs growth – extending the fall in manufacturing jobs observed in the early 2000s. Over this period, the output growth of these industries appears to have been a result of growing capital intensity and total factor productivity – enabling firms to deliver more output with less labour input (see following section on the Volume Index of Capital Services). Among services, the pace of jobs growth has slowed somewhat in the largest industries – reflected in the shift of the points and the density to the left – but the pace of output growth has continued. Among this group of industries there is also evidence of some dispersion in performance – with a number of industries recording quite different rates of employment and output growth.
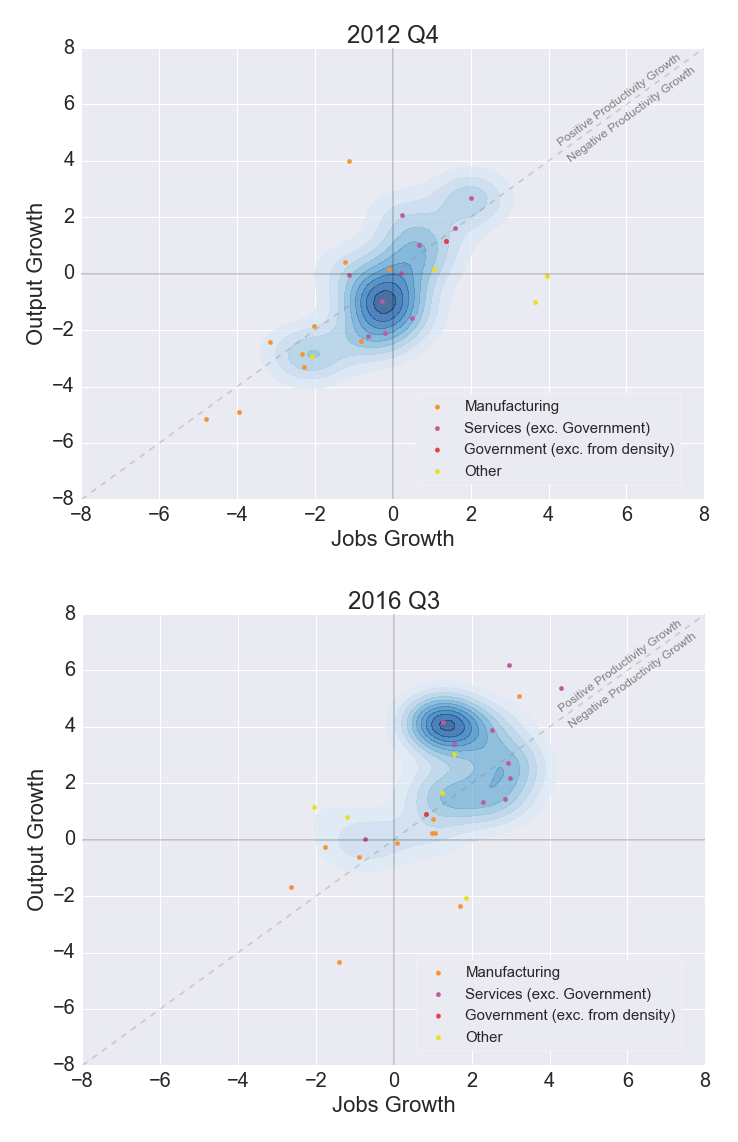
Equivalent analysis of the downturn itself suggests that the weakening of productivity growth between 2007 and 2012 affected a large number of different industries. The first panel of Figure 4 shows that – in contrast to the pre-downturn period – a large number of industries are located along or below the 45-degree line, indicating that their rate of productivity growth had slowed to zero or below. The density of jobs has also shifted down and to the left – indicating that the services industries which account for a majority of employment had flat or falling output, combined with a weakening in their rate of jobs growth over this period. In manufacturing, output growth weakened considerably during this period, and productivity was only held stable by continued, relatively deep cuts in the number of jobs. These trends suggest a broad-based shock to productivity at the time of the economic downturn, affecting a wide range of industries.
Figure 4: Annualised 5-year growth in jobs and output for selected industries
UK, seasonally adjusted, Quarter 4 (Oct to Dec) 2012 (top panel) Quarter 3 (July to Sept) 2016 (bottom panel)
Source: Office for National Statistics
Download this image Figure 4: Annualised 5-year growth in jobs and output for selected industries
.png (105.3 kB) .xls (103.4 kB)
The second panel of Figure 4 indicates that some of this shock appears to have unwound over the past 5 years, although a large number of industries remain on or close to the “no change” productivity line. As in previous periods the manufacturing industries recorded broadly flat output and either a stable or a falling number of jobs over the previous 5 years, while output growth appears to have resumed in those services industries which account for the largest proportion of employment. However, perhaps the defining change between the 2 panels of Figure 4 is the shift of almost all industries to the right along the diagonal – indicating that jobs and output growth have strengthened in parallel over this period with little change in productivity. This rightwards shift – broadly based across many different industries – captures the essence of the productivity puzzle.
Notes for: Labour productivity
- Note that the whole economy data reflects both the performance of individual industries and the impact of output and labour being reallocated between industries. This accounts for the differences between the whole economy performance and its sub-industries.
- As with the more recent period, note that the whole economy data reflects both the performance of individual industries and the impact of output and labour being reallocated between industries. This accounts for the differences between the whole economy performance and its sub-industries.
4. Regional productivity
Alongside estimates of labour productivity for specific industries and for the whole economy, we also produce estimates of regional, sub-regional and city-region productivity, the most recent versions of which are published as part of this release. These data use information from the regional accounts and estimates of regional labour input drawn from several different sources to produce measures of sub-national nominal gross value added (GVA) per hour worked and per filled job. The nominal nature of these data – meaning that differences in both the price and volume of economic activity across different regions contribute to differences in the levels of output – mean that they need careful interpretation, but the picture which they present is instructive.
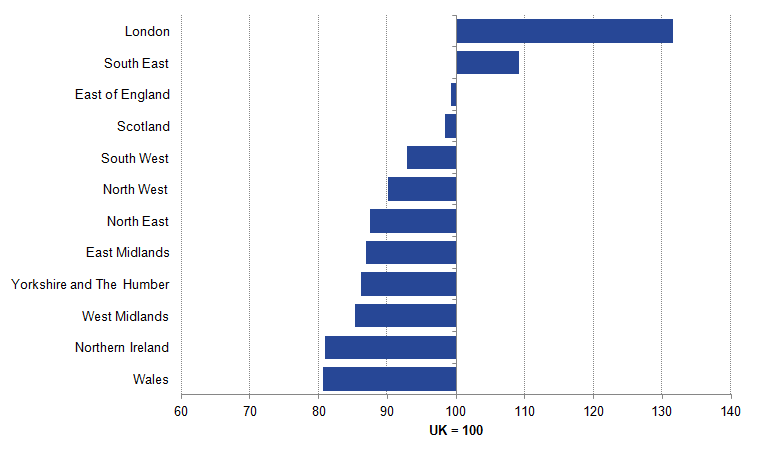
At the highest level of regional aggregation there are striking differences in labour productivity. Figure 5 shows the level of nominal GVA per hour worked for the regions and countries of the UK in 2015 relative to the UK average. It shows that on this measure, London’s labour productivity was the highest of all the UK’s regions in 2015, at around 32% above the UK average. The South East also recorded above average labour productivity, while the East of England and Scotland were slightly below the UK average. By contrast, levels of labour productivity in Wales and Northern Ireland were almost 20% below the UK average over the same period. The regions in the North and Midlands of England ranged between 10% to 15% below the UK average.
Figure 5: Nominal GVA per hour worked
NUTS 1 country and region, workplace based estimates, 2015
Source: Office for National Statistics
Download this image Figure 5: Nominal GVA per hour worked
.png (12.4 kB) .xls (26.1 kB)
These results reflect a combination of long-standing differences in labour productivity and differences in regional performance over recent years. Over the 10 years to 2015, Scotland and London have both performed more strongly on this measure than the UK average: Scotland has risen from having labour productivity 7% below the UK average in 2005 to 2% below in 2015, while London has moved further ahead – rising from 28% to 32% above the UK average over the same period. By contrast, Wales and the English regions in the North and Midlands have seen their relative productivity performance weaken over this period. However, these changes notwithstanding, the ranking of regions by labour productivity is little different to comparable estimates from a decade earlier, indicating the long-standing nature of many of these regional difference.
These differences likely reflect a range of different factors – notably the structure, composition and relative performance of regional economies, variation in price levels and growth rates, as well as the density of economic activity. At the lower, NUTS 3 level geography – which divides Great Britain into 168 regions, there are 47 areas with above average GVA per hour worked1. These include all 21 London sub-regions, and a further 19 sub-regions in the South of England. However, there are also 4 in Scotland and 3 in the North or Midlands of England. At the City region level (Figure 6), Aberdeen, Bristol and Edinburgh all record levels of labour productivity above or close to the UK average.
Figure 6: Nominal GVA per hour worked
City Regions, 2015

Source: Office for National Statistics
Download this image Figure 6: Nominal GVA per hour worked
.png (13.5 kB) .xls (17.9 kB)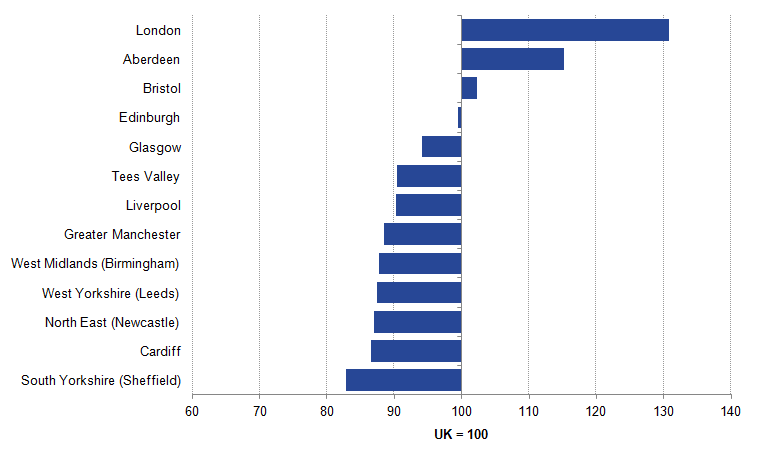
The mix of activity across different regions of the UK may also play a role in determining these regional differences in productivity. Estimates of imputed rentals – the value of housing services which individuals derive from owning their home – which are included in measures of regional GVA can have a considerable impact on measures of productivity. This component of GVA is larger in areas with higher rates of home ownership and in areas with relatively high levels of rent, and affect productivity measures in particular as they involve output which is produced without recorded labour input. We consequently produce estimates of regional productivity including and excluding imputed rentals, which are published as part of this release.
The impact of making this change is largest in some of the London sub-regions. Wandsworth, Kensington and Chelsea, and Hammersmith and Fulham are the NUTS3 sub-regions that experience the largest decrease in productivity index with the removal of rental incomes – reflecting the estimated size of housing services derived by owner occupiers in these areas. By contrast, Tower Hamlets and Camden and the City of London have the largest increase in productivity index from removing imputed rental. Overall, London’s productivity index is slightly lower if imputed rental is excluded. For all of the other city regions shown in Figure 6 labour productivity is slightly higher relative to the UK average if imputed rental incomes are excluded.
Notes for: Regional productivity
- Note that for data for the NUTS 2 and 3 sub-regions and city-regions, a smoothing process is applied to the data to reduce year-on-year volatility. Unsmoothed data is available in the reference tables.
5. Intra-regional distributions of productivity
While aggregate data on the average level of productivity in specific regions can be informative about the relative performance of different parts of the UK, they mask a range of productivity outcomes across firms based within each region. Previous ONS and Bank of England analysis – among others – have shown that recorded firm-level productivity varies widely within and between regions, providing a more detailed impression of regional performance. To shed some light on these intra-regional differences, we have published a more detailed examination of firm-level productivity as part of this release.
Consistent with previous work of this sort, this analysis uses the detailed micro-data provided by businesses themselves to deliver estimates of firm-level productivity. In this instance, estimates of firm-level labour productivity have been derived from the Annual Business Survey (ABS). As a result, the data on which this work is based differs from the National Accounts aggregates published above, in terms of coverage, concepts and production. In particular, this analysis covers the non-financial business economy – therefore excluding the impact of financial services and the public sector – and is carried out in nominal terms. As a consequence the results of this analysis should be carefully interpreted. More information on the differences between the ABS and the National Accounts is set out in the release and previously published guides. Nevertheless, the trends in the two analyses are broadly similar and the firm level results can therefore provide some useful indicative explanations of the headline data.
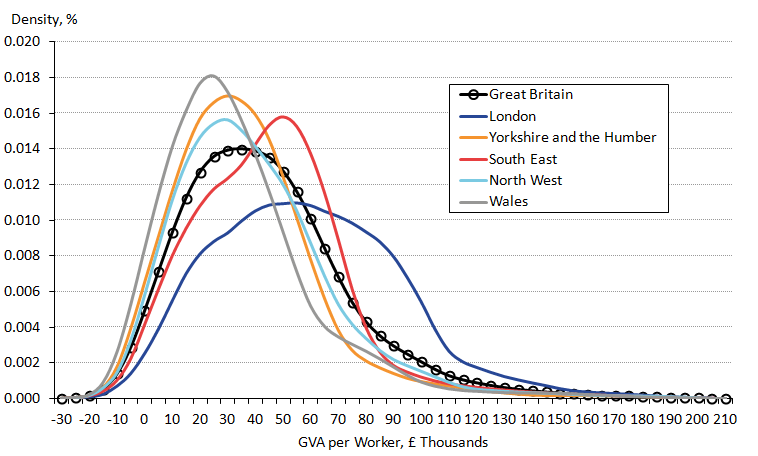
The results of this analysis suggest that there is quite wide variation in productivity levels within as well as between regions. Figure 7 plots the distribution of firm level productivity for each of the NUTS1 regions of the UK, showing how plant-level output per employee varied in 2014. It shows that there is a distribution of firm-level productivity in each region – indicating the presence of both high- and low-productivity firms in each part of the UK. However, it also shows that the distribution of productivity within regions varies across regions; the distribution of firm-level productivity in London in particular is skewed towards higher productivity levels when compared with the distribution of firm productivity levels in other regions. To a lesser extent a similar pattern is also seen in the South East and East of England regions. In Wales, by contrast, the distribution of plant-level productivity was anchored to the left of the rest of the UK in this period, indicating that there were more relatively unproductive firms in this country.
Figure 7: Distribution of firm level productivity (GVA per worker) in the non-financial business economy
NUTS1 regions, 2014
Source: Office for National Statistics
Download this image Figure 7: Distribution of firm level productivity (GVA per worker) in the non-financial business economy
.png (44.4 kB) .xls (34.3 kB)
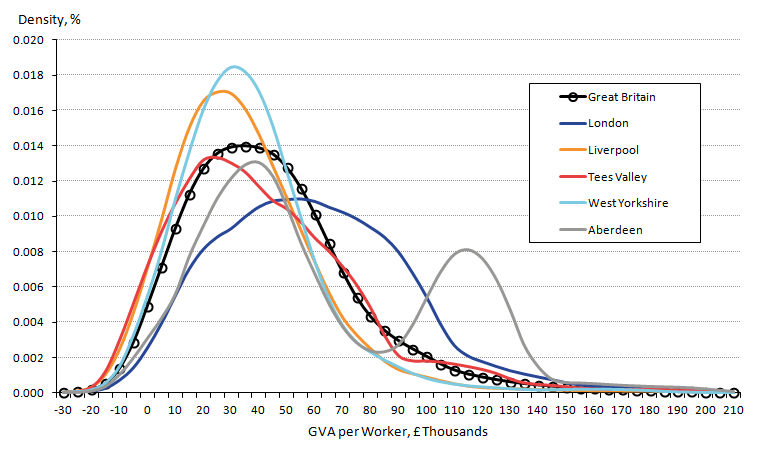
Figure 8, meanwhile, shows the same data for city regions. Again, London is shown to have a different distribution to other regions. However, it also shows an unusual distribution for Aberdeen where 2 peaks are seen in its distribution with the second peak reflecting a cluster of high productivity firms in the city region. To a lesser extent Tees Valley also has a slightly above average number of high productivity firms compared with the other city regions examined.
Figure 8: Distribution of firm level productivity (GVA per worker) in the non-financial business economy
City regions, 2014
Source: Office for National Statistics
Download this image Figure 8: Distribution of firm level productivity (GVA per worker) in the non-financial business economy
.png (43.2 kB) .xls (34.3 kB)
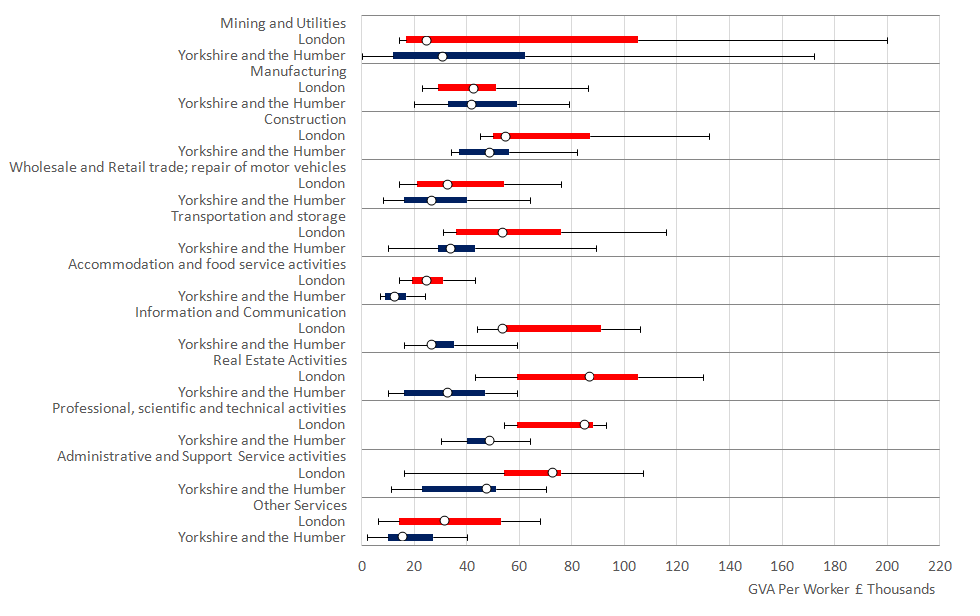
These broad differences in labour productivity at the regional level are replicated in the distributions of labour productivity in different industries and regions. Figure 9 shows the distribution of productivity outcomes in different industries in London and Yorkshire and the Humber. It shows the median level of GVA per worker (the points), the inter-quartile range (the bars) and the 10th and 90th deciles (the lines). It can be seen that the median nominal labour productivity is higher in almost every industry in London and that for a number of service industries the gap is large. It suggests that on this measure, productivity in London is higher in all but Mining and Utilities. These results, alongside a further decomposition analysis of regional productivity, suggest that high-productivity firms are present in each region of Great Britain, and that intra-industry variation in productivity is an important factor in explaining the relatively strong performance of London in particular.
Figure 9: Firm level productivity distributions by Industry
London and Yorkshire and the Humber, 2014
Source: Office for National Statistics
Download this image Figure 9: Firm level productivity distributions by Industry
.png (36.6 kB) .xls (21.0 kB)
6. Management practices and labour productivity
Alongside these estimates of national and sub-national labour productivity, we have also published an analysis of the results of the Management Practices Survey (MPS) of manufacturing enterprises in Great Britain. In an earlier article, we presented early descriptive statistics from this survey of 1,026 manufacturing businesses with 10 or more people in employment, and found the use of structured management practices to be higher among larger businesses, multinationals and, within family-owned businesses, those which are not managed by members of the owning families.
In this productivity release, we take this analysis further, including the relationships between the management practices for these enterprises and their levels of labour productivity. Our analysis finds a positive correlation between management practice scores and their level of labour productivity, measured as gross value added (GVA) per worker (Figure 10). We find that businesses with relatively high management practice scores – including larger businesses, multinationals, non-family-owned, and family-owned but non-family-managed businesses – outperform smaller, domestic and family-owned and family-managed businesses in terms of labour productivity. These high-performing groups however account for a relatively small share of the manufacturing population. After accounting for patterns of business ownership, size, age and industry, we estimate that a 0.1 increase in management score is associated with an increase in labour productivity of 6.7%. Conversely, family-owned businesses are found to be associated with lower levels of productivity, in the region of 20%, after accounting for other factors1, predominantly driven by those firms which are both family-owned and family-managed.
Figure 10: Labour productivity and management practice scores by business types
Great Britain, 2015

Source: Office for National Statistics
Notes:
OPW is output per worker.
Labour productivity is measured as output per worker (GVA/employment) in 2015 current prices.
Population of interest covers manufacturing businesses in Great Britain with employment of at least 10.
Key:
All = All manufacturing (for businesses with at least 10 in employment)
NF = Not family-owned.
F = Family-owned.
FM = Family-owned and family-managed.
FNM = Family-owned and non-family-managed.
D = Domestic.
M = Multinational.
MUK = Multinational with head office based in the UK.
MNUK = Multinational with head office based outside the UK.
Download this image Figure 10: Labour productivity and management practice scores by business types
.png (21.4 kB) .xls (27.6 kB)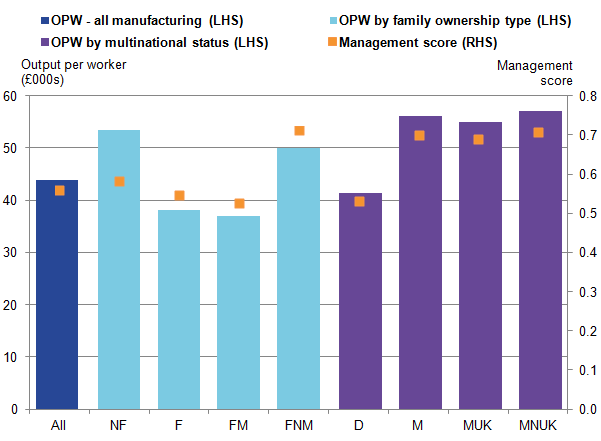
While this research moves us further in establishing a link between management practices and levels of labour productivity in the UK, the wider literature has explored the causal “drivers” of structured management practices (Bloom et al, 2016) and the impact of management practices in explaining within-country and cross-country Total Factor Productivity gaps2. We intend to explore these areas in future work. An MPS pilot for services industries currently under development will allow for a wider scope for comparisons across the manufacturing and services industries in Great Britain. This work will enable an assessment of the importance of management practices for the development of aggregate trends in productivity in recent periods.
Notes for: Management practices and labour productivity
- This result controls for employment size, industry, management score and multinational status.
- Using the US Management and Organizational Practice Survey (MOPS), Bloom et al (2016) examine what drives differences in management, making use in geographic variation within the sample. See accompanying article for more details.
7. International comparisons of productivity and revisions to PPPs
While labour productivity growth has slowed since the onset of the economic downturn, the second of the 2 “puzzles” which characterise the UK’s recent performance is the gap between UK output per hour and that in other countries. Recent revisions to the Purchasing Power Parity (PPP) statistics produced by Eurostat mean that this gap between the UK and other countries is likely to be subject to considerable revision in future releases.
On a biannual basis, we release International Comparisons of Productivity, which contains annual estimates of labour productivity for the G7 economies. To obtain a fair cross-country comparison of productivity, gross domestic product (GDP) estimates in national currencies are converted to a common currency using an exchange rate. Purchasing Power Parities (PPPs), rather than market exchange rates are often used for international comparisons as they better reflect differences in the level of prices between countries1. PPPs are primarily cross-country price indicators rather than time series price indices, and therefore are not normally open to revision beyond the latest 3 years as part of the ongoing production process. However, recent improvements in the measurement of national accounts, driven by the introduction of the European System of National Accounts 2010 (ESA 2010), have had a substantial impact on the level of GDP in many countries and hence triggered the general revision of the PPP time series back to 1995.
The largest impact on the UK’s PPPs has come from the improvements made to the measurement of imputed rental prices in the period prior to 2010. These are the housing services that accrue to households which own a property and reside in it: therefore avoiding the cost of renting an equivalent property, for which a change of source data was made in Blue Book 2016. Figure 11 shows that the UK’s PPP has been revised up in each year between 1995 and 2009, with much smaller revisions to successive years. More information on the improvements in the production of UK Purchasing Power Parities is available on our website.
Figure 11: UK PPP before and after revision
1995 to 2015
Source: Eurostat
Download this chart Figure 11: UK PPP before and after revision
Image .csv .xlsThese revisions to PPPs are likely to have a considerable impact on the UK’s productivity performance relative to other countries, in particular for the earlier years for which the revisions to PPPs are larger. A full international comparisons of productivity release – including the UK’s performance relative to the other individual G7 economies – will be released alongside the April 2017 edition of the Productivity Bulletin.
Notes for: International comparisons of productivity and revisions to PPPs
- For more information, refer to this article explaining the uses and limitations of PPPs.
8. Volume index of capital services
In addition to estimates of labour productivity, this release also contains new information on the volume index of capital services (VICS), which is a key factor in explaining the productivity performance of different industries. In a conventional production function, firms combine factors of production – usually labour and capital – to deliver output. Labour input is usually measured in terms of hours worked, jobs or employment, while two measures of capital are in common use. The first is the capital stock, which measures the value of capital accumulated for production, including physical assets such as machinery, vehicles and buildings and intangible assets such as software and research and development. This measure of capital is a wealth measure – capturing the value of all the assets available for productive use.
However, while the value of available assets for production is important, the preferred measure of capital input for production is capital services: the value which a given asset contributes to production each period. While the capital stock values a machine, for instance, at its resale value, capital services measure the value of the contribution of a machine to the productive process. Under certain assumptions, these services are equal in value to the rental that a firm would pay for the use of an equivalent asset for a given period. It is these capital services which firms combine with labour input to deliver output.
Estimates of the volume index of capital services are published alongside this bulletin, providing estimates for the market sector as a whole and by industry to 2015. They suggest that capital services across the whole market sector grew by 1.8% in 2015, the fastest annual rate since 2008, slightly faster than the growth of comparable market sector capital stocks presented in the capital stocks release, which grew by 1.6% in 2015. As shown in Figure 12, capital services have continued to grow since the economic downturn in many industries, albeit at a slower rate in most industries than in the pre-downturn period. Only Manufacturing (Industry C), Information and Communications (Industry J), and Other Services (Industry RSTU) have experienced a contraction in capital services since 2009.
Figure 12: Compound average annual growth of capital services
1997 to 2009 and 2009 to 2015
Source: Office for National Statistics
Notes:
- A refers to Agriculture, forestry and fishing,
B refers to Mining and quarrying,
C refers to Manufacturing,
DE refers to Electricity, gas, steam and air conditioning supply and Water Supply, Sewerage, Waste Management and Remediation Activities,
F refers to Construction,
G refers to Wholesale and retail trade; repair of motor vehicles,
H refers to Transportation and storage,
I refers to Accommodation and food services,
J refers to Information and communication,
K refers to Financial and insurance activities,
L refers to Real Estate activities,
M refers to Professional, scientific and technical activities,
N refers to Administrative and support service activities,
P refers to Education,
Q refers to Health,
RSTU refers to Other Services.
Download this chart Figure 12: Compound average annual growth of capital services
Image .csv .xlsThese variations in the growth rate of capital services across industries can be combined with changes in the level of labour input to provide insights into changes in labour productivity. All else equal, the larger (smaller) the value of capital services per hour worked, the greater (lower) the productive potential of each worker. As a result, changes in capital services to labour ratios can be instructive for labour productivity. Figure 13 presents the indices of capital services, labour input (in the form of productivity hours) and the capital-services-to-labour-ratio, for the aggregate market sector.
It shows that aggregate capital services increased sharply relative to labour input in the years up to 2008, resulting in an increase in the capital services to labour ratio. Over this period, labour productivity growth appears to have been supported by the growing availability of capital services per hour worked. This effect reached its peak in 2009 – following a sharp fall in hours worked during the economic downturn – this ratio increased quite markedly. However, this increase almost entirely reversed over the 2009 to 2015 period, as hours worked first recovered and then surpassed their pre-downturn level. This form of capital shallowing – as firms increased their labour input more sharply than their capital services – tends to hold back labour productivity, reducing their potential labour productivity growth. The impact of these changes in capital to labour ratios on productivity will be examined in more detail in the Multi-factor Productivity release, planned for publication in April 2017.
Figure 13: Aggregate capital and labour indices
1997 to 2015
Source: Office for National Statistics
Download this chart Figure 13: Aggregate capital and labour indices
Image .csv .xls9. Public service productivity
Alongside measures of whole economy and market sector productivity, we produce a suite of public service productivity measures. On an annual basis, we produce a set of detailed articles which set out the growth rates of inputs, outputs and productivity in the health and education services. These are designed in accordance with the recommendations of the Atkinson Review, and are a form of multi-factor productivity measure – taking into account changes in labour, goods and services and capital inputs, while output is measured in volume terms. As these estimates demand relatively detailed data which is only available with a considerable time-lag, we have also developed a set of experimental quarterly public service productivity estimates, based on the National Accounts. Estimates of quarterly public service productivity to Quarter 3 (July to Sept) 2016 are published alongside this release, as well as the most recent, more detailed public service productivity estimates which run to 2014.
The most recent estimates of public service productivity for healthcare – published alongside this article – suggest that productivity in this public service increased by around 2.3% in 2014: the fifth consecutive year of productivity growth (Figure 16). The annual rate of productivity growth in 2014 was faster than the average annual rate of 0.9% over the period 1997 to 2014, albeit slightly lower than in 2013, and was a consequence of the continued strong growth of output relative to inputs in 2014. Healthcare output – which has increased in every year of available data – grew at its fastest rate since 2008 over this period, continuing the relatively strong output growth of 2013. Healthcare inputs – by contrast – grew at a relatively stable rate over the 2012 to 2014 period. Further analysis on the productivity of publically funded healthcare services can be found in the separate article, Public Service Productivity Estimates: Healthcare, 2014.
Figure 14: Public service healthcare output, inputs and productivity indices and growth rates
UK, 1995 to 2014

Source: Office for National Statistics
Notes:
- Output is quality adjusted
Download this image Figure 14: Public service healthcare output, inputs and productivity indices and growth rates
.png (40.9 kB) .xls (28.7 kB)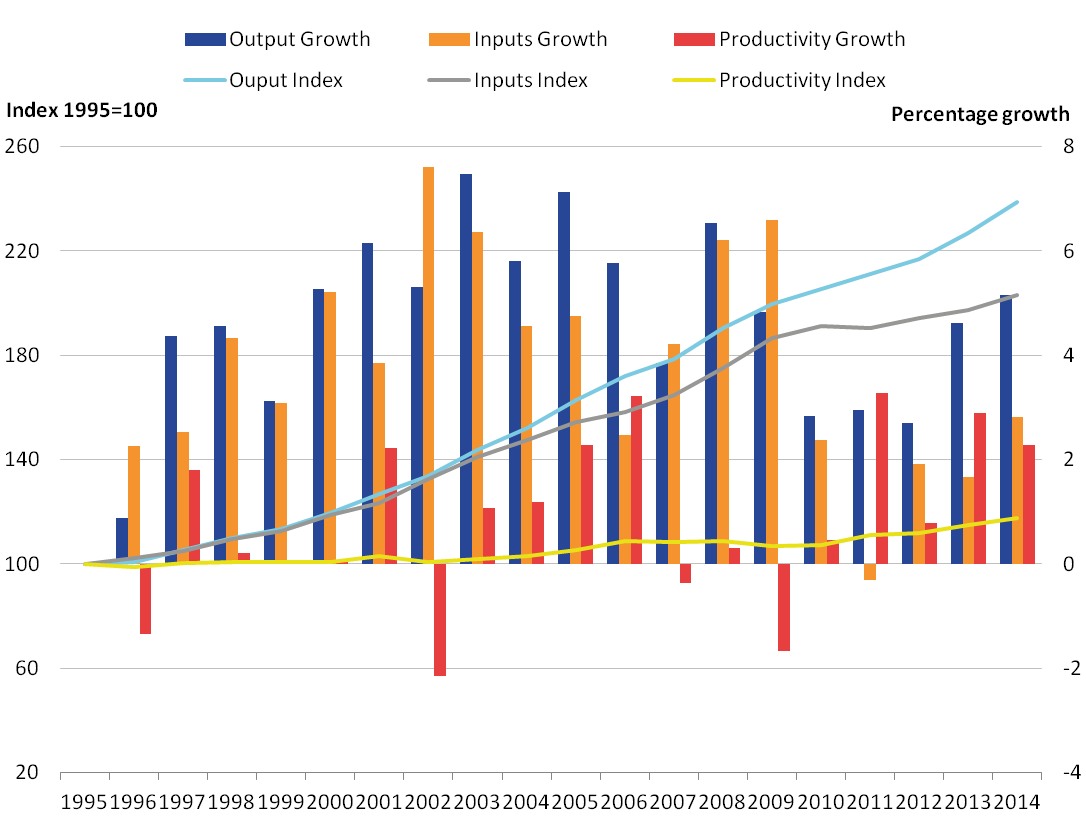
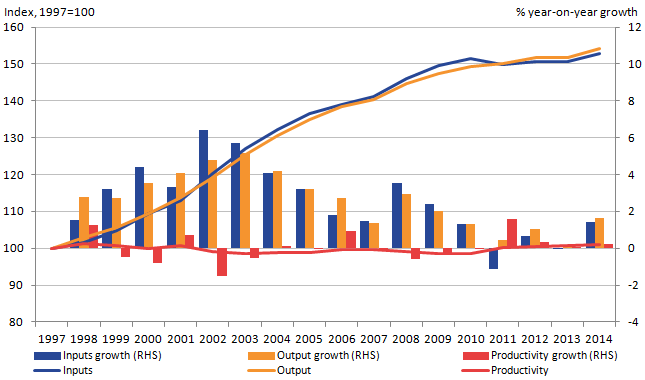
Partly as a consequence of productivity growth in the healthcare service, productivity for total public services grew by 0.2% in 2014 (Figure 15). This follows growth of 0.1% in 2013 and is the fourth consecutive annual increase in total public service productivity. As a consequence, the level of public service productivity in the UK has returned to level comparable to those in 1999 – although remains below its peak in 1998 and has changed very little in aggregate over the past 2 decades. Figure 15 also shows that growth in productivity in 2014 was largely a result of increases in public service output – which grew by 1.6% on the year. This was partially offset by growth in public service inputs, which grew by 1.4% over the same period. This slow growth of productivity reflects the mixed experience of individual public services over within the UK.
Figure 15: Total public service inputs, output and productivity indices and growth rates
UK, 1997 to 2014
Source: Office for National Statistics
Notes:
- RHS stands for right-hand side
- Percentage growth rate shows the year-on-year growth
Download this image Figure 15: Total public service inputs, output and productivity indices and growth rates
.png (21.9 kB) .xls (30.2 kB)
Variation in the relative size and productivity experiences of different service areas means that these public services have made quite different contributions to productivity growth over recent years. Figure 16 shows the annual contribution of each service area to the change in UK total public service productivity (represented by the line) from 1998 to 2014. It highlights that while total public service productivity increased between 2010 and 2014, annual growth has slowed from its peak in 2011. Service areas such as healthcare and public order and safety have provided positive contributions to total productivity growth since 2010, while negative contributions from the education service over the past two years and a negative contribution in 2014 from children’s social care, have meant productivity growth overall for UK public services has slowed.
Figure 16: Contributions to growth of total public service productivity
UK, 1998 to 2014
Source: Office for National Statistics
Notes:
- Individual contributions may not sum to the total due to rounding The above figure does not include indirectly measured output as they do not contribute to productivity due to the assumption their "inputs = output"
ASC refers to Adult social care
CSC refers to Childrens' social care - SSA refers to Social security administration
- POS refers to Public order and safety which includes courts and probation services, prison service and fire service
- Other refers to other government services which includes services such as economic affairs, recreation, and housing
Download this chart Figure 16: Contributions to growth of total public service productivity
Image .csv .xlsAlongside these detailed measures of annual public service productivity by public service, we have continued to develop experimental, more timely measures of aggregate public service productivity. These more timely series – published on a quarterly basis up to and including Quarter 3 2016 – are based on a different methodology which requires less detailed information and is based on a degree of estimation. The results of this alternative methodology suggest that total public service productivity increased by 0.5% in Quarter 3 2016, driven by a fall of 0.5% in the volume of public service inputs while output remained flat (Figure 17). This followed on from a flat productivity performance in Quarter 1 2016 and a fall of 0.3% in Quarter 2 of 2016.
Figure 17: Quarterly total UK public service productivity
Quarter 1 (Jan to Mar) 2011 to Quarter 3 (July to Sept) 2016, seasonally adjusted
Source: Office for National Statistics
Notes:
- All estimates are based on experimental quarterly total public service productivity.
- Estimates of productivity are indirectly seasonally adjusted, calculated using seasonally adjusted inputs and seasonally adjusted outputs.
- RHS stands for right-hand side
- LHS stands for left-hand side.
Download this chart Figure 17: Quarterly total UK public service productivity
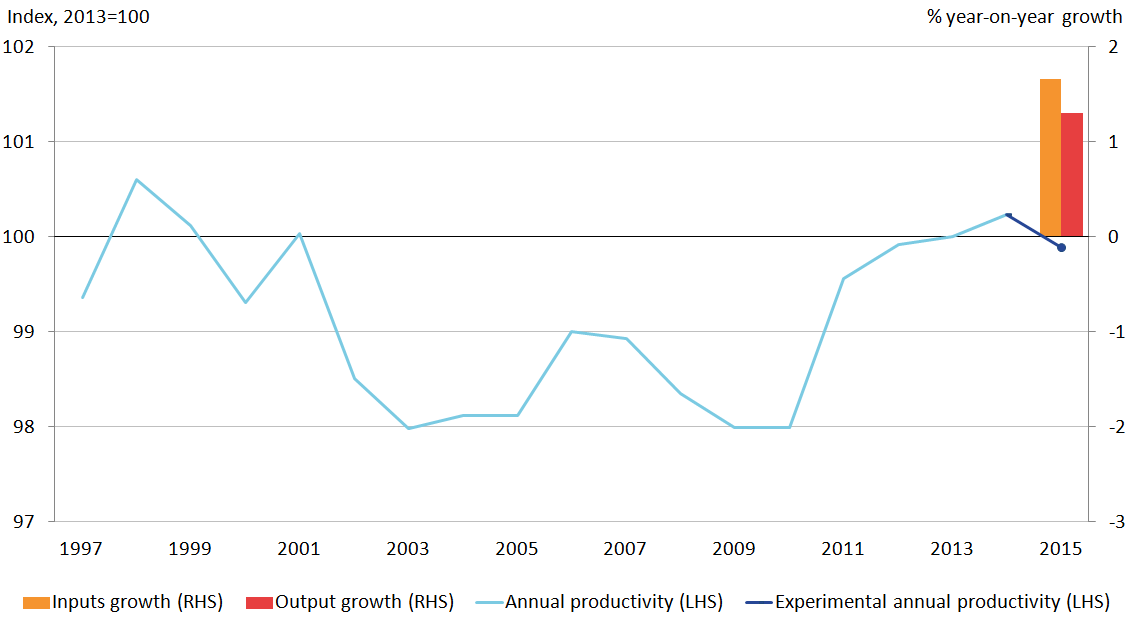
Image .csv .xlsBy taking the annualized growth from the nowcast quarterly series and applying it to the more detailed estimates of public service productivity (shown in Figure 15), the experimental estimates suggest that the productivity of UK public services fell by 0.3% in 20151, as shown in Figure 18. This was driven by growth in public service inputs, which were only partially offset by growth of public service output.
Figure 18: Total UK public service annual productivity with quarterly constructed estimate
1997 to 2015
Source: Office for National Statistics
Notes:
- Estimates for 2015 reflect growth rates of the annualised quarterly total public service productivity applied to the quality adjusted annual total public service productivity.
- RHS stands for right-hand side
- LHS stands for left-hand side
Download this image Figure 18: Total UK public service annual productivity with quarterly constructed estimate
.png (30.1 kB) .xlsx (10.8 kB)
Despite the contraction in the latest, total UK public service productivity have been on an upwards trend over the last 5 years, reaching comparable level to that achieved in 1999. Since 2010, total public service productivity is estimated to have increased by 1.9% or around 0.4% per year.
Notes for: Public service productivity
- Estimates for 2015 reflect growth rates of the annualised quarterly total public service productivity applied to the quality adjusted annual total public service productivity.
Contact details for this Article
Related publications
- Volume index of UK capital services (experimental): estimates to Quarter 2 (Apr to Jun) 2017
- Volume index of UK capital services (experimental): estimates to Quarter 2 (Apr to Jun) 2017
- Regional and sub-regional productivity in the UK: Jan 2017
- Regional firm-level productivity analysis for the non-financial business economy: Jan 2017
- Management practices and productivity in British production and services industries - initial results from the Management and Expectations Survey: 2016
- Public service productivity: quarterly, UK, October to December 2019
- Public service productivity, healthcare, England: financial year ending 2022
- Public service productivity, healthcare, England: financial year ending 2022