Table of contents
- Authors
- Acknowledgements
- Introduction
- Conduct of survey
- Response rates
- Deriving management practice scores
- Weighting
- Results
- Productivity and management score
- Conclusion and next steps
- References
- Annex 1 - Business Characteristics of firms in the Management Practices Survey (MPS) pilot
- Annex 2 - Composition of manufacturing industries by business types
- Annex 3 - Scoring schedule
- Annex 4 - Results for individual questions by size bands
- Annex 5 – Average Management Practice Scores and Output per hour by industry groups
2. Acknowledgements
The authors appreciate contributions from the following people and organisations in developing the Management Practices Survey pilot and analysis: the Annual Business Survey team in ONS, ONS Survey Methodology, ONS Business Data Collection, ONS Telephone Operations, the US Census Bureau, particularly Catherine Buffington and Scott Olmacher, academic experts and the ESRC.
Back to table of contents3. Introduction
The UK’s recent productivity experience is marked by two “puzzles”. Firstly, the UK has experienced a persistent productivity gap compared with most of the major Group of 7 (G7) advanced economies for the past 3 decades1, with measures of output per hour worked consistently lower in the UK than elsewhere. Secondly, along with some of these economies, the UK has experienced a period of relatively stagnant productivity growth since the economic downturn which started in 2008 – the phenomenon known as the “productivity puzzle”. Recent developments in the academic research literature on productivity have shown a strong link between structured management practices among firms and productivity performance2. Management practices and their variations across countries could therefore provide some insight into both the productivity gap and the productivity puzzle. Consequently in 2016, we launched a pilot survey of British manufacturing businesses to gather information on their management practices for the first time.
The pilot Management Practices Survey (MPS) was based on international experience, drawing a selection of key questions on structured management practices from the US Management and Organizational Practices Survey (MOPS). The aspects covered do not exhaust potential areas of interest, but have been found to be highly relevant to business performance. The sample was also designed to enable the responses to be linked at the firm-level with financial data collected through our Annual Business Survey and to link with other business surveys, such as the Community Innovation Survey and E-Commerce survey. As a consequence, the results of this survey can be linked to a wide range of financial and other information, enabling a broad range of analysis. This paper presents information on the survey design, cognitive testing, and initial results, focusing on descriptive statistics on the distribution of structured management practices across various characteristics of manufacturing businesses in Great Britain.
The results of this pilot survey suggest that on average large businesses and multinationals have more structured management practices than smaller businesses. Businesses which are owned by families have less structured management practices – although this is largely due to less structured practices in businesses which are both family-owned and family-managed: businesses which are family-owned but not family-managed have similar levels of structured practices as multinational businesses. There is some variation in average levels of structured practices across industries, with businesses in industrial grouping “Textiles, wearing apparel and leather manufacturers” using the lowest levels of structured practices, whilst businesses in grouping “Chemical, pharmaceutical, rubber, plastics and non-metallic mineral industries” using the highest level of structured practices.
The rest of this paper proceeds as follows. Section 2 sets out the parameters for the conduct of the MPS pilot of the manufacturing industries. Section 3 provides information about the response rate achieved and Section 4 sets out how responses have been scored to produce a single metric on management practices. Section 5 considers the weighting of responses, and Section 6 sets out our key findings. Finally, Section 7 sets out some conclusions and next steps.
Notes for Introduction
Data on International Comparison of Productivity is available on our website.
See Bloom et al. (2013) and Syverson (2011) for further details.
4. Conduct of survey
The manufacturing Management Practice Survey (MPS) pilot was a voluntary survey sent out to 1,026 businesses with employment of ten or more, within manufacturing industries in section C (divisions 10 to 33) of the 2007 Standard Industry Classification (SIC2007)1. The survey was dispatched in March 2016 and businesses were asked to report on their activities in the calendar year 2015 to match the reference period for the Annual Business Survey (ABS) sample from which the MPS sample was drawn. During the data collection period, reminder questionnaires were sent to non-respondents, followed by telephone reminders, during which businesses were given the opportunity to provide data over the telephone.
The MPS survey’s primary aim is to provide new information on the link between businesses’ management practices and their productivity. As such, to maximise the link between management practices and businesses’ financial data, the 2015 ABS sample of manufacturing businesses was used as the sample frame for the MPS. Adopting this sample design will enable us to link the MPS results to financial information from the ABS when these data become available later in 2016. The MPS sample was therefore drawn as a randomly selected stratified sub-sample of the ABS, stratified by industry division, and size of business in terms of employment, for businesses with ten or more in employment. Employment is the total of employees and working proprietors. The ABS sample on the other hand was drawn from the Inter-Departmental Business Register (IDBR), which is a database of all registered businesses in the UK2. The geographic coverage of the MPS was Great Britain, consistent with the scope of our ABS. This is because the Department for Finance and Personnel Northern Ireland (DFPNI) is responsible for conducting the ABS for businesses in Northern Ireland.
The questionnaire for the MPS pilot consisted of a selection of eight key management practices questions, drawn from the 2015 Management and Organisational Practices Survey (MOPS) of the US Census Bureau. The questions covered business practices on production, Key Performance Indicators, targets and employment practices3. The questionnaire also included questions on company ownership4. An initial set of questions were cognitively tested on UK businesses and slightly modified based on feedback from testing, while maintaining consistency with the US MOPS to allow for cross-country comparisons. Respondents were asked to return data for 2015, to match the reference period for the ABS sample of which the MPS sample is a subset.
Notes for Conduct of survey
Details of the 2007 Standard Industry Classification are available on our website.
Details of the conduct of the Annual Business Survey (ABS), including information on the IDBR, can be found in the ABS Quality and Methodology Information note and the ABS Technical Report.
The set of management questions and scoring schedule can be found in Annex 3 of this paper.
Questions on company ownership included two questions on family ownership and two on multinational status.
5. Response rates
The Management Practices Survey (MPS) pilot was conducted on a sample of 1,026 manufacturing businesses in Great Britain, as a voluntary postal survey. Of the businesses sampled, 702 or 68% provided positive usable information, 220 or 21% were contacted but declined to provide data, and 104 or 10% did not reply at all and could not be reached during the telephone follow-up.
Table 1: Response Rates
| Great Britain, 2015 | ||
| Type of Response | Share of sample | Number of respondents |
| Paper response | 52% | 538 |
| Telephone Response | 16% | 164 |
| Non-response | 21% | 220 |
| Unreachable | 10% | 104 |
| TOTAL | 100% | 1,026 |
| Source: Office for National Statistics | ||
Download this table Table 1: Response Rates
.xls (26.6 kB)Figure 1 shows that large businesses with 250 people or more in terms of employment were the least likely to respond to the survey with around 6 in 10 businesses (60%) providing data, compared with at least 7 in 10 businesses (70%) in all other size groups.
Figure 1: Distribution of response rate by employment size band
Great Britain, 2015

Source: Office for National Statistics
Download this image Figure 1: Distribution of response rate by employment size band
.png (10.3 kB) .xls (25.1 kB)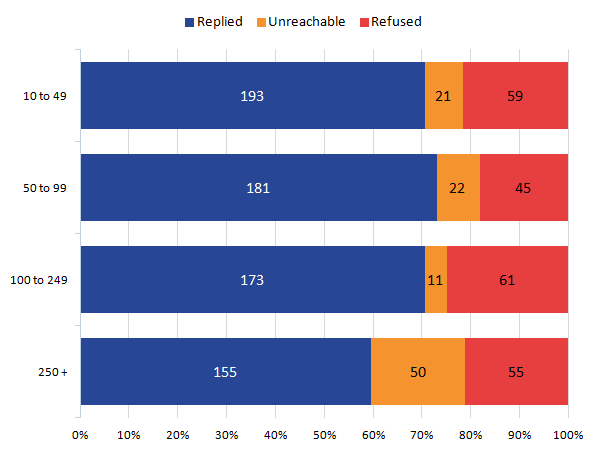
We issued two reminders to non-respondents during the data collection period. The first was through a reminder letter including a duplicate questionnaire, while the second reminder was by telephone, where respondents were given an opportunity to complete the questionnaire over the phone. Out of the 702 businesses that provided data, 164 or 23% provided this information over the telephone. Figure 2 provides a breakdown of positive responses by type of response in each size band. Across the sample of positive responses, the rate of item non-response was very low. When restricting the sample to responses that we have accepted for analysis (based on numbers of questions that have responses), each individual question has fewer than 10 missing responses.
Figure 2: Positive responses by response type and employment size
Great Britain, 2015

Source: Office for National Statistics
Download this image Figure 2: Positive responses by response type and employment size
.png (15.5 kB) .xls (26.6 kB)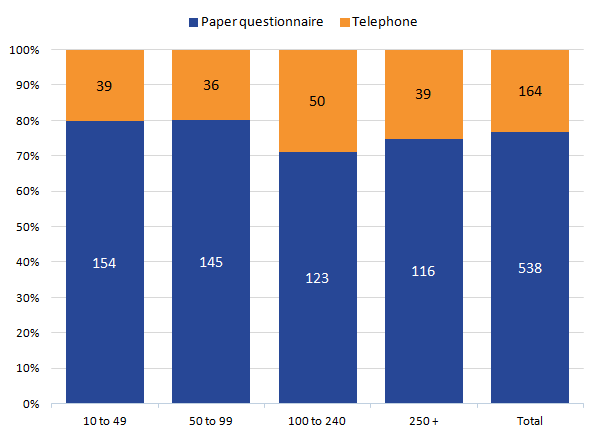
6. Deriving management practice scores
The Management Practices Survey (MPS) questionnaire comprised eight categorical questions on qualitative and quantitative aspects of management practices. Producing meaningful quantitative data for analysis was achieved by deriving management practice scores for each business that provided responses to at least five out of the eight management questions in the questionnaire. The scoring process for the MPS is consistent with that of the US Management and Organizational Practices Survey (MOPS) for similar questions. Scores were awarded to each question on a scale of 0 to 1, where 0 was the least and 1 the most structured practice. Details of the scoring schedule are included in Annex 3. An overall management practice score was derived as a simple average of a business’s score on individual questions.
Out of the 702 businesses that provided data, only 40 provided partial responses and fewer than ten businesses did not meet the criteria of having at least five management practice questions completed. The vast majority are therefore included in the results discussed in subsequent sections of this paper. The size of the sample for this pilot survey is relatively small, therefore results are indicative. All cells for these results contain at least 10 observations to prevent statistical disclosure.
Back to table of contents7. Weighting
Observations are weighted to produce estimates for the population of businesses with employment of at least 10, in the manufacturing industry in Great Britain. Weights have two components: Management Practices Survey (MPS) weights and Annual Business Survey (ABS) design weights. MPS weights are designed to produce estimates at the level of the Annual Business Survey sample, of which the MPS sample is a subset. To produce population level estimates for our population of interest, MPS weights are multiplied by the design weights for the Annual Business Survey. These weights are calculated using the Inter-Departmental Business Register (IDBR) as the survey universe. Further details on ABS design weights can be found in the ABS Quality and Methodology Information note and the ABS Technical Report. References to “All manufacturing” in subsequent sections referred to the manufacturing population to which our sampling relates.
Back to table of contents8. Results
Average management scores for all manufacturing businesses
The mean management practice score for manufacturing businesses in Great Britain in 2015 was 0.56, where the minimum possible score is 0 and the maximum is 1. This reflects variation in the level of structure across different kinds of management practices, as shown in Figure 3, which shows the average score for each question for all manufacturing businesses. While this chart shows the average score for each question, care should be taken in comparing the questions against each other, as they are of varying difficulty and we have not attempted to adjust for this.
Figure 3 shows that manufacturing businesses are more likely to have more structured processes for fixing production problems (Question 1) and the number of key performance indicators they use (Question 2), although the score for Question 3 indicates that key performance indicators were not monitored very frequently by many businesses. The relatively high average score for Question 5 indicates that where businesses set targets, they set stretching but achievable targets, and the score for Question 6 indicates that promotions in manufacturing businesses in 2015 were largely based on performance and ability. Further results by individual question by business size and ownership are available in Annex 4.
Figure 3: Average management score by question for all manufacturing businesses
Great Britain, 2015
Source: Office for National Statistics
Notes:
- KPI stands for Key Performance Indicator
- Population of interest covers manufacturing businesses in Great Britain with employment of at least 10.
Download this chart Figure 3: Average management score by question for all manufacturing businesses
Image .csv .xlsAverage management scores by size bands
The average management practice score across all questions is lowest among small businesses (10 to 49 employment) at 0.51 and increases across the size groups, with the largest businesses (250+ employment) scoring highest at 0.79. The data therefore shows that the prevalence of structured management practices is higher among larger businesses compared with smaller businesses. Figure 4 also shows that there is little difference in average management scores between the two medium size bands, with businesses in the 50 to 99 and 100 to 249 size bands scoring 0.68 and 0.70 respectively.
Figure 4: Average management score by employment size band
Great Britain, 2015
Source: Office for National Statistics
Notes:
- Population of interest covers manufacturing businesses in Great Britain with employment of at least 10.
Download this chart Figure 4: Average management score by employment size band
Image .csv .xlsAverage management scores by family ownership status
The mean management practice score for family-owned manufacturing businesses (0.55) was slightly lower than the industry average of all manufacturing firms (0.56), while the average score for businesses which were not family-owned was 0.59. Among family-owned businesses, those managed by non-family members have more structured management practices with a score of 0.70, compared with family-owned and managed firms with an average score of 0.53. Family owned businesses1, as defined by the outcome of this study make up a majority (64%) of all manufacturing businesses, of which a majority (87%) are owned and managed by a family member. This dominance of family-owned and managed businesses in our sample is reflected in the low overall score for manufacturing businesses as a whole, as shown in Figure 5.
Figure 5: Average management score by family ownership status
Great Britain, 2015
Source: Office for National Statistics
Notes:
- Population of interest covers manufacturing businesses in Great Britain with employment of at least 10.
Download this chart Figure 5: Average management score by family ownership status
Image .csv .xlsAverage management scores by multinational status
As shown in Figure 6, the average management practice score for multinational businesses at 0.71, is 0.15 higher than the average score for all manufacturing firms in general (0.56)2. This indicates that in general, multinational businesses have more structured management practices compared with non-multinationals. The data shows that businesses with international operations have similarly strong management practices irrespective of the location of the parent company. Multinationals with non-UK and UK based parent companies are found to have very similar average scores, at 0.70 and 0.71 respectively, and compare closely with the high average score of family-owned but not family-managed businesses (0.70).
Within manufacturing businesses in general, based on our sample and survey responses, 5.3% of small businesses are multinationals, compared to 36.1% of medium-sized businesses with employment between 50 and 99, 46.1% of medium-sized businesses between 100 and 249, and 81.5% of large businesses. The variation in average scores observed across firm sizes (shown in Figure 4) may therefore be partially due to the increasing share of multinationals across the size bands.
Figure 6: Average management score by multinational status
Great Britain, 2015
Source: Office for National Statistics
Notes:
- Population of interest covers manufacturing businesses in Great Britain with employment of at least 10.
Download this chart Figure 6: Average management score by multinational status
Image .csv .xlsAverage management scores by industry groups
Industry level results are grouped at the subsection level in line with our labour productivity estimates, to prevent statistical disclosure at a more disaggregated level (further details in Annex 1). On average, divisions 20 to 23 (Chemicals, pharmaceuticals, rubber, plastics and non-metallic minerals) have the most structured management practices with a score of 0.63, while divisions 13 to 15 (Textiles, wearing apparel and leather) have the lowest, and are the only divisions with a mean score below 0.5, at 0.42.
These industry scores may be driven by a combination of the level of family ownership, share of multinational business, and size distribution of businesses in these industries. For instance, divisions 13 to 15 (Textiles, wearing apparel and leather) have a high share of family-owned businesses (78.0% of total) and low share of multinationals (8.0%), with 85.8% of businesses in these divisions within the small employment size band (10-49 employment). These characteristics are shown to be associated with low management practice scores.
By contrast, a relatively smaller share of businesses in divisions 20 to 23 (Chemicals, pharmaceuticals, rubber, plastics and non-metallic minerals) are small (65.4%), and are family-owned (62.7%), while a larger share are multinationals, at 29.3%. Further details are included in Annex 2.
Except for the 2 industry groupings at the highest and 2 at the lowest end of the score range, that is “Chemicals, pharmaceuticals, rubber, plastics and non-metallic minerals” divisions and “Food, beverages and tobacco” divisions at the highest end, and “Coke, petroleum and other” divisions and “Textile wearing apparel and leather” divisions, at the lowest end, the mean management practice score for other divisions within the manufacturing industry are broadly similar to the industry average of 0.56.
Figure 7: Average management score by industry groups
Great Britain, 2015
Source: Office for National Statistics
Notes:
- Population of interest covers manufacturing businesses in Great Britain with employment of at least 10.
Download this chart Figure 7: Average management score by industry groups
Image .csv .xlsDistribution of average management scores across size bands
Figure 8 shows that similar to the trend for manufacturing businesses as a whole (in Figure 4), average scores among family-owned businesses vary with the size of the business, with higher mean scores among larger than among smaller businesses. The data shows that the prevalence of structured management practices is lower among family-owned and managed businesses irrespective of the size of the business, compared with family-owned but not family-managed businesses. The case is particularly clear for small businesses with employment between 10 and 49.
Figure 8: Average management score by family ownership status and employment size band
Great Britain, 2015
Source: Office for National Statistics
Notes:
- Population of interest covers manufacturing businesses in Great Britain with employment of at least 10.
Download this chart Figure 8: Average management score by family ownership status and employment size band
Image .csv .xlsWhen disaggregating industry scores by employment size, a few cases are particularly notable. The relatively low average score for the Textiles, wearing apparel and leather divisions, reflect the fact that businesses in this division had the lowest scores within the 10 to 49 and 50 to 99 employment bands across all industry groups, at 0.39 and 0.57 respectively. This division also had one of the lowest scores among large businesses, with a score of 0.76 for businesses with 250 or more in their employment.
In comparison, businesses in the “Chemicals, pharmaceuticals, rubber, plastics and non-metallic minerals” divisions have relatively high scores across all size groups, with the highest score of 0.57 for small businesses (10 to 49 employment), the second-highest score for both medium-sized businesses with employment between 100 and 249 and large businesses (employment of at least 250) (at 0.73 and 0.82 respectively). This division has the third-highest score for businesses with employment between 50 and 99, at 0.70.
The other divisions have a more mixed relative performance across the size categories, with “Machinery, equipment and transport equipment” (divisions 28 to 30) having the highest score for businesses with employment between 100 and 249, but the lowest score for large businesses. Similarly, “Basic metals and metal products” (divisions 24 and 25) have the second-highest score at 0.70 for businesses with employment between 50 and 99, but the lowest score at 0.61 for businesses with employment between 100 and 249.
The highest score for large businesses, with employment of at least 250, is divisions 10 to 12 (food, beverages and tobacco), with a score of 0.84.
Figure 9: Average management score by industry group and employment size band
Great Britain, 2015
Source: Office for National Statistics
Notes:
- Population of interest covers manufacturing businesses in Great Britain with employment of at least 10.
Download this chart Figure 9: Average management score by industry group and employment size band
Image .csv .xlsAverage management scores by quintiles
This section presents the mean management scores by quintile for all manufacturing businesses, family-owned businesses, multinational businesses, and all manufacturing across size bands. For each series presented, we calculated the deciles for the relevant businesses and took the average score for each quintile. The first quintile is the 20% of observations with the lowest scores and the fifth quintile is the 20% of observations with the highest scores. Observations are weighted so they are representative of all manufacturing businesses in Great Britain.
Figure 10: Average management score by quintile and family ownership status
Great Britain, 2015
Source: Office for National Statistics
Notes:
- Population of interest covers manufacturing businesses in Great Britain with employment of at least 10.
Download this chart Figure 10: Average management score by quintile and family ownership status
Image .csv .xlsOn average, family-owned businesses perform similarly to or slightly lower than the average scores for all manufacturing across the distribution. However, family-owned but not family-managed businesses have considerably more structured management practices at the lower end of the distribution, so the overall distribution of scores for businesses which are family-owned but not family-managed is more concentrated among higher scores.
Multinational businesses perform much higher than the industry average across the distribution, with very little difference between multinationals with head offices located within or outside the UK. There is also very little difference in average scores per quintile between multinationals and family-owned but not family-managed businesses.
Figure 11: Average management score by quintile and multinational status
Great Britain, 2015
Source: Office for National Statistics
Notes:
- Population of interest covers manufacturing businesses in Great Britain with employment of at least 10.
Download this chart Figure 11: Average management score by quintile and multinational status
Image .csv .xlsAs shown in Figure 12, the average management score by quintile is lowest for small businesses and highest for large businesses. There is little difference in average score between the smaller and larger medium-sized businesses (employment of 50 to 99 and employment of 100 to 249 respectively) across the quintiles, particularly in the top two quintiles (top 40% of the distribution).
The difference in average score between the lowest and highest quintile for small businesses is 0.56, indicating a wide spread in scores, and limited use of structured management practices among a large share of small businesses. The difference is much smaller for large businesses, at 0.29, with an average score of 0.64 for the lowest quintile, indicating that even businesses in the lower end of the distribution use structured practices extensively.
Figure 12: Average management score by quintile and employment size band
Great Britain, 2015
Source: Office for National Statistics
Notes:
- Population of interest covers manufacturing businesses in Great Britain with employment of at least 10.
Download this chart Figure 12: Average management score by quintile and employment size band
Image .csv .xlsNotes for Results
Within our sample we define businesses as family-owned if respondents indicate that the business is owned by either the founder, a relative of the founder or a family which is not related to the founder. The other option available to respondents is that the business is not family-owned. We identify family-owned and managed businesses by asking whether the Managing Director of the business is a member of the owning family.
Multinational businesses are identified by whether they respond “Yes” to the question “Is this business part of a multinational business which has units in other countries?”. We describe businesses as UK-based multinationals if they answer yes to the above question, and also indicate that the location of their head office is within the UK, and similarly we describe businesses as non-UK multinationals if they indicate that the location of their head office is outside the UK.
9. Productivity and management score
The primary aim of the management practice survey is to analyse the relationship between businesses’ management practices and their performance, in terms of their labour productivity. As an initial step, we examine the correlation between industry-level management scores and published industry level measures of labour productivity for 2015 on an output per hour basis, where output is Gross Value Added (GVA). As shown in Figure 13, we find a positive relationship between the level of structured management practices and labour productivity at the industry level, with a correlation coefficient of 0.551. Care should be taken when interpreting these figures, as the measures of labour productivity used relate to the UK as a whole and therefore not consistent with the Management Practices Survey (MPS) scores which exclude Northern Ireland. This analysis does not allow for conclusions on any potential causal aspect to this relationship, however, future work in this area will examine productivity relationships and causality at the business level at a consistent level.
Figure 13: Correlation between management score and labour productivity at the industry level
UK and Great Britain, 2015

Source: Office for National Statistics
Notes:
- Population of interest for MPS covers manufacturing businesses in Great Britain with employment of at least 10.
Download this image Figure 13: Correlation between management score and labour productivity at the industry level
.png (10.1 kB) .xls (17.4 kB)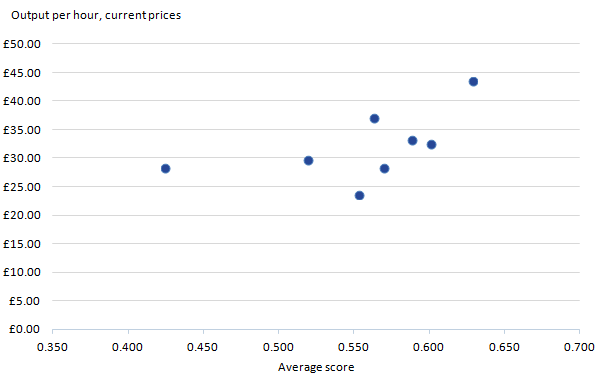
Notes for Productivity and management score
- Details of mean management practice scores and output per hour for each industry group is presented in Annex 5.
10. Conclusion and next steps
The manufacturing industry demonstrates clear variation in use of structured management practices. Large businesses and multinationals make more use of structured practices, while small and family-owned and managed businesses use fewer structured practices on average. However, looking within quintile distributions, we find that among the small and family-owned and managed categories, which generally use fewer structured practices, some businesses do make use of more structured practices.
The data presents interesting homogeniety, once the highest and lowest performing industries are excluded, although it is notable that the lowest scoring industry also has a high share of small businesses and a low share of multinationals.
An initial comparison of average management scores against published labour productivity estimates measured by output per hour shows a positive relationship between average management scores and levels of labour productivity at an industry level.
Future work in this area will look to link Management Practices Survey (MPS) and Annual Business Survey (ABS) data for businesses with both survey responses. This will enable detailed analysis of business performance, including labour productivity, against data on management practices.
We are also developing a companion pilot to collect management practices information in a wide range of services industries. The questionnaire design will enable comparison across services industries with manufacturing industries within Great Britain. Analysis using management practice data on services industries will be published in 2017.
Back to table of contents11. References
Bloom, Nicholas, Erik Brynjolfsson, Lucia Foster, Ron Jarmin, Itay Saporta-Eksten & John Van Reenen, 2013, "Management in America”, Working Papers 13-01, Center for Economic Studies, U.S. Census Bureau
Syverson, Chad, 2011, "What Determines Productivity?", Journal of Economic Literature, American Economic Association, vol. 49(2), pages 326-65
Back to table of contents12. Annex 1 - Business Characteristics of firms in the Management Practices Survey (MPS) pilot
We present results on average management scores and the distribution of scores based on several characteristics:
Industry
Results by industry are based on industry divisions, grouped to avoid disclosure, and in line with our labour productivity estimates where possible. We use the following groups:
Food, beverages and tobacco (SIC 2007 divisions 10 to 12)
Textiles, wearing apparel and leather (SIC 2007 divisions 13 to 15)
Wood, paper products and printing (SIC 2007 divisions 16 to 18)
Chemicals, Pharmaceuticals, rubber, plastics and non-metallic minerals (SIC 2007 divisions 20 to 23)
Basic metals and metal products (SIC 2007 divisions 24 to 25)
Computer etc products, Electrical equipment (SIC 2007 divisions 26 to 27)
Machinery and equipment, Transport equipment (SIC 2007 divisions 28 to 30)
Coke and petroleum ,and Other (SIC 2007 divisions 19 and 31 to 33)
Size
Results by business size are based on employment, for small, medium and large businesses. Employment includes all employees and any working proprietors. Small businesses include those with employment between 10 and 49, medium businesses are between 50 and 249, and large businesses have employment of at least 250. We further split medium businesses between those with employment of 50 to 99 and those with employment of 100 to 249.
Family ownership
We included questions on whether the business was family-owned and if so, whether the managing director is a member of the owning family, to identify family-owned businesses and differentiate between businesses which were both family-owned and family run, and those with external senior management.
Multinationals
We asked respondents whether their businesses had units in other countries to identify multinational businesses. We further asked those who responded affirmatively whether they had their head office outside the UK, to distinguish between UK-based and non-UK based multinational businesses. We further compared our results for these questions with data held on the Interdepartmental Business Register (IDBR) with information on business ownership and found a close relationship, which validated our response. In this article we present analysis based on the data collected in the MPS.
Back to table of contents13. Annex 2 - Composition of manufacturing industries by business types
This annex includes information on the distribution of various firm characteristics. Table 2 presents information on industry composition by business size, showing what percentage of businesses in each industry fall into each size band. Table 3 and Table 4 present information on how many businesses in each industry are family-owned and how many are multinationals respectively; Table 5 and Table 6 present similar information but by business size bands rather than industry.
Table 2: Distribution of businesses by employment size bands and industry groups
| Great Britain, 2015 | |||||
| Manufacturing subsections | 10 to 49 | 50 to 99 | 100 to 249 | 250+ | TOTAL |
| Food, beverages and tobacco (10 to 12) | 67.7% | 13.5% | 9.4% | 9.4% | 100% |
| Textiles, wearing apparel and leather (13 to 15) | 85.8% | 7.5% | 5.1% | 1.5% | 100% |
| Wood, paper products and printing (16 to 18) | 76.8% | 13.0% | 6.1% | 4.1% | 100% |
| Chemicals, Pharmaceuticals, rubber, plastics and non-metallic minerals (20 to 23) | 65.4% | 17.0% | 11.5% | 6.2% | 100% |
| Basic metals and metal products (24 to 25) | 77.6% | 15.2% | 4.1% | 3.1% | 100% |
| Computer etc products, Electrical equipment (26 to 27) | 69.2% | 17.5% | 8.3% | 5.0% | 100% |
| Machinery and equipment, Transport equipment (28 to 30) | 72.0% | 12.2% | 8.4% | 7.4% | 100% |
| Coke and Petroleum, Other (19 and 31 to 33) | 80.0% | 10.0% | 6.0% | 4.0% | 100% |
| TOTAL | 74.0% | 13.6% | 7.3% | 5.1% | 100% |
| Source: Office for National Statistics | |||||
Download this table Table 2: Distribution of businesses by employment size bands and industry groups
.xls (28.2 kB)
Table 3: Share of family owned businesses by industry groups
| Great Britain, 2015 | |
| Manufacturing subsections | Share of businesses which are family-owned |
| Food, beverages and tobacco (10 to 12) | 83.0% |
| Textiles, wearing apparel and leather (13 to 15) | 78.0% |
| Wood, paper products and printing (16 to 18) | 67.6% |
| Chemicals, Pharmaceuticals, rubber, plastics and non-metallic minerals (20 to 23) | 62.7% |
| Basic metals and metal products (24 to 25) | 63.4% |
| Computer etc products, Electrical equipment (26 to 27) | 48.3% |
| Machinery and equipment, Transport equipment (28 to 30) | 52.5% |
| Coke and Petroleum, Other (19 and 31 to 33) | 58.9% |
| All Manufacturing | 63.7% |
| Source: Office for National Statistics | |
Download this table Table 3: Share of family owned businesses by industry groups
.xls (27.1 kB)
Table 4: Share of multinational businesses by industry groups
| Great Britain, 2015 | |
| Manufacturing subsections | Share of businesses which are Multinationals |
| Food, beverages and tobacco (10 to 12) | 9.9% |
| Textiles, wearing apparel and leather (13 to 15) | 8.0% |
| Wood, paper products and printing (16 to 18) | 10.2% |
| Chemicals, Pharmaceuticals, rubber, plastics and non-metallic minerals (20 to 23) | 29.3% |
| Basic metals and metal products (24 to 25) | 11.6% |
| Computer etc products, Electrical equipment (26 to 27) | 21.1% |
| Machinery and equipment, Transport equipment (28 to 30) | 20.5% |
| Coke and Petroleum, Other (19 and 31 to 33) | 17.7% |
| All Manufacturing | 16.4% |
| Source: Office for National Statistics | |
Download this table Table 4: Share of multinational businesses by industry groups
.xls (27.1 kB)
Table 5: Share of family owned businesses by employment size band
| Great Britain, 2015 | |
| Business size | Share of businesses which are family-owned |
| Small (10 to 49 employment) | 68.5% |
| Medium (band 1) (50 to 99 employment) | 56.3% |
| Medium (band 2) (100 to 249 employment) | 52.6% |
| Large (250+ employment) | 28.6% |
| All Manufacturing | 63.7% |
| Source: Office for National Statistics | |
Download this table Table 5: Share of family owned businesses by employment size band
.xls (26.6 kB)
Table 6: Share of multinational businesses by employment size band
| Great Britain, 2015 | |
| Business size | Share of businesses which are Multinationals |
| Small (10 to 49 employment) | 5.3% |
| Medium (band 1) (50 to 99 employment) | 36.1% |
| Medium (band 2) (100 to 249 employment) | 46.1% |
| Large (250+ employment) | 81.5% |
| All Manufacturing | 16.4% |
| Source: Office for National Statistics | |
Download this table Table 6: Share of multinational businesses by employment size band
.xls (26.6 kB)14. Annex 3 - Scoring schedule
This annex includes details of the survey questions on management practices and how responses were scored. For unanswered questions, individual question scores were left as missing. The average score for the business is the mean score for all questions with a non-missing score value.
Table 7: Scoring system of the Management Practices Survey by question
| Question | Score | ||
| 1 | In 2015, what generally best describes what happened at this business when a production problem arose? | ||
| a | We fixed it but did not take further action | 1/3 | |
| b | We fixed it and took action to make sure that it did not happen again | 2/3 | |
| c | We fixed it and took action to make sure that it did not happen again, and had a continuous improvement process to anticipate problems like these in advance | 1 | |
| d | No action was taken | 0 | |
| 2 | In 2015, how many key performance indicators were monitored at this business? | ||
| a | 1 to 2 key performance indicators | 1/3 | |
| b | 3 to 9 key performance indicators | 2/3 | |
| c | 10 or more key performance indicators | 1 | |
| d | No key performance indicators | 0 | |
| 31 | In 2015, how frequently were the key performance indicators reviewed at this business? | ||
| a | Annually | 1/6 | |
| b | Quarterly | 1/3 | |
| c | Monthly | 1/2 | |
| d | Weekly | 2/3 | |
| e | Daily | 5/6 | |
| f | Hourly or more frequently | 1 | |
| g | Never | 0 | |
| 4 | In 2015, what best describes the time frame of production targets at this business? | ||
| a | Main focus was on short-term (less than one year) production targets | 1/3 | |
| b | Main focus was on long-term (more than one year) production targets | 2/3 | |
| c | Combination of short-term and long-term production targets | 1 | |
| d | No production targets | 0 | |
| 52 | In 2015, how easy or difficult was it for this business to achieve its production targets? | ||
| a | Possible to achieve without much effort | 0 | |
| b | Possible to achieve with some effort | 1/2 | |
| c | Possible to achieve with normal amount of effort | 3/4 | |
| d | Possible to achieve with more than normal effort | 1 | |
| e | Only possible to achieve with extraordinary effort | 1/4 | |
| 6 | In 2015, how were employees usually promoted at this business? | ||
| a | Promotions were based solely on performance and ability | 1 | |
| b | Promotions were based partly on performance and ability, and partly on other factors, such as tenure | 2/3 | |
| c | Promotions were based mainly on factors other than performance and ability, such as tenure | 1/3 | |
| d | Employees are normally not promoted | 0 | |
| 7 | In 2015, when was an under-performing employee moved from their current role? | ||
| a | Within 6 months of identifying employee under-performance | 1 | |
| b | After 6 months of identifying employee under-performance | 1/2 | |
| c | Rarely or never | 0 | |
| 8 | In 2015, who made decisions over the hiring of permanent full-time employees? | ||
| a | Only the owner(s) | 0 | |
| b | Mostly the owner(s) with some input from other employees | 1/3 | |
| c | Jointly the owner(s) and other employees | 2/3 | |
| d | Other employees | 1 | |
| Source: Office for National Statistics | |||
| Notes: | |||
| 1. For Question 3 respondents were asked to mark all options which applied. The score was determined by the most frequent option selected. Where respondents marked for Question 2 that they had no key performance indicators, they were given a score of zero. | |||
| 2. Where respondents indicated in question 4 that they did not use targets, they were given a score of zero for question 5. | |||
Download this table Table 7: Scoring system of the Management Practices Survey by question
.xls (33.8 kB)15. Annex 4 - Results for individual questions by size bands
We present average scores for each question. Figure 14 displays average score per question for all manufacturing firms by size. Figure 15 displays the same results but for family-owned businesses only, Figure 16 displays results for family-owned and run businesses and Figure 17 displays results for multinational businesses.
Figure 14: Average score by question for all manufacturing businesses
Great Britain, 2015
Source: Office for National Statistics
Notes:
- Population of interest covers manufacturing businesses in Great Britain with employment of at least 10.
Download this chart Figure 14: Average score by question for all manufacturing businesses
Image .csv .xls
Figure 15: Average score by question for family-owned businesses
Great Britain, 2015
Source: Office for National Statistics
Notes:
- Population of interest covers manufacturing businesses in Great Britain with employment of at least 10.
Download this chart Figure 15: Average score by question for family-owned businesses
Image .csv .xls
Figure 16: Average score by question for family-owned and run business
Great Britain, 2015
Source: Office for National Statistics
Notes:
- Population of interest covers manufacturing businesses in Great Britain with employment of at least 10.
Download this chart Figure 16: Average score by question for family-owned and run business
Image .csv .xls
Figure 17: Average score by question for multinational businesses
Great Britain, 2015
Source: Office for National Statistics
Notes:
- Population of interest covers manufacturing businesses in Great Britain with employment of at least 10.
Download this chart Figure 17: Average score by question for multinational businesses
Image .csv .xls16. Annex 5 – Average Management Practice Scores and Output per hour by industry groups
Table 8: Industry level management scores and output per hour
| Great Britain, 2015 | ||
| Industry Grouping | Mean Management Score (2015) | Output per hour (2015, current prices) |
| Chemicals, Pharmaceuticals, rubber, plastics and non-metallic minerals (20 to 23) | 0.63 | £43.56 |
| Food, beverages and tobacco (10 to 12) | 0.60 | £32.60 |
| Computer etc products, Electrical equipment (26 to 27) | 0.59 | £33.39 |
| Basic metals and metal products (24 to 25) | 0.57 | £28.49 |
| Machinery and equipment, Transport equipment (28 to 30) | 0.56 | £37.15 |
| Wood, paper products and printing (16 to 18) | 0.55 | £23.76 |
| Coke and Petroleum, Other (19 and 31 to 33) | 0.52 | £29.79 |
| Textiles, wearing apparel and leather (13 to 15) | 0.42 | £28.44 |
| All Manufacturing | 0.56 | £33.36 |
| Source: Office for National Statistics | ||
Download this table Table 8: Industry level management scores and output per hour
.xls (27.6 kB)Contact details for this Article
Related publications
- Productivity flash estimate and overview, UK: January to March 2026 and October to December 2025
- Labour productivity, UK: October to December 2019
- Measuring output in the Information Communication and Telecommunications industries: 2016
- Quality adjusted labour input: UK estimates to 2016
- International comparisons of UK productivity (ICP), first estimates: 2016
- Developing labour market metrics for the market sector, UK: 2016
- Public service productivity: quarterly, UK, October to December 2019
- Management practices and productivity in British production and services industries - initial results from the Management and Expectations Survey: 2016