Table of contents
- Main points
- Death registrations and the overall mortality rate for December 2020
- Deaths due to COVID-19 registered in December 2020
- Leading causes of death
- Age-standardised mortality rates by sex and age group, in December 2020
- Provisional deaths registered in 2020
- Death occurrences in December 2020 and year-to-date
- Monthly mortality data
- Glossary
- Measuring the data
- Strengths and limitations
- Related links
1. Main points
In December 2020, there were 52,676 deaths registered in England, 10,594 deaths (25.2%) more than the five-year average (2015 to 2019) for December; in Wales, there were 3,941 deaths registered, 1,075 deaths (37.5%) more than the five-year average for December.
The coronavirus (COVID-19) was the leading cause of death in December 2020 for the second consecutive month in both England (accounting for 20.8% of all deaths registered in December) and in Wales (27.4% of all deaths); dementia and Alzheimer's disease was the second leading cause of death in both countries, with COVID-19 accounting for more than double the second leading cause in England and more than triple in Wales.
Based on provisional data for January to December 2020, COVID-19 was the leading cause of death in England and Wales, with dementia and Alzheimer's disease being the second most common cause of death.
The age-standardised mortality rate of deaths due to COVID-19 in December 2020 was 233.6 deaths per 100,000 people in England and 374.4 deaths per 100,000 people in Wales; the COVID-19 mortality rate significantly increased for the fourth consecutive month in England and the third consecutive month in Wales.
In December 2020, Yorkshire and The Humber was the English region with the highest mortality rate for deaths due to COVID-19 (320.5 deaths per 100,000 people), followed by the East Midlands (316.0 deaths per 100,000 people); the South West had the lowest COVID-19 mortality rate, at 123.1 deaths per 100,000 people.
In England, the mortality rate for deaths due to COVID-19 in December 2020 in the most deprived areas was 391.6 deaths per 100,000 people; this was more than 2.5 times the mortality rate in the least deprived areas (152.3 deaths per 100,000 people).
In Wales, the COVID-19 mortality rate in the most deprived areas was nearly twice the mortality rate in the least deprived areas (560.0 deaths per 100,000 people in the most deprived areas, 285.9 deaths per 100,000 people in the least deprived areas).
This month’s bulletin includes an interactive map of deaths due to COVID-19 in each Middle layer Super Output Area (see Section 3). The accompanying datasets also include mortality rates for deaths due to COVID-19 by local area (up to November 2020) and deprivation, and deaths involving COVID-19 for the UK.
2. Death registrations and the overall mortality rate for December 2020
Based on provisional data, there were 52,676 deaths registered in England in December 2020. This was 8,390 more deaths than in December 2019 and 10,594 deaths more than the five-year average (2015 to 2019). Of the deaths registered in December 2020, 26,981 were males and 25,695 were females.
In Wales, the provisional number of deaths registered in December 2020 was 3, 941. This was 851 more deaths than in December 2019 and 1,075 more deaths than the five-year average for December. Of the deaths registered in December in Wales, there were 2,047 male deaths and 1,894 female deaths.
Age-standardised mortality rates (ASMRs) are used for comparisons over time rather than numbers of deaths, as ASMRs account for changes to the population size and age structure. In England, December 2003 was the year with the highest mortality rate since our data time series began in 2001. Since then, mortality rates in England for the month of December had been generally decreasing from 1,407.6 deaths per 100,000 people in 2003, to a low of 853.7 deaths per 100,000 people in December 2018. The statistically significant decrease in age-standardised mortality rates from 2003 was seen in both males and females (Figure 1). But since 2018, the mortality rate has increased each year.
In England, the December 2020 mortality rate (1,123.6 deaths per 100,000 people) was significantly higher than the mortality rate in every year back to December 2010 (1,151.2 deaths per 100,000 people) but remained significantly lower than December 2003 (the highest mortality rate in this analysis; 1,407.6 deaths per 100,000 people). The mortality rate in December 2020 was 1,339.8 deaths per 100,000 males (compared with 1,674.7 in December 2003) and 950.4 deaths per 100,000 females (compared with 1,217.4 in December 2003).
In Wales, 2003 was also the year with the highest December mortality rate since our data time series began in 2001. Over time, mortality rates in Wales have decreased from 1,470.3 deaths per 100,000 people in December 2003 to a low of 976.3 deaths per 100,000 people in December 2018. Since 2018, the December mortality rate for Wales has increased each year. In December 2020, the mortality rate significantly increased (compared with December 2019) to 1,373.9 deaths per 100,000 people; this increase was seen in both males and females. The December 2020 mortality rate was significantly higher than the mortality rate in every year back to December 2008, and was only significantly lower than December 2003 (the highest December mortality rate in our data time series).
Figure 1: Mortality rates for the month of December significantly increased in 2019 and 2020
Age-standardised mortality rates by sex, England and Wales, deaths registered in December 2001 to December 2020
Source: Office for National Statistics – Monthly mortality analysis
Notes:
- Age-standardised mortality rates per 100,000 people, standardised to the 2013 European Standard Population. Monthly rates in this bulletin are adjusted to allow for comparisons with annual rates. For more information, see Section 10: Measuring the data.
- Figures are for deaths registered rather than deaths occurring in each period.
- Figures for 2020 are based on provisional mortality data and projected populations.
- Figures exclude non-residents.
Download this chart Figure 1: Mortality rates for the month of December significantly increased in 2019 and 2020
Image .csv .xls3. Deaths due to COVID-19 registered in December 2020
The doctor certifying a death can list all causes in the chain of events that led to the death and pre-existing conditions that may have contributed to the death. Using this information, we determine an underlying cause of death. More information on this process can be found in our user guide. In most cases (90.2% in England and 88.2% in Wales) where the coronavirus (COVID-19) was mentioned on the death certificate, it was found to be the underlying cause of death. For more information on our definition of COVID-19 deaths, see Section 10: Measuring the data.
In this bulletin, we use the term “due to COVID-19” when referring only to deaths with an underlying cause of death of COVID-19 and we use the term “involving COVID-19” when referring to deaths that had COVID-19 mentioned anywhere on the death certificate, whether as an underlying cause or not.
Of the 52,676 deaths registered in December 2020 in England, 20.8% (10,973 deaths) were due to COVID-19. This is the highest proportion seen in England since May 2020 (when 23.1% of all deaths were due to COVID-19). Taking into account all deaths involving COVID-19 increases the percentage to 24.3% of all deaths (12,797 deaths) in England in December 2020.
In Wales, 27.4% of the 3,941 deaths registered in December 2020 were due to COVID-19 (1,081 deaths), the highest proportion seen in Wales since April 2020 (when 30.1% of all deaths were due to COVID-19). Taking into account all deaths involving COVID-19 increases the percentage to 31.3% of all deaths (1,233 deaths) in Wales.
Deaths due to COVID-19 in England and Wales
When adjusting for the size and age structure of the population, age-standardised mortality rates (ASMRs) for deaths due to COVID-19 in both England and Wales have increased significantly each month between October and December 2020 (Figure 2). In England, the ASMR for deaths due to COVID-19 significantly increased for the fourth consecutive month, with a rate of 233.6 deaths per 100,000 people in December 2020 due to COVID-19. In Wales, the ASMR for deaths due to COVID-19 significantly increased for the third consecutive month, with a rate of 374.4 deaths per 100,000 people in December 2020. The rate of deaths due to COVID-19 was significantly higher in Wales than in England, also for the third consecutive month.
Although mortality rates due to COVID-19 have increased between October and December 2020, these remain significantly lower than in April 2020 (when both England and Wales experienced the highest COVID-19 mortality rates). In England, the ASMR due to COVID-19 in December 2020 was 62.5% lower than in April 2020 (623.2 deaths per 100,000 people). In Wales, the ASMR due to COVID-19 in December 2020 was 24.4% lower than in April 2020 (495.1 deaths per 100,000 people).
Figure 2: Mortality rates due to COVID-19 in December 2020 increased for the fourth consecutive month in England and the third consecutive month in Wales
Age-standardised mortality rates for deaths due to COVID-19, per 100,000 people, England and Wales, deaths registered in March to December 2020
Source: Office for National Statistics – Monthly mortality analysis
Notes:
- Age-standardised mortality rates per 100,000 people, standardised to the 2013 European Standard Population. Monthly rates in this bulletin are adjusted to allow for comparisons with annual rates. For more information, see Section 10: Measuring the data.
- Figures for 2020 are based on provisional mortality data and projected populations.
- Figures exclude non-residents of England and Wales.
- Deaths "due to COVID-19" include only deaths where COVID-19 was the underlying cause of death. Age-standardised mortality rates for all deaths involving COVID-19 are available in the accompanying dataset.
Download this chart Figure 2: Mortality rates due to COVID-19 in December 2020 increased for the fourth consecutive month in England and the third consecutive month in Wales
Image .csv .xlsDeaths due to COVID-19 in each Middle layer Super Output Area in England and Wales
Super Output Areas (SOAs) are small-area statistical geographies covering England and Wales. Each area has a similarly sized population and remains stable over time. For this analysis, Middle layer Super Output Areas (MSOAs) have been used. The accompanying dataset shows the number of deaths from all causes as well as deaths due to COVID-19.
The following interactive map allows you to see the cumulative number of monthly deaths due to COVID-19 in each area.
Figure 3: Number of deaths due to COVID-19 in Middle layer Super Output Areas, England and Wales, deaths registered between 1 March and 31 December 2020
Embed code
Notes:
Points on the map are placed at the centre of the local area they represent and do not show the actual location of deaths. The size of the circle is proportional to the number of deaths.
To protect confidentiality, a small number of deaths have been reallocated between neighbouring areas. Given the method used for this, figures for some areas may be different to previously published data.
Figures are for deaths registered rather than deaths occurring in each month.
Figures exclude death of non-residents; geographical boundaries are based on the most up-to-date information available at the time of publication.
Deaths "due to COVID-19" include only deaths where COVID-19 was the underlying cause of death.
Locally adopted Middle-layer Super Output Area (MSOA) names are provided by House of Commons Library. While these names are not officially supported for National Statistics, they are provided here to help local users.
Figures are provisional.
4. Leading causes of death
Our leading causes of death groupings are based on a list developed by the World Health Organization (WHO). This categorises causes of death using the International Classification of Diseases, 10th edition (ICD-10) into groups that are epidemiologically more meaningful than single ICD-10 codes, for the purpose of comparing the most common causes of death in the population.
Leading causes of death registered in December 2020
Figures 4 and 5 show the 10 most common underlying causes of death registered in December 2020 for England and Wales, compared with the five-year average for December (2015 to 2019).
Figure 4: In England, COVID-19 was the leading cause of death in December 2020 for the second consecutive month
Age-standardised mortality rate for selected leading causes of death, per 100,000 people, England, deaths registered in December 2020
Source: Office for National Statistics - Monthly mortality analysis
Notes:
- Age-standardised mortality rates per 100,000 population, standardised to the 2013 European Standard Population. Monthly rates in this bulletin are adjusted to allow for comparisons with annual rates. For more information, see Section 10: Measuring the data.
- Figures for 2020 are based on provisional mortality data and projected populations.
- Figures exclude deaths of non-residents.
- "COVID-19" includes only deaths where COVID-19 was the underlying cause of death.
Download this chart Figure 4: In England, COVID-19 was the leading cause of death in December 2020 for the second consecutive month
Image .csv .xls
Figure 5: In Wales, COVID-19 was the leading cause of death in December 2020 for the second consecutive month
Age-standardised mortality rate for selected leading causes of death, per 100,000 people, Wales, deaths registered in December 2020
Source: Office for National Statistics – Monthly mortality analysis
Notes:
- Age-standardised mortality rates per 100,000 population, standardised to the 2013 European Standard Population. Monthly rates in this bulletin are adjusted to allow for comparisons with annual rates. For more information, see Section 10: Measuring the data.
- Figures for 2020 are based on provisional mortality data and projected populations.
- Figures exclude deaths of non-residents.
- "COVID-19" includes only deaths where COVID-19 was the underlying cause of death.
Download this chart Figure 5: In Wales, COVID-19 was the leading cause of death in December 2020 for the second consecutive month
Image .csv .xlsIn both England and Wales, the coronavirus (COVID-19) was the leading cause of death in December 2020, with 233.6 deaths per 100,000 people in England (10,973 deaths) and 374.4 deaths per 100,000 people in Wales (1,081 deaths). This was the second consecutive month where COVID-19 was the leading cause of death. Prior to November and December 2020, COVID-19 had not been the leading cause of death since May 2020.
The rate of deaths due to COVID-19 was significantly higher than the next leading cause of death in both England and Wales. In both countries, the second most common cause of death in December 2020 was dementia and Alzheimer's disease, with 112.0 deaths per 100,000 people in England (5,281 deaths) and 121.2 deaths per 100,000 people in Wales (346 deaths). The COVID-19 mortality rate was around double the second leading cause of death in England, and almost triple the second leading cause of death in Wales.
In England in December 2020, 6 of the 10 leading causes of death were significantly lower than the five-year average (2015 to 2019), with only the signs, symptoms and ill-defined conditions; Malignant neoplasm of colon, sigmoid, rectum and anus; and malignant neoplasm of prostate categories having similar mortality rates to the five-year average. In Wales, 7 of the 10 leading causes were similar to the five-year average, with only influenza and pneumonia, and chronic lower respiratory diseases having significantly lower mortality rates.
Provisional leading causes of death for 2020
Based on provisional data, the leading cause of death in 2020 in both England and Wales was COVID-19, accounting for 12.1% of all deaths in England and 11.7% of all deaths in Wales. Dementia and Alzheimer's disease was the second most common cause of death in both England (11.6% of all deaths) and Wales (10.4% of all deaths).
In both countries, the rate of deaths from dementia and Alzheimer's disease in 2020 was similar to the level of deaths expected, based on the five-year average (2015 to 2019). More information on provisional leading causes of death for January to December 2020 is available in Tables 11a and 11b of the accompanying dataset. More in-depth, annual analysis of leading causes of death is available for the UK (2001 to 2018) and England and Wales (2019). Analysis of finalised data for 2020, including more detailed breakdowns of the leading causes of death by age and sex, will be published later this year.
Back to table of contents5. Age-standardised mortality rates by sex and age group, in December 2020
Generally since 2001 (the beginning of our data time series), the age-standardised mortality rates for people aged both 0 to 74 years and 75 years and over have been decreasing in England and Wales. However, similar to the trend seen in all ages (Section 2), mortality rates in both England and Wales have increased in 2019 and 2020 for both age groups. More information on mortality rates by sex and age group (including age-specific mortality rates by five-year age group for people aged 75 years and over) is available in Tables 5 to 9 of the accompanying dataset.
Back to table of contents6. Provisional deaths registered in 2020
Among usual residents, there were 569,770 deaths registered in England and 37,403 in Wales in 2020 (January to December). We have analysed how deaths registered in 2020 compared with previous years in a recent blog post. Please note that the figures in this blog also include the deaths of non-residents (829 deaths registered in 2020), so differ from the numbers reported in this bulletin.
To gain a better idea of year-to-year differences in mortality rates, we calculate year-to-date age-standardised mortality rates (ASMR) each month. In the December edition, our year-to-date analysis covers deaths registered between 1 January and 31 December in each year from 2001 to 2020 (Figure 8).
For England, the provisional ASMR for 2020 was 1,037.4 deaths per 100,000 people, which was statistically significantly higher than all years between 2009 and 2019. For Wales, the provisional ASMR for 2020 was 1,112.7 deaths per 100,000 people, which was significantly higher than all years between 2010 and 2019.
Figure 6: The provisional mortality rate for 2020 was significantly higher than each of the last ten years in England and each of the last nine years in Wales
Age-standardised mortality rates, England and Wales, deaths registered between 1 January 2001 and 31 December 2020
Source: Office for National Statistics – Monthly mortality analysis
Notes:
- Age-standardised mortality rates per 100,000 people, standardised to the 2013 European Standard Population. Monthly rates in this bulletin are adjusted to allow for comparisons with annual rates. For more information, see Section 10: Measuring the data.
- Figures are for deaths registered rather than deaths occurring in each period.
- Figures for 2020 are based on provisional mortality data and projected populations.
- Figures exclude non-residents.
Download this chart Figure 6: The provisional mortality rate for 2020 was significantly higher than each of the last ten years in England and each of the last nine years in Wales
Image .csv .xls7. Death occurrences in December 2020 and year-to-date
This section is based on the date a death occurred – rather than the date of registration used in the previous sections – to monitor current mortality trends. Analysis of deaths by date of registration is useful as the figures are comparable across time and geography. Because of the length of time that it takes a death to be registered, using data based on registration can mean that we are not monitoring the most current death trends. For example, a death registered in December 2020 could have occurred in a previous month or even a previous year. Further information regarding death occurrences and registration delays can be found in Section 10: Measuring the data.
Between 1 January and 31 December 2020, 550,238 deaths occurred in England (and were registered by 9 January 2021). This was 50,882 more deaths than the five-year average (2015 to 2019) for January to December (10.2% higher). Of the 550,238 deaths that occurred, 12.9% were due to the coronavirus (COVID-19) (71,110 deaths).
In Wales, 36,308 deaths occurred in 2020 (and were registered by 9 January 2021), which was 2,794 more deaths than the five-year average (8.3% higher). COVID-19 was the underlying cause of death in 12.5% of all deaths that occurred (4,532 deaths).
In England, the first death due to COVID-19 occurred on 30 January 2020 (Figure 9). Since 11 March, the number of COVID-19 deaths occurring on each day rose (except for 6 April 2020, when it decreased by 12 deaths) until the peak of 1,228 deaths that occurred on 8 April 2020. Since 8 April, the number of COVID-19 deaths each day had been decreasing, but began increasing again from mid-September. The number of daily COVID-19 deaths has continued to increase throughout October, November and December, reaching 462 deaths on 27 December (the highest since 7 May at 487 deaths). The number of death occurrences on more recent dates are likely to rise as we receive more death registrations.
In Wales, the first death with an underlying cause of COVID-19 occurred on 15 March. As in England, the number of COVID-19 deaths per day reached the peak on 8 April 2020, when 70 deaths due to COVID-19 occurred in Wales. Since 8 April, the number of COVID-19 deaths occurring each day in Wales had been gradually decreasing, with no COVID-19 deaths occurring on 41 days between June and September. However, daily COVID-19 deaths increased throughout October, November and December, with 56 deaths occurring on 18 December 2020 (though this may be higher due to registrations delays). This is the highest number of daily deaths due to COVID-19 in Wales since 17 April 2020 (58 deaths due to COVID-19).
It is important to note that the number of death occurrences is incomplete as it is likely that more deaths need to be registered, therefore comparisons should be treated with caution.
In particular, instances where the number of death occurrences on each day in December was below the range of the last five years are likely to be a result of when the data extract was created, as deaths that occurred towards the end of the month may not have been registered by that time. We would therefore expect the number of death occurrences to be higher in future releases.
Figure 7: Daily deaths due to COVID-19 increased between October and December 2020 in England
Number of deaths occurring on each day in 2020¹, five-year average and range, England

Source: Office for National Statistics - Monthly mortality analysis
Notes:
- Figures are for deaths occurring on each day rather than deaths registered, registered up to 9 January 2021. Death occurrences will increase as more deaths are registered, particularly for later dates.
- The range is the difference between the minimum and maximum value observed on each day during the five-year period (1 January to 31 December 2015 to 2019).
- Figures exclude non-residents.
- For 29 February, only data for leap years are included in the five-year average.
Download this image Figure 7: Daily deaths due to COVID-19 increased between October and December 2020 in England
.png (58.0 kB) .xls (88.1 kB)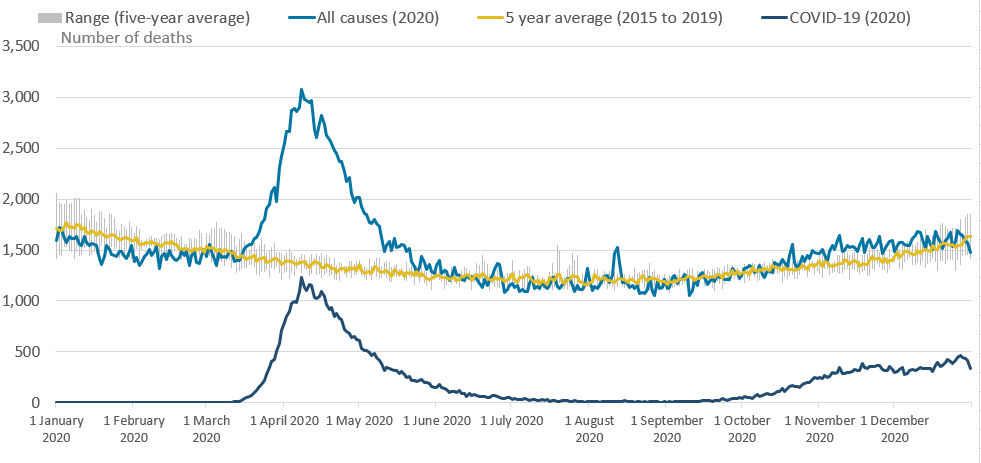
Figure 8: In Wales, daily deaths due to COVID-19 increased between October and December 2020
Number of deaths occurring on each day in 2020¹, five-year average and range, Wales
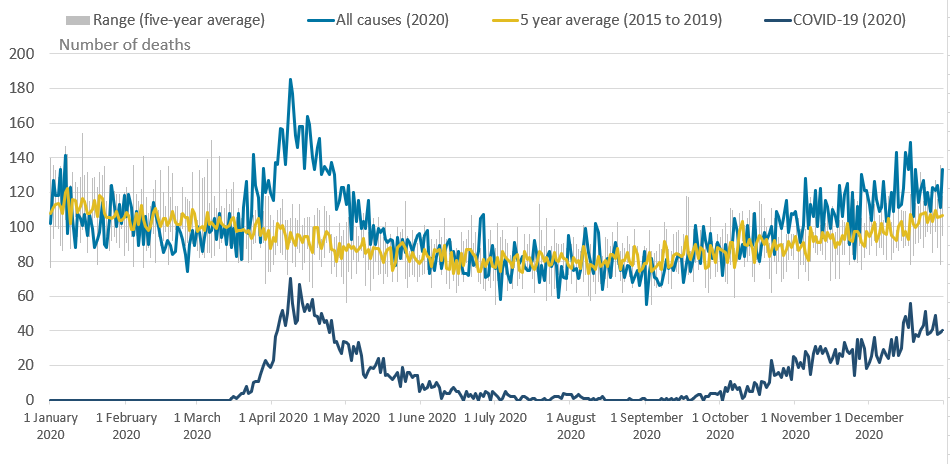
Source: Office for National Statistics - Monthly mortality analysis
Notes:
- Figures are for deaths occurring on each day rather than deaths registered, registered up to 9 January 2021. Death occurrences will increase as more deaths are registered, particularly for later dates.
- The range is the difference between the minimum and maximum value observed on each day during the five-year period (1 January to 31 December 2015 to 2019).
- Figures exclude non-residents.
- For 29 February, only data for leap years are included in the five-year average.
Download this image Figure 8: In Wales, daily deaths due to COVID-19 increased between October and December 2020
.png (91.3 kB) .xls (87.0 kB)
8. Monthly mortality data
Monthly mortality analysis, England and Wales
Dataset | Released 18 January 2021
Monthly data on death registrations and death occurrences in England and Wales, broken down by sex and age. Includes deaths due to the coronavirus (COVID-19) by date of death occurrence, and comparisons of COVID-19 with the leading causes of death.
Deaths due to COVID-19 by local area and deprivation
Dataset | Released 18 January 2021
Provisional age-standardised mortality rates for deaths due to COVID-19 by age, sex, local authority and deprivation indices, and numbers of deaths by Middle layer Super Output Area.
Deaths involving COVID-19 by month of registration, UK
Dataset | Released 18 January 2021
Provisional age-standardised mortality rates for deaths involving COVID-19 by sex and month of death registration, for England, Wales, Scotland, and Northern Ireland.
9. Glossary
Age-specific mortality rates
Age-specific mortality rates are used to allow comparisons between specified age groups.
Age-standardised mortality rates
Age-standardised mortality rates (ASMRs) are used to allow comparisons between populations that may contain different proportions of people of different ages. The 2013 European Standard Population is used to standardise rates. In this bulletin, we have adjusted the monthly ASMRs to allow for comparisons with annual rates. For more information see Section 10: Measuring the data.
Coronaviruses
The World Health Organization (WHO) defines coronaviruses as "a large family of viruses that are known to cause illness ranging from the common cold to more severe diseases such as Middle East Respiratory Syndrome (MERS) and Severe Acute Respiratory Syndrome (SARS)". Between 2001 and 2018, there were 12 deaths in England and Wales due to a coronavirus infection, with a further 13 deaths mentioning the virus as a contributory factor on the death certificate.
Coronavirus (COVID-19)
COVID-19 refers to the "coronavirus disease 2019" and is a disease that can affect the lungs and airways. It is caused by a type of coronavirus. Further information is available from the WHO.
Registration delay
Mortality statistics are compiled from information supplied when deaths are certified and registered as part of civil registration, a legal requirement. According to the Births and Deaths Registration Act 1953, a death should be registered within five days unless it is referred to a coroner for investigation. Mortality statistics for a given time period can be based on occurrence (death date) or registration (registration date); registration delay is the difference between date of occurrence and date of registration.
Statistical significance
The term "significant" refers to statistically significant changes or differences. Significance has been determined using the 95% confidence intervals, where instances of non-overlapping confidence intervals between estimates indicate the difference is unlikely to have arisen from random fluctuation. In some circumstances, significance has also been tested using z scores. More information about this z test is available in Appendix 1 of the Sullivan guide (PDF, 1.19MB).
95% confidence intervals
A confidence interval is a measure of the uncertainty around a specific estimate. If a confidence interval is 95%, it is expected that the interval will contain the true value on 95 occasions if repeated 100 times. As intervals around estimates widen, the level of uncertainty about where the true value lies increases. The size of the interval around the estimate is strongly related to the number of deaths, prevalence of health states and the size of the underlying population. At a national level, the overall level of error will be small compared with the error associated with a local area or a specific age and sex breakdown. More information is available on our uncertainty pages.
Back to table of contents10. Measuring the data
More quality and methodology information on strengths, limitations, appropriate uses, and how the data were created is available in the Mortality statistics in England and Wales QMI and User guide to mortality statistics.
The purpose of this bulletin is to provide timely surveillance of mortality in England and Wales, based on the best available provisional data, including all-cause mortality and deaths where COVID-19 was the underlying cause.
The analysis contains deaths registered in December 2020 by age and sex, and also includes deaths that occurred in December 2020 by date of death. This expands on the quarterly data for England that were previously published in the Quarterly mortality report. Non-residents of England and Wales are excluded from this analysis. In December 2020, there were 75 deaths of non-residents that were registered in England and Wales.
More in-depth analysis on deaths involving the coronavirus (COVID-19) is included in this bulletin in some months to meet user needs. In the November 2020 edition, we added analysis of deaths due to COVID-19 by local area and deprivation, and in December 2020 we added mortality rates for deaths involving COVID-19 for the UK.
Analysis by month of death registration is consistent with the weekly death registrations release and allows for a more timely analysis than would be possible using death occurrences. This is because a proportion of deaths that occurred in the previous month would not yet have been registered. On average, there is a delay of five days between a death occurring and it being registered, but this can be much longer, especially for certain causes of death. More information on this issue can be found in our impact of registration delays publication.
Deaths data sources
This bulletin is based primarily on death registrations, with a section on death occurrences for surveillance of recent mortality trends. Death occurrences show the number of deaths that occurred within a calendar period and give a better indication than registrations of exactly when deaths were at their highest. This allows mortality to be related to other factors such as weather patterns.
A provisional extract of death registrations and death occurrences data is taken at least four days after the end of the month, to allow time for deaths to be registered. Death registrations data for 2020 are provisional; however, we would expect only very small changes to total death registration counts once data are made final. Death occurrences are likely to change, especially for dates towards the end of the current month, as some deaths will not have been registered when the extract is taken.
Figures on deaths due to COVID-19 in this bulletin are different from the daily surveillance figures on COVID-19 deaths published by the Department of Health and Social Care (DHSC) on the GOV.UK website as figures in this report are derived from the formal process of death registration. More information on the different sources of COVID-19 deaths data is available in Deaths registered weekly in England and Wales.
Definition of COVID-19
The doctor certifying a death can list all causes in the chain of events that led to the death and pre-existing conditions that may have contributed to the death. Using this information, we determine an underlying cause of death. We use the term "due to COVID-19" when referring only to deaths with an underlying cause of death of COVID-19. When taking into account all of the deaths that COVID-19 mentioned anywhere on the death certificate, whether as an underlying cause or not, we use the term "involving COVID-19". Age-standardised rates for deaths due to COVID-19 and involving COVID-19 are available in the accompanying dataset.
Our definition of COVID-19 (regardless of whether it was the underlying cause or mentioned elsewhere on the death certificate) includes some cases where the certifying doctor suspected the death involved COVID-19 but was not certain. For example, a doctor may have clinically diagnosed COVID-19 based on symptoms, but this diagnosis may not have been confirmed because no test was available, or the test result was inconclusive. Of the 73,477 deaths due to COVID-19, 4,009 (5.5% were classified as "suspected" COVID-19. Including all deaths involving COVID-19, "suspected" COVID-19 was recorded on 5.6% (4,589 deaths) of all deaths involving COVID-19 in England and Wales.
Monthly mortality rates
We publish the mid-year population estimates used for calculating rates; these are currently available up to 2019. For 2020 onwards, population projections were used.
Calculation of mortality rates for monthly deaths requires adjustments to be made to annual population estimates to calculate rates that are comparable with annual rates. We calculate an annual population centred on the midpoint of the month using two years' worth of population estimates (or where these are not available, population projections). For the first half of the year (January to June), populations for the current year and the previous year are used; for the second half of the year (July to December), populations for the current year and the following year are used.
This is then multiplied by the number of days within the month as a proportion of the total number of days within that year. The output is used as the population denominator in calculations of age-standardised and age-specific mortality rates.
For example:
June 2020 population equals
where m is the number of days from 1 July 2019 (the start of the mid-year for the population estimate) to the midpoint of June inclusive, N is the number of days in June 2020, M is the number of days in 2020 and (i) is the age group.
July 2020 population equals
where m is the number of days from 1 July 2019 (the start of the mid-year for the population estimate) to the midpoint of July inclusive, N is the number of days in July 2020, M is the number of days in 2020 and (i) is the age group.
For rates at lower geographical levels (such as regions and local authorities), we calculate the proportion of the country-level population that is within each geography (for example, London has 19% of the England population). Then we apply this proportion to the country-level monthly populations discussed previously to estimate the monthly population for this geography (for example, London's monthly population for December 2020 would be 19% of the December 2020 population for England). Mid-year population estimates for 2019 are used to calculate the proportions.
Acknowledgment
We would like to thank Nadia Lohawala, Victoria Masding, Chloe Stevens, James Roberts, Nikita Gamblin, and Katherine Hay for their valued contribution to this bulletin.
Back to table of contents11. Strengths and limitations
Provisional data are used
Provisional death registrations and death occurrences data are used in this bulletin. This enables timely analysis to be completed to monitor mortality trends. However, as the data are provisional, they are subject to change.
Data coverage, timeliness and registration delays
Mortality data give complete population coverage. They ensure the estimates are of high precision and are representative of the underlying population at risk. However, because of registration delays, monthly death occurrence data are always somewhat incomplete. This is especially true for deaths that occurred towards the end of the month.
Further information can be found in the Mortality statistics in England and Wales Quality and Methodology Information (QMI) report and the User guide to mortality statistics.
Monthly mortality rates
As explained in Section 10: Measuring the data, rates in this bulletin have been adjusted to take account of the time period observed. Below country level, a more basic adjustment method has been used.
More quality and methodology information on strengths and limitations is available in the Mortality statistics in England and Wales QMI and User guide to mortality statistics.
Back to table of contents