Table of contents
- Main points
- Death registrations and the overall mortality rate for October 2020
- Deaths due to COVID-19 registered in October 2020
- Leading causes of death registered in October 2020
- Age-standardised mortality rates by sex and age group in October 2020
- Deaths registered in the year-to-date
- Death occurrences in October 2020 and year-to-date
- Monthly mortality analysis data
- Glossary
- Measuring the data
- Strengths and limitations
- Related links
1. Main points
In October 2020, there were 43,265 deaths registered in England, 2,713 deaths more than the five-year average (2015 to 2019) for October; in Wales, there were 2,992 deaths registered, 258 deaths more than the five-year average for October.
The leading cause of death in October 2020 was dementia and Alzheimer’s disease in both England (accounting for 11.3% of all deaths) and Wales (accounting for 10.2% of all deaths), while the coronavirus (COVID-19) was the third most common cause of death in both England and Wales (6.9% of all deaths in England and 7.9% of all deaths in Wales).
The age-standardised mortality rate (ASMR) of deaths due to COVID-19 in October 2020 was 63.5 deaths per 100,000 people in England and 81.9 deaths per 100,000 people in Wales; the COVID-19 mortality rate significantly increased compared with the previous month in both England and Wales.
When considering deaths registered in 2020 to date (1 January to 31 October) in England, the ASMR for deaths registered in 2020 was significantly higher than the mortality rate in the same period back to 2009.
Looking at deaths that have occurred so far in 2020 (and were registered by 7 November), 448,579 deaths occurred in England (37,873 more than the five-year average for January to October) and 29,018 deaths occurred in Wales (1,419 more than the five-year average).
In January to October 2020, COVID-19 was the underlying cause of death in 11.1% of all deaths that occurred in England (50,012 deaths) and 9.1% of all deaths in Wales (2,629 deaths).
Deaths that have occurred so far in 2020 (and were registered by 7 November) most commonly occurred in hospitals (41.1% of all deaths in England, 48.0% of all deaths in Wales), but the proportion of deaths in hospital was lower than the five-year average, with a greater proportion of deaths occurring in private homes and care homes compared with the five-year average.
2. Death registrations and the overall mortality rate for October 2020
In October 2020, there were 43,265 deaths registered in England. This was similar to the number in October 2019 (eight more deaths), but it was 2,713 more than the five-year average (2015 to 2019) for October. Of the deaths registered in October 2020, 21,966 were males and 21,299 were females.
In Wales, there were 2,992 deaths registered in October 2020. This was 118 more deaths than in October 2019 and 258 more deaths than the five-year average for October. Of the deaths registered in October in Wales, there were 1,540 male deaths and 1,452 female deaths.
Age-standardised mortality rates (ASMRs) are used for comparisons over time rather than numbers of deaths, as ASMRs account for changes to the population size and age structure. October 2002 had the highest mortality rate for the month of October since our time series began in 2001. Since then, overall mortality rates in England for the month of October had been decreasing from 1,231.6 deaths per 100,000 people in 2002 to a low of 868.0 deaths per 100,000 people in October 2016. The statistically significant decrease in ASMRs from 2002 was seen in both males and females (Figure 1).
However, the overall mortality rate significantly increased in October 2017 (917.2 deaths per 100,000 people) and again in October 2019 (937.9 deaths per 100,000 people). In October 2020, the overall mortality rate (925.7 deaths per 100,000 people) was significantly lower than in October 2002 but not significantly different from in October 2019. The mortality rate in October 2020 was 1,087.2 deaths per 100,000 males (compared with 1,508.4 in October 2002) and 793.0 deaths per 100,000 females (compared with 1037.7 in October 2002).
Mortality rates in Wales show a similar pattern over time, significantly decreasing from 1,314.2 deaths per 100,000 people in October 2001 to 1,048.3 deaths per 100,000 people in October 2020. This significant decrease was seen in both males and females, with the highest mortality rates for both sexes being in October 2001. In October 2020 in Wales, the mortality rate was 1,238.6 deaths per 100,000 males (1,603.1 in October 2001) and 893.8 deaths per 100,000 females (1,106.4 in October 2001). These were not significantly different from the mortality rates in October 2019.
Figure 1: Mortality rates for the month of October have fallen between 2002 and 2020
Age-standardised mortality rates by sex, England and Wales, deaths registered in October 2001 to October 2020
Source: Office for National Statistics – Monthly mortality analysis
Notes:
- Age-standardised mortality rates per 100,000 people, standardised to the 2013 European Standard Population. Monthly rates in this bulletin are adjusted to allow for comparisons with annual rates. For more information, see Section 10: Measuring the data.
- Figures are for deaths registered rather than deaths occurring in each period.
- Figures for 2020 are based on provisional mortality data and projected populations.
- Figures exclude non-residents.
Download this chart Figure 1: Mortality rates for the month of October have fallen between 2002 and 2020
Image .csv .xlsAlthough mortality rates have reduced over time, the rate of decline in mortality rates has been slowing since 2011. More information about how mortality rates have changed over a longer time period can be found in Changing trends in mortality in England and Wales.
Back to table of contents3. Deaths due to COVID-19 registered in October 2020
The doctor certifying a death can list all causes in the chain of events that led to the death and pre-existing conditions that may have contributed to the death. Using this information, we determine an underlying cause of death. More information on this process can be found in our user guide. In most cases (91.8% in England and 88.9% in Wales) where the coronavirus (COVID-19) was mentioned on the death certificate, it was found to be the underlying cause of death. For more information on our definition of COVID-19 deaths, see Section 10: Measuring the data.
We use the term “due to COVID-19” when referring only to deaths with an underlying cause of death of COVID-19, and we use the term “involving COVID-19” when referring to deaths that had COVID-19 mentioned anywhere on the death certificate, whether as an underlying cause or not.
Of the 43,265 deaths registered in October 2020 in England, 6.9% (2,972 deaths) were due to COVID-19. Taking into account all deaths involving COVID-19 increases the percentage to 7.8% of all deaths (3,367 deaths) in England.
In Wales, 7.9% of the 2,992 deaths registered in October were due to COVID-19 (236 deaths). Taking into account all deaths involving COVID-19 increases the percentage to 9.5% of all deaths (285 deaths) in Wales.
When adjusting for the size and age structure of the population, mortality rates for deaths due to COVID-19 have increased for the second month in a row (Figure 2). In England, the age-standardised mortality rate (ASMR) for deaths due to COVID-19 significantly increased for the second consecutive month, with a rate of 63.5 deaths due to COVID-19 per 100,000 people in October 2020. In Wales, the ASMR for deaths due to COVID-19 significantly increased compared with the previous month for the first time since April 2020, with a rate of 81.9 deaths per 100,000 people in October 2020. The rate of deaths due to COVID-19 was significantly higher in Wales than in England for the first time.
Although mortality rates due to COVID-19 have increased in October 2020, these remained significantly lower than in April and May 2020. In England, the ASMR due to COVID-19 in October 2020 was 89.8% lower than in April 2020 (623.2 deaths per 100,000 people). In Wales, the mortality rate due to COVID-19 in October 2020 was 83.5% lower than in April 2020 (495.1 deaths per 100,000 people).
Figure 2: Mortality rates due to COVID-19 increased for the second consecutive month
Age-standardised mortality rates for deaths due to COVID-19, per 100,000 people, England and Wales, deaths registered in March to October 2020
Source: Office for National Statistics – Monthly mortality analysis
Notes:
- Age-standardised mortality rates per 100,000 people, standardised to the 2013 European Standard Population. Monthly rates in this bulletin are adjusted to allow for comparisons with annual rates. For more information, see Section 10; Measuring the data.
- Figures are for deaths registered rather than deaths occurring in each period.
- Figures for 2020 are based on provisional mortality data and projected populations.
- Figures exclude non-residents of England and Wales.
- Deaths “due to COVID-19” include only deaths where COVID-19 was the underlying cause of death. Age-standardised mortality rates for all deaths involving COVID-19 are available in the accompanying dataset.
Download this chart Figure 2: Mortality rates due to COVID-19 increased for the second consecutive month
Image .csv .xlsEmbed code
4. Leading causes of death registered in October 2020
Our leading causes of death groupings are based on a list developed by the World Health Organization (WHO). This categorises causes of death using the International Classification of Diseases, 10th edition (ICD-10) into groups that are epidemiologically more meaningful than single ICD-10 codes, for the purpose of comparing the most common causes of death in the population.
Figures 3 and 4 show the 10 most common underlying causes of death registered in October 2020 for England and Wales, compared with the five-year average for October (2015 to 2019).
Figure 3: In England, COVID-19 was the third most common cause of death in October 2020
Age-standardised mortality rate for selected leading causes of death, per 100,000 people, England, deaths registered in October 2020
Source: Office for National Statistics - Monthly mortality analysis, England and Wales: August 2020
Notes:
- Age-standardised mortality rates per 100,000 population, standardised to the 2013 European Standard Population. Monthly rates in this bulletin are adjusted to allow for comparisons with annual rates. For more information, see Section 10; Measuring the data.
- Figures are for deaths registered rather than deaths occurring in each period.
- Figures for 2020 are based on provisional mortality data and projected populations.
- Figures exclude deaths of non-residents.
- "COVID-19” includes only deaths where COVID-19 was the underlying cause of death.
Download this chart Figure 3: In England, COVID-19 was the third most common cause of death in October 2020
Image .csv .xls
Figure 4: In Wales, COVID-19 was the third most common cause of death in October 2020
Age-standardised mortality rate for selected leading causes of death, per 100,000 people, Wales, deaths registered in October 2020
Source: Office for National Statistics – Monthly mortality analysis
Notes:
- Age-standardised mortality rates per 100,000 population, standardised to the 2013 European Standard Population. Monthly rates in this bulletin are adjusted to allow for comparisons with annual rates. For more information, see Section 10; Measuring the data.
- Figures are for deaths registered rather than deaths occurring in each period.
- Figures for 2020 are based on provisional mortality data and projected populations.
- Figures exclude deaths of non-residents.
- "COVID-19” includes only deaths where COVID-19 was the underlying cause of death.
Download this chart Figure 4: In Wales, COVID-19 was the third most common cause of death in October 2020
Image .csv .xlsIn both England and Wales, dementia and Alzheimer’s disease was the leading cause of death in October 2020, with 103.4 deaths per 100,000 people in England (4,871 deaths) and 106.6 deaths per 100,000 people in Wales (305 deaths). The second most common cause of death was ischaemic heart diseases, with 4,282 deaths in England (a rate of 91.8 deaths per 100,000 people) and 303 deaths in Wales (a rate of 105.5 deaths per 100,000 people).
In October 2020, the coronavirus (COVID-19) was the third most common cause of death in both England and Wales. For comparison, in September 2020 COVID-19 was the 19th most common cause of death registered in England and the 24th most common in Wales. Despite the rise of deaths due to COVID-19 in October 2020, the rate of deaths due to COVID-19 remained significantly lower than the mortality rates of the first and second ranked leading causes of death (dementia and Alzheimer’s disease and ischaemic heart diseases respectively)
More in-depth analysis of leading causes of death is available for the UK (2001 to 2018) and England and Wales (2019).
Back to table of contents5. Age-standardised mortality rates by sex and age group in October 2020
Most deaths registered typically occur in those who are aged 75 years and over. For this reason, age-standardised mortality rates (ASMRs) for those aged under 75 years and those aged 75 years and over have been analysed separately. Age-specific mortality rates by five-year age groups for ages 75 years and over are available in the accompanying dataset.
Generally since 2001 (the beginning of our time series), the ASMRs for people aged 0 to 74 years across both England and Wales have been decreasing. In October 2020, there were 334.7 deaths per 100,000 people in England (461.8 in October 2001) and 393.9 deaths per 100,000 people in Wales (510.4 in October 2001). This decline in mortality rates can be seen in both males and females aged 0 to 74 years (Figure 5).
Figure 5: In October 2020 mortality rates in England, for people aged under 75 years, were not significantly higher than in October 2019
Age-standardised mortality rates by sex, ages 0 to 74 years, England and Wales, deaths registered in October 2001 to 2020
Source: Office for National Statistics – Monthly mortality analysis
Notes:
- Age-standardised mortality rates per 100,000 people, standardised to the 2013 European Standard Population. Monthly rates in this bulletin are adjusted to allow for comparisons with annual rates. For more information, see Section 10; Measuring the data.
- Figures are for deaths registered rather than deaths occurring in each period.
- Figures for 2020 are based on provisional mortality data and projected populations.
- Figures exclude non-residents.
Download this chart Figure 5: In October 2020 mortality rates in England, for people aged under 75 years, were not significantly higher than in October 2019
Image .csv .xlsSimilar to the mortality trends seen across all age groups, improvements to mortality rates for males and females aged 0 to 74 years have slowed since 2011. ASMRs in October 2020 increased compared with October 2019 across males and females in England and Wales, but this increase was not significant.
In people aged 75 years and over, mortality rates have also generally improved since 2001 (Figure 6). In October 2020, people aged 75 years and over had a mortality rate of 6,901.8 deaths per 100,000 people in England (8,781.5 in October 2001) and 7,665.5 deaths per 100,000 people in Wales (9,440.8 in October 2001).
In England, the overall mortality rate was significantly lower (3.4%) in October 2020 than in October 2019 (7,141.7 per 100,000 people) for people aged 75 years and over. Compared with October 2019, the mortality rate in October 2020 significantly decreased for females aged 75 years and over (4.1% lower). A decrease was also seen in males (2.6%), but this was not significant.
In Wales, the overall mortality rate in October 2020 for those aged 75 years and over increased compared with October 2019 (2.1% higher), but this was not significant. This increase was seen for males (4.4% higher) but not for females (0.5% lower than October 2019).
Figure 6: Mortality rates in people aged 75 years and over in England were significantly lower in October 2020 than in October 2019 but not significantly different in Wales
Age-standardised mortality rates by sex, ages 75 years and over, England and Wales, deaths registered in October 2001 to 2020
Source: Office for National Statistics – Monthly mortality analysis
Notes:
- Age-standardised mortality rates per 100,000 people, standardised to the 2013 European Standard Population. Monthly rates in this bulletin are adjusted to allow for comparisons with annual rates. For more information, see Section 10: Measuring the data.
- Figures are for deaths registered rather than deaths occurring in each period.
- Figures for 2020 are based on provisional mortality data and projected populations.
- Figures exclude non-residents.
Download this chart Figure 6: Mortality rates in people aged 75 years and over in England were significantly lower in October 2020 than in October 2019 but not significantly different in Wales
Image .csv .xls6. Deaths registered in the year-to-date
There were 469,240 deaths registered in England and 30,106 deaths registered in Wales during the first 10 months (January to October) of 2020.
To gain a better idea of year-to-year differences in mortality rates, we calculated year-to-date age-standardised mortality rates (ASMRs) based on deaths registered between 1 January and 31 October in each year from 2001 to 2020 (Figure 7). For England, the year-to-date ASMR for 2020 was 1,026.7 deaths per 100,000 people, which was statistically significantly higher than in all years between 2009 and 2019. For Wales, the year-to-date ASMR for 2020 was 1,076.1 deaths per 100,000 people. This was significantly higher than the first 10 months of 2019 (a particularly low year), but it was not significantly different from in 2018.
Figure 7: Mortality rates for 2020 to date in England are statistically significantly higher than all years since 2009
Age-standardised mortality rates, England and Wales, deaths registered between 1 January and 31 October 2001 to 2020
Source: Office for National Statistics – Monthly mortality analysis
Notes:
- Age-standardised mortality rates per 100,000 people, standardised to the 2013 European Standard Population. Monthly rates in this bulletin are adjusted to allow for comparisons with annual rates. For more information, see Section 10: Measuring the data.
- Figures are for deaths registered rather than deaths occurring in each period.
- Figures for 2020 are based on provisional mortality data and projected populations.
- Figures exclude non-residents.
Download this chart Figure 7: Mortality rates for 2020 to date in England are statistically significantly higher than all years since 2009
Image .csv .xls7. Death occurrences in October 2020 and year-to-date
This section is based on the date a death occurred – rather than the date of registration used in the previous sections – to monitor current mortality trends. Analysis of deaths by date of registration is useful as the figures are comparable across time and geography. Owing to the length of time that it takes a death to be registered, using data based on registration can mean that we are not monitoring the most current death trends. For example, a death registered in October 2020 could have occurred in a previous month or even a previous year. Further information regarding death occurrences and registration delays can be found in Section 10: Measuring the data.
Between 1 January and 31 October 2020, 448,579 deaths occurred in England (and were registered by 7 November). This was 37,873 more deaths than the five-year average (2015 to 2019) for January to October. Of the 448,579 deaths that occurred, 11.1% were due to the coronavirus (COVID-19) (50,012 deaths). In Wales, 29,018 deaths occurred in 2020 to date (and were registered by 7 November), which was 1,419 more deaths than the five-year average. COVID-19 was the underlying cause of death in 9.1% of all deaths that occurred (2,629 deaths).
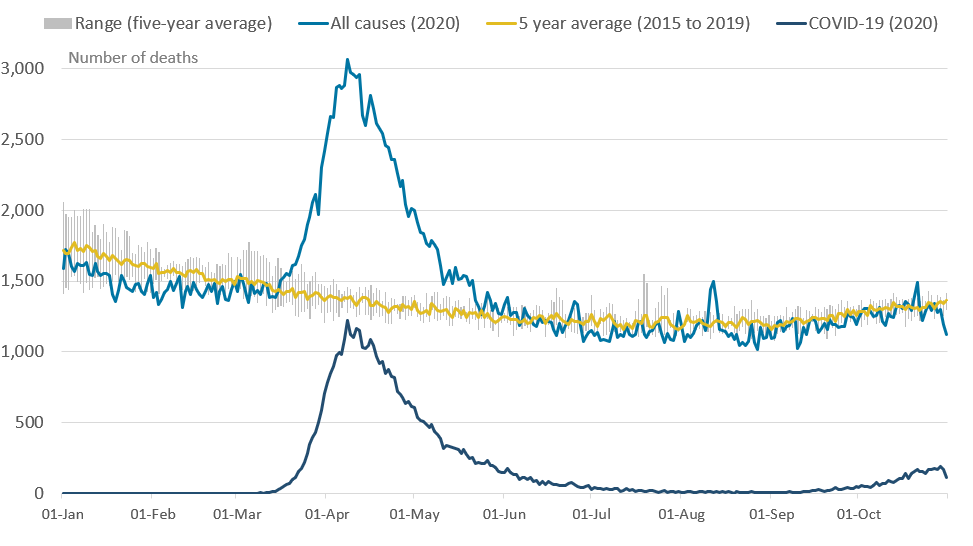
In England, the first death due to COVID-19 occurred on 30 January 2020 (Figure 9). Since 11 March, the number of COVID-19 deaths occurring on each day rose (except for 6 April 2020, when it decreased by 12 deaths) until the peak of 1,225 deaths that occurred on 8 April 2020. Since 8 April, the number of COVID-19 deaths each day had been decreasing, but it began increasing again from mid-September and has continued to increase throughout October with 112 deaths occurring on 31 October 2020. The highest number of deaths due to COVID-19 that occurred in October was on 29 October (189 deaths), which is the highest number of deaths in a day since 28 May 2020 (202 deaths). The number of death occurrences on more recent dates are likely to rise as we receive more death registrations.
In Wales, the first death with an underlying cause of COVID-19 occurred on 15 March. As in England, the number of COVID-19 deaths per day reached the peak on 8 April 2020, when 70 deaths due to COVID-19 occurred in Wales. Since 8 April, the number of COVID-19 deaths occurring each day in Wales had been gradually decreasing, with no COVID-19 deaths occurring on 41 days between June and September. However, daily COVID-19 deaths increased throughout October, with 19 deaths occurring on 31 October 2020 (though this may be higher because of registrations delays).
It is important to note that the number of death occurrences is incomplete as it is likely that more deaths need to be registered; therefore, comparisons should be treated with caution.
In particular, instances where the number of death occurrences on each day in October was below the range of the last five years are likely to be a result of when the data extract was created, as deaths that occurred towards the end of the month may not have been registered by that time. We would therefore expect the number of death occurrences to be higher in future releases.
Figure 8: Daily deaths due to COVID-19 in England have increased in October
Number of deaths occurring on each day in 2020¹, five-year average and range, England
Source: Office for National Statistics – Monthly mortality analysis
Notes:
- Figures are for deaths occurring on each day rather than deaths registered, registered up to 7 November 2020. Death occurrences will increase as more deaths are registered, particularly for later dates.
- The range is the difference between the minimum and maximum value observed on each day during the five-year period (1 January to 31 October 2015 to 2019).
- Figures exclude non-residents.
- For 29 February, only data for leap years are included in the five-year average.
Download this image Figure 8: Daily deaths due to COVID-19 in England have increased in October
.png (54.2 kB) .xlsx (37.3 kB)
Figure 9: Daily deaths due to COVID-19 in Wales have increased in October
Number of deaths occurring on each day in 2020¹, five-year average and range, Wales

Source: Office for National Statistics – Monthly mortality analysis
Notes:
- Figures are for deaths occurring on each day rather than deaths registered, registered up to 7 November 2020. Death occurrences will increase as more deaths are registered, particularly for later dates.
- The range is the difference between the minimum and maximum value observed on each day during the five-year period (1 January to 31 October 2015 to 2019).
- Figures exclude non-residents.
- For 29 February, only data for leap years are included in the five-year average.
Download this image Figure 9: Daily deaths due to COVID-19 in Wales have increased in October
.png (96.2 kB) .xlsx (36.3 kB)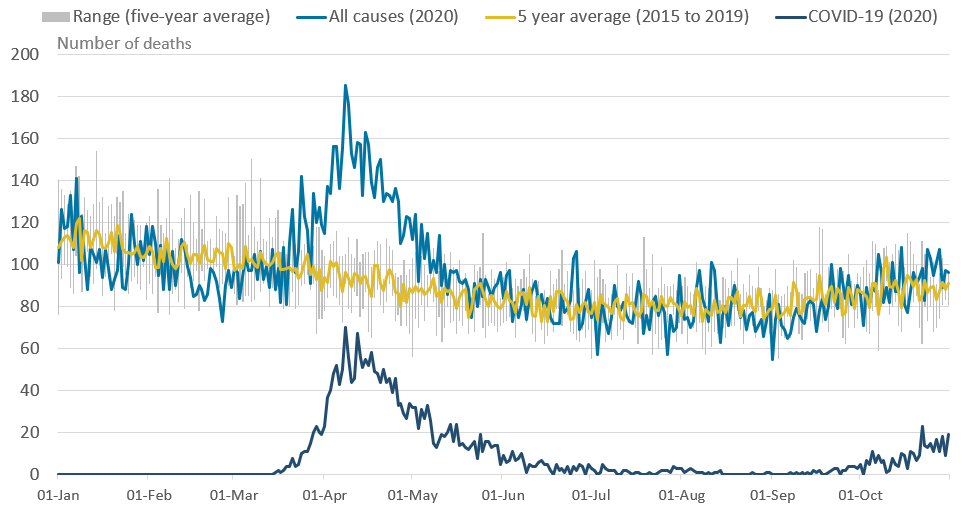
In both England and Wales, the proportions of deaths that occurred in hospital were lower in 2020 to date (January to October) than the five-year average (January to October 2015 to 2019). Of the 448,579 deaths that occurred in England in 2020 (and were registered by 7 November), 41.1% (184,246 deaths) occurred in hospital, compared with 46.1% for the five-year average. In Wales, 48.0% of the 29,018 deaths that occurred in 2020 to date happened in hospital (13,917 deaths), compared with 54.1% for the five-year average.
The percentages of deaths that occurred in private homes and care homes were higher in 2020 than the five-year average. More than a quarter of deaths in 2020 to date occurred in private homes in both England (27.0% in 2020, compared with 23.5% for the five-year average) and Wales (28.9% in 2020, compared with 24.4% for the five-year average). Deaths in care homes accounted for a quarter of deaths in England (25.1%) and almost a fifth of deaths in Wales (19.1%), both greater than the proportions for the five-year averages (22.2% in England, 16.4% in Wales).
Further data on deaths by place of occurrence, by age and month, are available in the accompanying dataset. Data on deaths involving COVID-19 by place of death occurrence are published in Deaths registered weekly in England and Wales. In-depth analyses of deaths involving COVID-19 in the care sector and deaths in private homes are also available.
Figure 10: Deaths in 2020 to date occurred mostly in hospitals, followed by private homes and care homes
Number of deaths by place of occurrence, England and Wales, deaths occurring in January to October 2020 (and registered by 7 November 2020)
Source: Office for National Statistics – Monthly mortality analysis
Notes:
- Figures are for deaths occurring in January to October 2020 rather than deaths registered, registered up to 7 November 2020. Death occurrences will increase as more deaths are registered.
- Figures exclude non-residents.
- Hospital includes acute and community hospitals, but does not include psychiatric hospitals.
Download this chart Figure 10: Deaths in 2020 to date occurred mostly in hospitals, followed by private homes and care homes
Image .csv .xls8. Monthly mortality analysis data
Monthly mortality analysis, England and Wales
Dataset | Released 19 November 2020
Monthly data on death registrations and death occurrences in England and Wales, broken down by sex and age. Includes deaths due to the coronavirus (COVID-19) by date of death occurrence and comparisons of COVID-19 with the leading causes of death.
9. Glossary
Age-specific mortality rates
Age-specific mortality rates are used to allow comparisons between specified age groups.
Age-standardised mortality rates
Age-standardised mortality rates (ASMRs) are used to allow comparisons between populations that may contain different proportions of people of different ages. The 2013 European Standard Population is used to standardise rates. In this bulletin, we have adjusted the monthly ASMRs to allow for comparisons with annual rates. For more information, see Section 10: Measuring the data.
Coronaviruses
The World Health Organization (WHO) defines coronaviruses as “a large family of viruses that are known to cause illness ranging from the common cold to more severe diseases such as Middle East Respiratory Syndrome (MERS) and Severe Acute Respiratory Syndrome (SARS)”. Between 2001 and 2018, there were 12 deaths in England and Wales due to a coronavirus infection, with a further 13 deaths mentioning the virus as a contributory factor on the death certificate.
Coronavirus (COVID-19)
COVID-19 refers to the "coronavirus disease 2019" and is a disease that can affect the lungs and airways. It is caused by a type of coronavirus. Further information is available from the WHO.
Registration delay
Mortality statistics are compiled from information supplied when deaths are certified and registered as part of civil registration, a legal requirement. According to the Births and Deaths Registration Act 1953, a death should be registered within five days unless it is referred to a coroner for investigation. Mortality statistics for a given time period can be based on occurrence (death date) or registration (registration date); registration delay is the difference between date of occurrence and date of registration.
Statistical significance
The term “significant” refers to statistically significant changes or differences. Significance has been determined using the 95% confidence intervals, where instances of non-overlapping confidence intervals between estimates indicate the difference is unlikely to have arisen from random fluctuation. In some circumstances, significance has also been tested using z scores. More information about this z test is available in Appendix 1 of the Sullivan guide.
95% confidence intervals
A confidence interval is a measure of the uncertainty around a specific estimate. If a confidence interval is 95%, it is expected that the interval will contain the true value on 95 occasions if repeated 100 times. As intervals around estimates widen, the level of uncertainty about where the true value lies increases. The size of the interval around the estimate is strongly related to the number of deaths, prevalence of health states and the size of the underlying population. At a national level, the overall level of error will be small compared with the error associated with a local area or a specific age and sex breakdown. More information is available on our uncertainty page.
Back to table of contents10. Measuring the data
More quality and methodology information on strengths, limitations, appropriate uses, and how the data were created is available in the Mortality statistics in England and Wales QMI and User guide to mortality statistics.
The purpose of this bulletin is to provide timely surveillance of mortality in England and Wales, based on the best available provisional data, including all-cause mortality and deaths where the coronavirus (COVID-19) was the underlying cause.
The analysis contains deaths registered in October 2020 by age and sex, and it includes deaths that occurred in October 2020 by date of death. This expands on the quarterly data for England that were previously published in the Quarterly mortality report. Non-residents of England and Wales are excluded from this analysis. In October 2020, there were 43 deaths of non-residents that were registered in England and Wales.
Analysis by month of death registration is consistent with the weekly death registrations release and allows for a more timely analysis than would be possible using death occurrences. This is because a proportion of deaths that occurred in the previous month would not yet have been registered. On average, there is a delay of five days between a death occurring and it being registered, but this can be much longer, especially for certain causes of death. More information on this issue can be found in our impact of registration delays publication.
Deaths data sources
This bulletin is based primarily on death registrations, with a section on death occurrences for surveillance of recent mortality trends. Death occurrences show the number of deaths that occurred within a calendar period and give a better indication than registrations of exactly when deaths were at their highest. This allows mortality to be related to other factors such as weather patterns.
A provisional extract of death registrations and death occurrences data is taken at least four days after the end of the month, to allow time for deaths to be registered. Death registrations data for 2020 are provisional; however, we would expect only very small changes to total death registration counts once data are made final. Death occurrences are likely to change, especially for dates towards the end of the current month, as some deaths will not have been registered the extract is taken.
Figures on deaths due to COVID-19 in this bulletin are different from the daily surveillance figures on COVID-19 deaths published by the Department of Health and Social Care (DHSC) on the GOV.UK website as figures in this report are derived from the formal process of death registration. More information on the different sources of COVID-19 deaths data is available in Deaths registered weekly in England and Wales.
Definition of COVID-19
The doctor certifying a death can list all causes in the chain of events that led to the death and pre-existing conditions that may have contributed to the death. Using this information, we determine an underlying cause of death. We use the term “due to COVID-19” when referring only to deaths with an underlying cause of death of COVID-19. When taking into account all of the deaths that COVID-19 mentioned anywhere on the death certificate, whether as an underlying cause or not, we use the term “involving COVID-19”. Age-standardised mortality rates (ASMRs) for deaths due to COVID-19 and involving COVID-19 are available in the accompanying dataset.
Our definition of COVID-19 (regardless of whether it was the underlying cause or mentioned elsewhere on the death certificate) includes some cases where the certifying doctor suspected the death involved COVID-19 but was not certain. For example, a doctor may have clinically diagnosed COVID-19 based on symptoms, but this diagnosis may not have been confirmed because no test was available or the test result was inconclusive. Of the 51,921 deaths due to COVID-19, 3,927 (7.6%) were classified as “suspected” COVID-19. Including all deaths involving COVID-19, “suspected” COVID-19 was recorded on 7.9% (4,477 deaths) of all deaths involving COVID-19 in England and Wales.
Monthly mortality rates
We publish the mid-year population estimates used for calculating rates; these are currently available up to 2019. For 2020 onwards, population projections were used.
Calculation of mortality rates for monthly deaths requires adjustments to be made to annual population estimates to calculate rates that are comparable with annual rates. We calculate an annual population centred on the midpoint of the month using two years’ worth of population estimates (or, where these are not available, population projections). For the first half of the year (January to June), populations for the current year and the previous year are used; for the second half of the year (July to December), populations for the current year and the following year are used.
This is then multiplied by the number of days within the month as a proportion of the total number of days within that year. The output is used as the population denominator in calculations of age-standardised and age-specific mortality rates.
For example:
June 2020 population =
where m is the number of days from 1 July 2019 (the start of the mid-year for the population estimate) to the midpoint of June inclusive, N is the number of days in June 2020, M is the number of days in 2020 and (i) is the age group.
June 2020 population =
where m is the number of days from 1 July 2019 (the start of the mid-year for the population estimate) to the midpoint of July inclusive, N is the number of days in July 2020, M is the number of days in 2020 and (i) is the age group.
Back to table of contents11. Strengths and limitations
Provisional data are used
Provisional death registrations and death occurrences data are used in this bulletin. This enables timely analysis to be completed to monitor mortality trends. However, as the data are provisional, they are subject to change.
Data coverage, timeliness and registration delays
Mortality data give complete population coverage. They ensure the estimates are of high precision and are representative of the underlying population at risk. However, because of registration delays, monthly death occurrence data are always somewhat incomplete. This is especially true for deaths that occurred towards the end of the month.
More quality and methodology information on strengths and limitations is available in the Mortality statistics in England and Wales QMI and User guide to mortality statistics.
Back to table of contents