1. Other pages in this release
Commentary on topics covered in the Annual Survey of Hours and Earnings (ASHE) is split between three separate bulletins. The other two can be found on the following pages:
- Employee earnings in the UK (from Annual Survey of Hours and Earnings): 2019
- Low and high pay in the UK: 2019
2. Main points
The gender pay gap among full-time employees stands at 8.9%, little changed from 2018, and a decline of only 0.6 percentage points since 2012.
The gender pay gap among all employees fell from 17.8% in 2018 to 17.3% in 2019, and continues to decline.
For age groups under 40 years, the gender pay gap for full-time employees is now close to zero.
Among 40- to 49-year-olds the gap (currently 11.4%) has decreased substantially over time.
Among 50- to 59- year-olds and those over 60 years, the gender pay gap is over 15% and is not declining strongly over time.
One of the reasons for differences in the gender pay gap between age groups is that women over 40 years are more likely to work in lower-paid occupations and, compared with younger women, are less likely to work as managers, directors or senior officials.
The gender pay gap is calculated as the difference between average hourly earnings (excluding overtime) of men and women as a proportion of average hourly earnings (excluding overtime) of men’s earnings. It is a measure across all jobs in the UK, not of the difference in pay between men and women for doing the same job.
The gender pay gap reported by ONS is a long time-series, calculated from the Annual Survey of Hours and Earnings (ASHE) which samples from all employee jobs in all sizes of company. This is different from the gender pay gap based on compulsory reporting for companies with 250 or more employees
Back to table of contents3. The gender pay gap
Figure 1: The gender pay gap among full-time employees was 8.9% in 2019
Gender pay gap for median gross hourly earnings (excluding overtime), UK, April 1997 to 2019
Source: Office for National Statistics – Annual Survey of Hours and Earnings (ASHE)
Notes:
- Dashed lines represent discontinuities in 2004, 2006 and 2011 ASHE.
- Footnotes applicable to all charts in this bulletin can be found in Section 5: Measuring the data.
Download this chart Figure 1: The gender pay gap among full-time employees was 8.9% in 2019
Image .csv .xlsThe gender pay gap has been declining slowly in recent years. Among full-time employees it now stands at 8.9%, little changed from 2018 when it was 8.6% (not a statistically significant increase). The figure for 2019 represents a decline of 3.3 percentage points from a decade ago – 12.2% in 2009 – but only 0.6 percentage points since 2012. Among all employees the gap fell from 17.8% in 2018 to 17.3% in 2019.
The gender pay gap is higher for all employees than for each of full-time employees and part-time employees. This is because women fill more part-time jobs, which have lower hourly median pay than full-time jobs, and are more likely to be in lower-paid occupations. This is explained further in this blog, written in 2018.
| Occupation | Hourly earnings (£) | Gender pay gap | Change from 2018 |
|---|---|---|---|
| Managers, directors and senior officials | 22.07 | 15.9 | 2.0 |
| Professional occupations | 21.11 | 10.1 | -1.6 |
| Associate professional and technical occupations | 16.28 | 11.0 | -0.9 |
| Skilled trades occupations | 12.79 | 22.4 | -1.8 |
| Administrative and secretarial occupations | 12.03 | 4.9 | -1.6 |
| Process, plant and machine operatives | 11.22 | 18.1 | -0.8 |
| Sales and customer service occupations | 10.07 | 4.4 | -0.3 |
| Caring, leisure and other service occupations | 10.00 | 8.0 | 0.1 |
| Elementary occupations | 9.53 | 11.0 | -0.2 |
Download this table Table 1: The gender pay gap among full-time employees fell in seven of the nine main occupation groups
.xls .csvAlthough the estimated gender pay gap among full-time employees in 2019 was no lower than in 2018 (the estimate was 8.9% compared with 8.6% in 2018), it declined in seven of the nine main occupation groupings. This is one example of the complex nature and interaction of multiple factors that influence the gender pay gap.
An increase in the gender pay gap among the high-paying managers, professionals and senior officials occupation group (from 13.9% to 15.9%) had an effect on the gap, but so too did certain other changes in full-time employment profiles from 2018 to 2019:
The proportion of employees who held full-time jobs rather than part-time jobs increased more for women than men, but new entrants or returners to full-time jobs are likely to start from a lower pay level and may reduce average pay for full-time women employees.
The three occupations that saw the largest increase in the proportion of full-time employee jobs held by women were: sales and customer service, elementary occupations and process, and plant and machine operatives; these all have a lower than average rate of hourly pay and will reduce the average full-time earnings among women.
When looking at more specific occupation types, in 2019 there was a gender pay gap of greater than zero in:
- 79% of occupations based on all employees
- 81% based on full-time employees
- 43% based on part-time employees
The largest gender pay gap among all employees is in carpenters and joiners (44%) and energy plant operatives (41%). The lowest is in archivists and curators (negative 36%), and personal assistants and other secretaries (negative 25%).
What is the gender pay gap for your job? Enter your job in the interactive tool to find out.
Figure 2: Explore the gender pay gap by occupation
UK, April 2019
Embed code
Figure 3: The gender pay gap has fallen to almost zero among full-time employees aged under 40 years
Gender pay gap for full-time median gross hourly earnings (excluding overtime), UK, April 1997 to 2019
Source: Office for National Statistics – Annual Survey of Hours and Earnings (ASHE)
Notes:
- Age group 16 to 17 years has been excluded from this chart because of sample size volatility.
- Footnotes applicable to all charts in this bulletin can be found in Section 5: Measuring the data.
Download this chart Figure 3: The gender pay gap has fallen to almost zero among full-time employees aged under 40 years
Image .csv .xlsFor age groups under 40 years, the gender pay gap for full-time employees is now close to zero. Among 40- to 49-year-olds, the gap (currently 11.4%) has decreased substantially over time (from 24% in 1997).
Among 50-to 59- year-olds, and those over 60 years, the gender pay is over 15% and is not declining strongly over time. In the case of those over 60 years, the gap has grown from 7.3% in 2004 to 15.4% in 2019. The introduction in 2010 of the higher state pension age for women can be expected to have affected the working patterns of some women (more likely those in lower-paying jobs) in this age group.
Figure 4: Although the gender pay gap in 30- to 39-year-olds is close to zero, changing employment patterns affect this age group as they get older
Gender pay gap for median gross hourly earnings (excluding overtime) by age group, UK, April 2019

Source: Office for National Statistics – Annual Survey of Hours and Earnings (ASHE)
Download this image Figure 4: Although the gender pay gap in 30- to 39-year-olds is close to zero, changing employment patterns affect this age group as they get older
.png (22.1 kB) .xlsx (11.5 kB)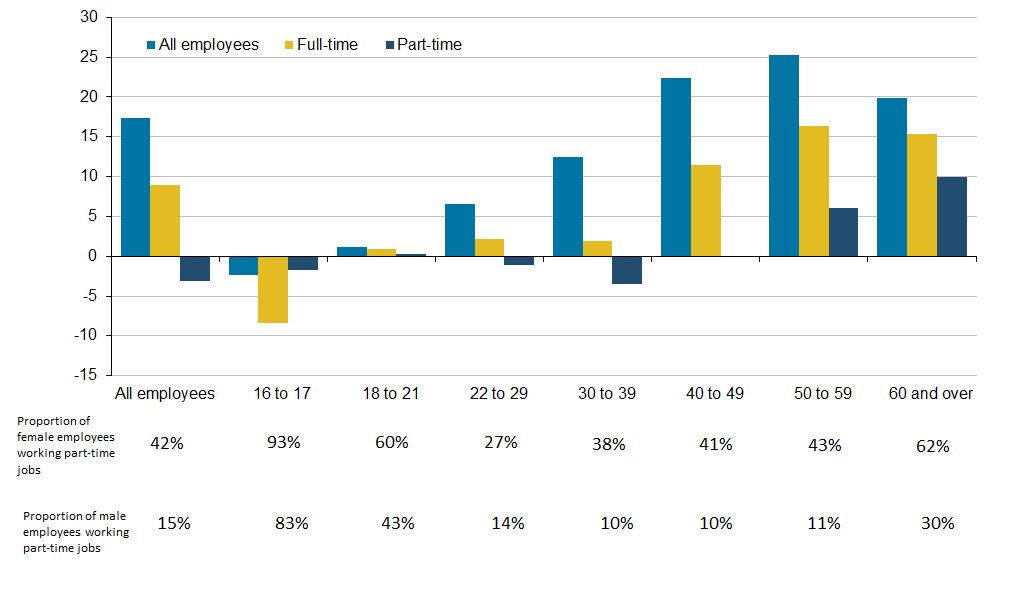
Although the gender pay gap for full-time employees is close to zero between the ages of 18 and 39 years, for all employees the gender pay gap already stands at over 10% in the age group 30 to 39 years. This coincides with an increase in women working part-time from this age and suggests an important step towards women earning less per hour (because part-time jobs pay less per hour than full-time jobs).
Other employment changes are also likely to have an effect as households move towards having greater caring responsibilities, often from the mid 30s upwards. For example, research conducted by the Office for National Statistics (ONS) has identified that, compared with men, women are more likely to leave their job over a long commute.
These factors may affect the occupations that women work in, either at age 30 to 39 years or at later ages. Occupation has been identified in research by the ONS as having a notable impact on the gender pay gap and we will also explore the profile of occupations worked in by age group.
Figure 5: Women aged over 40 years are more likely to work in lower paid occupations
Women as a proportion of all full-time employees in each of higher-, medium- and lower-paid occupation groups, by age group, UK, April 2019
Source: Office for National Statistics – Annual Survey of Hours and Earnings (ASHE)
Notes:
- Footnotes applicable to all charts in this bulletin can be found in Section 5: Measuring the data.
Download this chart Figure 5: Women aged over 40 years are more likely to work in lower paid occupations
Image .csv .xlsThe nine occupation groups can broadly be split into three categories of the highest-paid jobs, low-paid jobs and medium-paid jobs.
Among 30- to 39-year-olds, the proportion of women working in high-paid occupations full-time (41%) is very similar to the proportion in low-paid occupations (45%). In older age groups the proportion working in low-paid occupations is higher (for example 52% for 40- to 49-year-olds, compared with 39% in high-paid occupations).
Figure 6: Fewer women in their 40s and 50s are full-time managers, directors and senior officials, at an age when pay for these occupations increases
Median gross hourly earnings (excluding overtime) by the percent of full-time employees in each group that are women, for age and occupation group, UK, 2019
Embed code
This figure highlights the specific occupation types that women work in. The proportion of full-time employees who are women in the higher-paid occupation group of managers, directors and senior officials is lower among 40- to 49-year-olds and 50- to 59-year-olds. This is important because the average pay in that occupation increases by nearly 20% from age band 30 to 39 years to 40 to 49 years.
In comparison with full-time women employees in their 30s, those in their 40s are more likely to work in most of the lower-paid occupations, and in many cases this trend continues into age 50 to 59 years. Pay per hour in these occupations remains broadly unchanged.
Figure 7: The profile of jobs held by women in their 40s is changing
Median gross hourly earnings (excluding overtime) by the percent of full-time employees in each group that are women, for 40 to 49 years and occupation group, UK, April 2011 and April 2019
Embed code
The profile of full-time occupations among 40- to 49-year-olds has seen some change from 2011 to 2019. The proportion of women employees working in each of the higher-paid occupations (in particular managers, directors and senior officials) has increased, whereas the proportion working in administrative jobs, and sales and customer service occupations has fallen.
This changing profile has occurred to a lesser extent among women aged 50 to 59 years.
Figure 8:The 10% highest paid woman earns a fifth less per hour than the 10% highest paid man
Difference in gross hourly earnings (excluding overtime) for men and women at the top and bottom decile and median, UK, 1997 to 2019
Source: Office for National Statistics – Annual Survey of Hours and Earnings (ASHE)
Notes:
- Footnotes applicable to all charts in this bulletin can be found in Section 5: Measuring the data.
Download this chart Figure 8:The 10% highest paid woman earns a fifth less per hour than the 10% highest paid man
Image .csv .xlsThe difference in median pay for women compared with men has decreased by 8.5 percentage points (17.4% to 8.9%) since 1997. The bottom decile (that is those women or men who earn less than all except 10% of women or men full-time employees) has followed a similar pattern, decreasing by 9.7 percentage points (13.6% to 3.8%).
The top decile has shown a smaller fall of 3.1 percentage points (20.7% to 17.6%). This suggests that the higher-earning women are not converging with the higher-earning men at the same rate as medium and lower earners.
Back to table of contents4. Gender pay gap data
A detailed set of data tabulations containing gender pay gap estimates from the Annual Survey of Hours and Earnings (ASHE) broken down by aspects such as age, region, occupation and industry are available.
Gender pay gap
Dataset | Released 29 October 2019
Annual gender pay gap estimates for UK employees by age, occupation, industry, full-time and part-time, region and other geographies, and public and private sector. Compiled from the Annual Survey of Hours and Earnings.
5. Measuring the data
The estimates in this bulletin are based on information gathered from a sample of 1% of employees in the UK. The focus is on profiling pay by employee characteristics across the UK; no reporting is made by employer. In 2017, a new government initiative required employers employing more than 250 staff to report their gender pay gap information; that initiative is separate from this Office for National Statistics (ONS) publication.
All estimates for 2019 are provisional and relate to the reference date 11 April 2019. Data from the 2018 Annual Survey of Hours and Earnings (ASHE) survey have been subject to small revisions since the provisional estimates were published on 25 October 2018.
For the charts in this bulletin, the following notes apply:
Employees are on adult rates, pay is unaffected by absence.
Figures represent the difference between men's and women's hourly earnings as a percentage of men's earnings.
Full-time is defined as employees working more than 30 paid hours per week (or 25 or more hours for the teaching professions).
2019 data are provisional.
An explanation for the difference in the gender pay gap estimate between full-time and all employees can be found in the Guide to interpreting ASHE estimates. It also addresses common questions about the data.
Further information on ASHE methodology can be found on the ASHE methodology and guidance page and in the ASHE Quality and Methodology Information report.
Back to table of contents6. Glossary
The gender pay gap
The gender pay gap is calculated as the difference between average hourly earnings (excluding overtime) of men and women as a proportion of average hourly earnings (excluding overtime) of men’s earnings.
Full-time and part-time
Full-time is defined as employees working more than 30 paid hours per week (or 25 or more hours for the teaching professions). Part-time is defined as employees working less than or equal to 30 paid hours per week (or less than or equal to 25 hours for the teaching professions).
Standard Occupational Classification (SOC)
The Standard Occupational Classification is a common classification of occupational information for the UK.
Back to table of contents7. Strengths and limitations
The gender pay gap is the percentage difference between men and women’s median hourly earnings, across all jobs in the UK; it is not a measure of the difference in pay between men and women for doing the same job.
The gender pay gap estimates presented here do not include overtime. Overtime can skew the results because men work relatively more overtime than women and using hourly earnings better accounts for the fact that men work on average more hours per week than women.
The strengths and limitations of the Annual Survey of Hours and Earnings (ASHE) can be found in the Quality and Methodology Information report and the Guide to sources of data of earnings and income.
Back to table of contents