Unfortunately your browser cannot display this graphic. You might need to upgrade to a modern browser - Find out more information here https://www.gov.uk/help/browsers
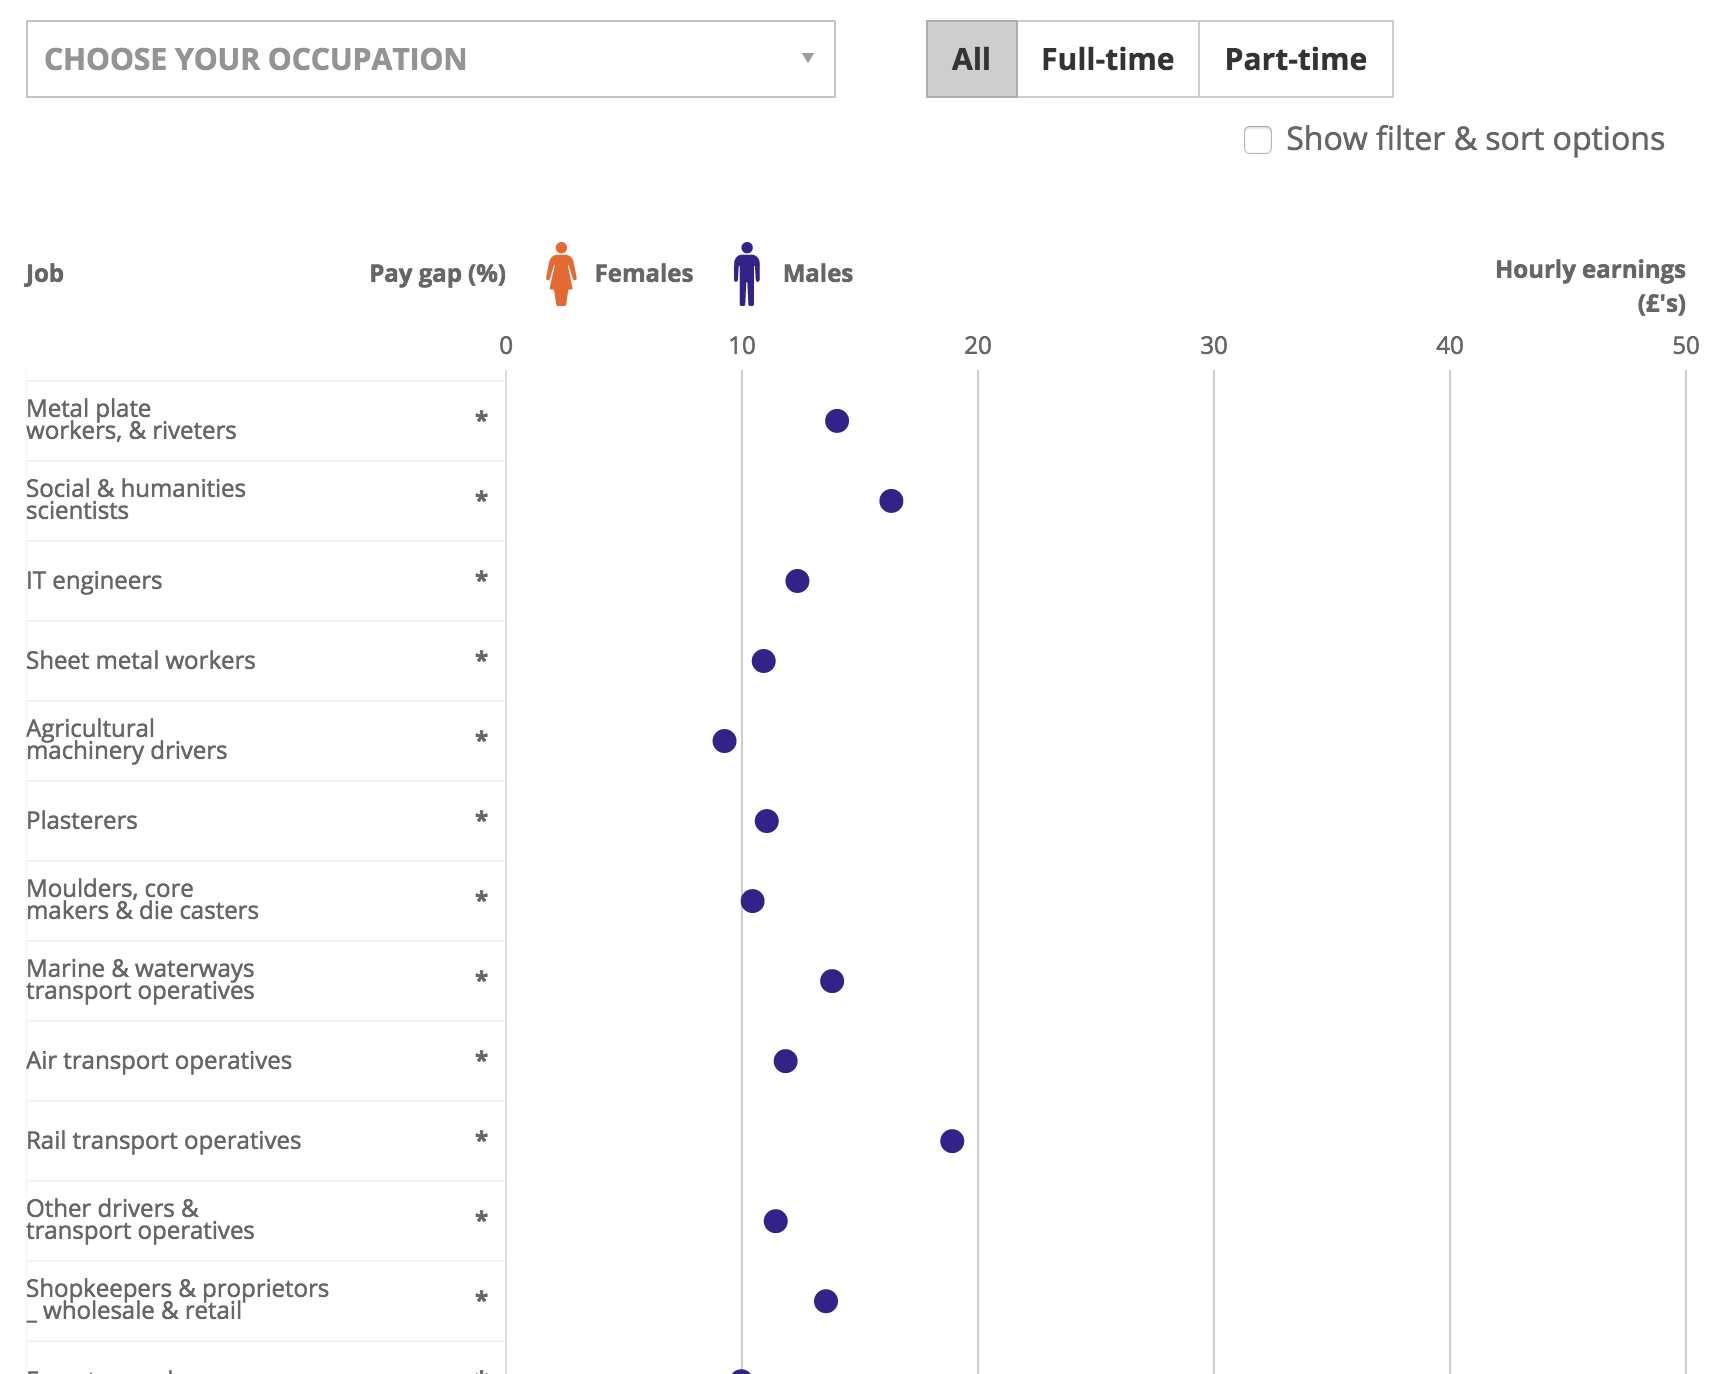
Search by job

For example, 'Graphic Designers'

Filter by job type

Share your pay gap

See how the pay gap compares
[Chart]

Source: Annual Survey of Hours and Earnings - 2019 provisional, Office for National Statistics

Notes:
  1. Pay gap is calculated using median hourly pay rates (excluding overtime)
  2. Some data is unavailable as considered unreliable (small sample size)
  3. Some occupations can be included in more than one grouping
  4. Employment splits are based on LFS data
  5. The quality of earning estimates vary by occupation - quality measures available
  6. Please note that the percentages in this visual may differ to the figures in the accompanying published data tables by 0.1% due to the effects of rounding.
  7. When conducting any analyses please use the data from the tables.