1. Income and earnings overview
The information in this guide can be used to compare income and earnings statistics to help you identify the most appropriate statistic for your needs. It provides information on the statistics produced by:
Office for National Statistics (ONS)
Department for Work and Pensions (DWP)
HM Revenue and Customs (HMRC)
For each statistic, this guide describes the source data, output data and availability, the concept being measured, its main strengths, limitations and uses.
Income and earnings statistics are also published by the devolved governments of the UK, but they are not included in this guide. If you would like more information on these statistics, then please visit our income and earnings interactive tool where you can filter by government department and country of interest to find relevant statistics.
Stages of income and earnings
Income and earnings are related concepts. Figure 1 sets out the components that are included or excluded from each stage.
Figure 1: Stages of income and earnings
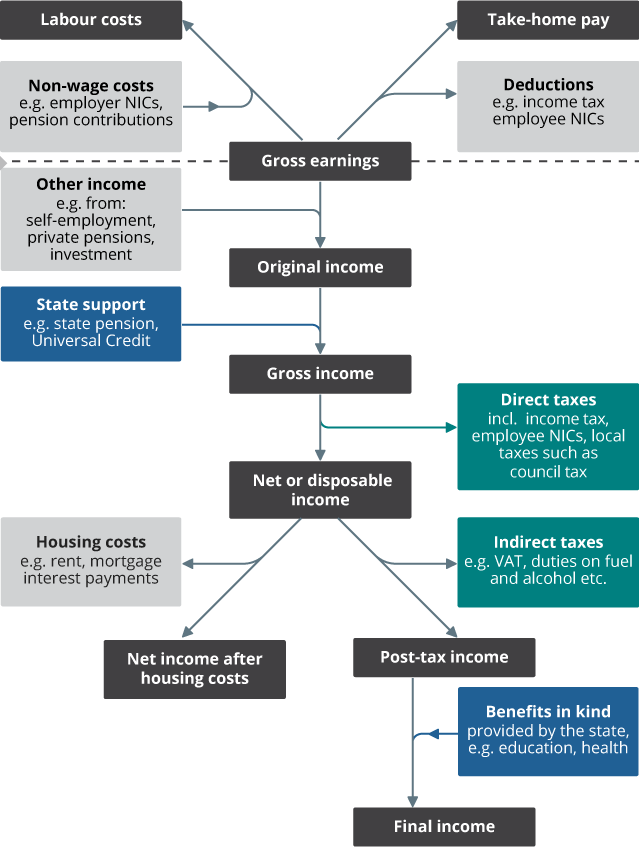
Source: Office for National Statistics
Download this image Figure 1: Stages of income and earnings
.png (54.4 kB)
Earnings
Earnings refers to remuneration received by employees in return for employment.
Gross earnings
Gross earnings are earnings before deductions are made, for example, before Income Tax and employee National Insurance contributions (NICs).
From gross earnings, we can consider two related measures: take-home pay and labour costs.
Take-home pay
Take-home pay refers to earnings received by an employee after deductions have been made. Take-home pay is typically what is paid into an employee's bank account. Measuring take-home pay can be particularly challenging and therefore some statistics in this guide may not adhere precisely to this definition. For instance, the deduction of student loan repayments may or may not be included depending on the data source.
Labour costs
From the employer viewpoint, we consider labour costs. These refer to the gross earnings (wages) paid by a business, plus non-wage costs such as employer NICs, pension contributions and benefits in kind paid by the employer.
Income
Original income
Combining gross earnings with self-employed income, along with private pensions and other income sources (such as investments), gives original income.
Gross income
Adding state support (also known as cash benefits), such as the State Pension, Universal Credit or Child Benefit to original income, gives gross income.
Net or disposable income
From gross income, we can consider deductions. Firstly, subtracting direct taxes (for example, Income Tax and employee NICs), and Council Tax or Northern Ireland rates, leaves net or disposable income.
Post-tax income
Further deductions of indirect taxes (where the tax is typically levied on one entity but paid by another) such as Value Added Tax (VAT) and duties on fuel, alcohol or tobacco, result in what is referred to as post-tax income.
Final income
Finally, we can add in benefits in kind paid for by the state (such as state education and healthcare), which are allocated based on household characteristics. This leaves us with final income.
Net income after housing costs
If we go back to net income, we can also consider the deduction of housing costs (such as rent and mortgage interest payments). This gives us net income after housing costs (AHC).
Level of analysis
Income and earnings data can be published at two different levels, either the individual or household level. A household consists of either one person living alone, or a group of people (not necessarily related) living at the same address who share cooking facilities and share a living room, sitting room or dining area. A household can consist of one or more families or benefit units. A family unit (or benefit unit) is a single adult, or a couple living as married, and any dependent children.
Typically, earnings data are at an individual level. This is because it is relatively easy to attribute earnings from employment to each employee.
Income data are often considered at a household level because poverty and low income are typically experienced at this level. Income data are also available at the individual level in some publications. However, many forms of state benefit, are paid to the family unit as a whole, and are therefore difficult to attribute to individuals in a household.
Household income can be analysed by household, by individual or by the family or benefit unit.
Equivalisation
Income statistics at the household level are often adjusted or "equivalised". Equivalisation allows for comparisons to be made across households with differing compositions (for example, comparing a single-person household with a household containing a family of four). DWP has published a graphic, which explains the equivalisation process in more detail.
Back to table of contents2. Wages and earnings
The statistics in this section measure gross earnings, which is remuneration paid to an employee in return for employment before any deductions are made. Some of the statistics in this section also cover take-home pay.
Average weekly earnings
Average weekly earnings (AWE) statistics are published monthly by the Office for National Statistics (ONS) as part of the UK Labour Market publication.
They are designated as an accredited official statistic.
AWE is the lead indicator of short-term changes in earnings.
For more information, please contact the ONS at earnings@ons.gov.uk or call +44 1633 45 6120.
Source data
AWE is calculated from returns to the Monthly Wages and Salaries Survey (MWSS), a survey of 9,000 businesses covering 12.8 million employees.
The MWSS captures information about each company's total wage bill and the number of people paid in the reference period (which is a typical week in the reference month). Weighted to the Great Britain level, the total wage bill is divided by the number of employees to give average weekly earnings.
Output data and availability
Datasets EARN01 to EARN03 are published alongside the AWE bulletin.
AWE statistics are available from January 2000 and an experimental whole economy historical back series is available from 1963.
Users cannot currently access AWE microdata.
What the data measure
AWE statistics cover Great Britain and include:
the levels of average weekly earnings broken down into regular pay (excluding bonuses), total pay (including bonuses), and bonus pay
average weekly earnings by sector (public and private)
average weekly earnings by industry
real average weekly earnings by sector (AWE adjusted for inflation)
wage and employment contributions
Average weekly earnings by sector are also available seasonally adjusted.
AWE reflects changes to the industrial composition of the workforce. For instance, all other things being equal, an increase in the relative number of employees in highly paid industries will cause average earnings to rise. The ONS publishes separate estimates of the wage and employment contributions to AWE growth in supplementary tables called the AWE decomposition.
Additional analysis published alongside the main results includes real average weekly earnings. This is the AWE adjusted for inflation using the Consumer Prices Index including owner occupiers' housing costs (CPIH).
Strengths
Timely and frequent with results published every month, usually six to seven weeks after the end of the reference period.
As it is conducted monthly, it captures bonus payments in every month of the year; March is often the main month in which bonuses are paid.
Can isolate the effects of changes in wages from changes in industrial composition of the workforce.
Provides an estimate of real earnings (in other words, earnings adjusted for inflation).
Limitations
Excludes the self-employed.
Does not include Northern Ireland.
Excludes HM Armed Forces or government-supported trainees.
Businesses with fewer than 20 employees are excluded to limit cost and respondent burden; figures for these businesses are estimated using employment figures from the Inter-Departmental Business Register (IDBR) and an earnings factor derived from the Annual Survey of Hours and Earnings (ASHE).
There is no information on individual employees' characteristics and therefore it does not allow analysis beyond sector and industry.
It does not capture compositional changes between occupation, age or changes within the same industry.
It does not differentiate between full-time and part-time workers, and so a relative increase in the prevalence of part-time working would indicate that average weekly pay was falling, whereas average hourly pay may remain the same.
Uses
The AWE measure of average earnings is often compared with measures of inflation to calculate changes in real earnings.
It is used by the Bank of England and HM Treasury to measure the inflationary pressure emanating from the labour market.
Widely used as a measure of wages growth, sometimes in pay negotiations but more often in contract escalation clauses.
Given its strength in capturing bonus payments, AWE is used to supplement ASHE data in ONS's estimates of public and private sector pay differentials.
Earnings and Employment from Pay As You Earn Real Time Information
Earnings and employment from Pay As You Earn (PAYE) Real Time Information (RTI) is a joint release between HM Revenue and Customs (HMRC) and the Office for National Statistics (ONS).
These statistics are published monthly as part of the ONS's UK Labour Market publication.
They are designated as an accredited official statistic.
For more information, please contact the ONS at labour.market@ons.gov.uk or HMRC at rtistatistics.enquiries@hmrc.gov.uk, or call +44 1633 455400.
Source data
The publication uses administrative data from HMRC's PAYE RTI system.
Output data and availability
Output tables are published alongside the bulletin.
Earnings and employment from PAYE RTI statistics are available from July 2014.
A sample of de-identified HMRC PAYE RTI micro data can be accessed by researchers working on approved projects through the HMRC Datalab.
What the data measure
Earnings and employment from PAYE RTI statistics cover the UK and contain estimates of payrolled employees and their pay. The release covers people paid through PAYE where their pay is reported to HMRC through the RTI system. Estimates in the release are based on people who are employed in at least one job through PAYE, with monthly figures reflecting the average of such people for each day of the calendar month.
Each monthly publication links to supporting datasets, which contain estimates of the number of payrolled employees, total, mean and median pay, and inflows and outflows to PAYE. Employee and pay estimates are also available broken down by geographical regions (NUTS1, NUTS2 and NUTS3), industry sectors and age bands. Data are updated quarterly for local authority, region (NUTS1) by age band and region (NUTS1) by industry sector.
Strengths
Timely and frequent with a "flash" estimate published every month, usually two to three weeks after the end of the reference period.
Covers the whole population of employees paid through PAYE, rather than a sample of people or companies; this enables distributional analysis and estimates to be produced for small sub-groups of the employee population (for example, by geographic area) and cross-tabulations (for example, region by age or region by industry sector).
Not impacted by known response rate issues in survey-based earnings estimates.
Demonstrates the potential for alternative data sources to produce measures of earnings, which could potentially supplement existing earnings statistics based on surveys.
Potential for additional analysis such as decomposing the pay growth into components relating to inflows, outflows and those in continuous employment.
Limitations
Currently official statistics in development.
Does not include the self-employed.
Only captures the earnings of individuals who are paid through the PAYE system.
No information on education or qualifications.
No information on hours worked, so hourly rates cannot be derived.
Split between regular and bonus pay is not available.
Around 15% of the data for the first "flash" estimate is imputed. As a result, the estimates are revised as new payment returns are received.
Uses
More timely analysis of earnings statistics to help inform decision-making across the country.
Analysis of breakdowns not available on average weekly earnings (AWE), for example, geographical and age band breakdowns.
Annual Survey of Hours and Earnings
Annual Survey of Hours and Earnings (ASHE) statistics are published annually by the Office for National Statistics (ONS).
The ASHE publication is split into three separate bulletins. The main bulletin is Employee earnings in the UK with two supplementary bulletins Low and high pay in the UK and Gender pay gap in the UK.
They are designated as an accredited official statistic.
For more information, please contact the ONS at earnings@ons.gov.uk or call +44 1633 45 6120.
Source data
ASHE is a business survey sent to respondents in April each year. Businesses are asked to provide information on employees who fall within a 1% sample of the HM Revenue and Customs (HMRC) Pay As You Earn (PAYE) register taken in January of the same year (with follow-up surveys to capture those employees who change jobs or join the labour market between January and April). Before the coronavirus (COVID-19) pandemic the final ASHE dataset typically covered around 180,000 jobs from around 60,000 responding businesses. The achieved sample size was reduced during the pandemic, given the challenges to data collection, and was around 140,000 jobs between 2020 and 2022. Response rates have since started to improve and reached 173,000 in 2024.
Output data and availability
ASHE publishes a collection of datasets alongside the bulletins and a Guide to tables is published to help users identify which dataset is most relevant to their needs. While the main release focuses on full-time employees, the data cover part-time employees too, so that they can be analysed separately or incorporated with full-time employees. Where appropriate, analysis can also include those whose pay was affected by absence and/or those who were not on adult rates of pay.
ASHE and its predecessor surveys have been collected every year since 1970 allowing for comparison over time. It should be noted that weighted data are available from 1997 onwards, prior to 1997 data are unweighted. Furthermore, data prior to 1997 only cover Great Britain; data from 1997 onwards cover the UK.
Because of the sensitive nature of ASHE microdata, they are not available for download from the UK Data Service website but may be accessed through Secure Access arrangements. Access requires accreditation by the UK Statistics Authority as an Approved Researcher, completion of face-to-face training, and agreement to the Secure Access's User Agreement (PDF, 38.8 KB) and Breaches Penalties Policy (PDF, 385 KB). For more information on access to ASHE microdata, please see the UK Data Service.
What the data measure
ASHE provides information about the levels, distribution and make-up of earnings and hours paid for employees in all industries and occupations across the UK.
The main Employee earnings in the UK publication focuses on gross weekly earnings for full-time employees on adult rates of pay whose pay in the reference period was unaffected by absence. It covers:
weekly and annual earnings
earnings trends
earnings by occupation, industry, region, local authorities and public versus private sector
The Low and high pay bulletin focuses on the distribution of earnings of high- and low-paid jobs and jobs paid below the National Minimum Wage and National Living Wage, and the Gender pay gap bulletin focuses on the differences in pay between men and women.
The bulletins are accompanied by datasets with additional splits of the data, such as components of earnings (overtime and incentive pay), part-time versus full-time, or sex.
Because the sample upon which ASHE is based does not change from year to year (except for new entries or retirees), ASHE datasets are combined to create a panel dataset. This dataset observes the same employees in each year that they are in employment and their employer responded to the survey.
The panel dataset covers most of the same variables as the annual datasets, allowing for the analysis of hours and earnings for different cohorts of employees. For instance, the panel dataset has been used to analyse Earnings in the UK over the last four decades, by tracking those who were aged 21 years in 1975, 1985 and 1995 up to 2013 to compare the first 18 years of the careers of each cohort (from the age of 21 years).
Strengths
Long time series of data back to 1970.
Allows for analysis of the distribution of earnings in the UK; while this is also possible using the Labour Force Survey (LFS), ASHE is a more accurate source of information on earnings as the information is provided by employers rather than being self-reported by employees.
ASHE benefits from a large sample size, which, coupled with the array of individual and geographic characteristics that are also gathered, allows for more detailed analysis than other sources of earnings data.
Samples the same employees over time which allows for longitudinal analysis.
Limitations
Typically, a six to seven month lag from the reference period to publication.
Does not include the self-employed.
The selection of personal characteristics is more limited than other sources, such as the LFS.
There is no information on what individuals are doing when they are not present on the survey; they could be unemployed, have switched to self-employment, have exited the labour market for a period, or their employer may not have responded to the survey.
Bonus and incentive payments are known to be underestimated primarily because the information is not available to respondents when they complete the survey; data on annual bonus payments are thought to be better in this respect, though some respondents still do not have access to the necessary information when they complete the survey.
Uses
Principal source of data used in estimates of the public and private sector pay differential and the gender pay gap.
Principal data source used for estimating the number of employee jobs being paid below the National Minimum Wage and National Living Wage.
Labour Force Survey
Labour Force Survey (LFS) earnings information is published quarterly by the Office for National Statistics (ONS) as part of the UK Labour Market publication in datasets EARN04 to EARN08.
It is designated as an official statistic in development. Ongoing challenges with response rates and levels mean that LFS-based labour market statistics will be badged as official statistics in development until further review.
For more information, please contact the ONS at social.surveys@ons.gov.uk or call +44 1633 455678.
Source data
The LFS is a rolling survey of households, which has taken place on a quarterly basis since 1992. It is a main input into the monthly publication of labour market statistics, forming the basis for the rate and level of both employment and unemployment. Each sample is made up of approximately 25,000 responding households. Each household remains in the survey for five quarters with information on earnings requested only in quarters one and five, thus enabling year-on-year comparisons.
In addition, an annual version of the LFS dataset, the Annual Population Survey (APS), which has a larger sample, allows for more detailed analysis to be carried out.
Output data and availability
Earnings estimates from the LFS are published quarterly and typically cover:
gross weekly earnings of full-time employees by region, occupation and industry
the distribution of gross hourly earnings of employees
A time series is available from 1997.
LFS microdata include information on usual pay and why this may have differed from pay in the reference week. The LFS also captures respondents' take-home pay after "all deductions". It is important to note that this differs conceptually to the measure of take-home pay that can be estimated from the Annual Survey of Hours and Earnings (ASHE) as it may include deductions such as pension contributions and student loan repayments.
The microdata also covers a wide range of individual characteristics. The full catalogue of LFS variables can be found in the LFS user guides - Details of LFS variables.
LFS microdata can be accessed through the UK Data Service website under a standard End User Licence. More detailed microdata are available via the Secure Research Service.
What the data measure
The primary purpose of the LFS is the prompt publication of main aggregate whole economy indicators, for the integrated assessment of labour market conditions in the UK. The "labour market" covers all aspects of people's work, including the education and training needed to equip them for work, the jobs themselves, job search for those out of work, and income from work and benefits.
Therefore, the LFS collects information on a wide range of characteristics including both gross earnings (hourly and weekly) and take-home pay after deductions.
Strengths
Large array of classificatory variables (for instance education, ethnicity, nationality, and disability) that are not captured on ASHE and other surveys.
The LFS has a longitudinal element to its data as individuals' earnings data are captured in both waves one and five of the survey; this allows analysis of changes to individuals' earnings over the course of the year.
Limitations
Does not include residential institutions, therefore individuals in nursing or retirement homes, university halls of residence, prisons or detention centres or rough sleepers will not be included.
Known to underestimate hourly and weekly pay because of recall error from self-reported and proxy response information.
No earnings information is captured for the self-employed (although other information is captured for the self-employed).
Uses
Commonly used for analysis of official earnings statistics by characteristics that are not available on other sources, for example, the ethnicity pay gap is based on LFS and APS data.
Widely used in academia because of the ease of access offered by the UK Data Archive.
3. Household income
In the UK, there are two sources of household income. The first is the Department for Work and Pensions' (DWP) Households below average income (HBAI) report, which is based on the Family Resources Survey (FRS). This includes a measure of equivalised net household income, estimated both before housing costs (BHC) and after housing costs (AHC).
The second is the Office for National Statistics' (ONS) Household disposable income and inequality (HDII) and Effects of taxes and benefits on household income (ETB) publications, which include a measure of equivalised disposable (or net) household income. Although not specified in the release, this measure is BHC. The main ETB publication also has estimates of original income, gross income, post-tax income and final income.
While DWP's measure of equivalised net household income (BHC) is similar to the ONS's measure of equivalised disposable (or net) household income, there are methodological differences, including the following.
Weekly or annual household income; DWP statistics present weekly household income based on respondents' usual income at the time of the interview. In contrast, ONS statistics present annual household income adjusted for known changes to respondents' circumstances over the financial year (for example, a change from full to part-time hours).
Pension contributions; DWP's net household income statistics are calculated after pension contributions, while the ONS's are calculated before pension contributions.
Top income adjustments; Both sets of statistics use Survey of Personal Income (SPI) data from HM Revenue and Customs (HMRC) to adjust for known under-reporting at the top end of the income distribution. DWP replaces the main income components data of the richest 0.32% and 1.16% of earners (for working-age people and pensioners, respectively), while the ONS replaces the earnings data of the top 3% of earners.
Employer-provided benefits; Both sources include imputed income from employer-provided benefits. DWP includes fuel for personal use, childcare and other vouchers. The ONS includes more benefits, for example, the use of company cars and associated fuel, imputed rents where rent-free or subsidised rent is tied to employment, mortgage payments when paid by the employer and private medical insurance provided by the employer.
Benefits in kind; DWP household income includes the cash value of certain forms of income in kind (such as free school meals, Healthy Start vouchers, free school milk, free school fruit and vegetables, and free TV licences for those aged 75 years and over who receive Pension Credit). For ONS statistics, benefits in kind are included in final income.
Deflation; DWP income statistics (BHC) are deflated using the Consumer Prices Index (CPI) plus Mortgage Interest Payments (MIPs), ground rent and dwellings insurance. The ONS's are deflated using the Consumer Prices Index including owner occupiers' housing costs (CPIH) excluding Council Tax.
Survey design and weighting; Sample designs are similar for DWP and the ONS as both use stratified, cluster sampling for Great Britain households based on private household addresses drawn from the postcode address file (PAF) and systematic, stratified sampling for Northern Ireland households. However, DWP statistics have a wider set of calibration groups to weight responses.
There are also comparable income inequality statistics within these releases, further details are set out in Income statistics: Coherence and comparison information (PDF, 330.5KB).
Admin-based income statistics (ABIS) are also available aggregated to region and country level (for England and Wales) but are presented in the Income statistics for local areas section of this guide. ABIS are official statistics in development.
This section also covers longitudinal surveys, which collect household income statistics. These statistics are important to understand how income changes overtime, especially in relation to persistent low income (which is used as a measure of persistent poverty). Income Dynamics, based on the Understanding Society Survey published by DWP, is currently the only source of longitudinal household income statistics. The ONS historically led the production of European Union Statistics on Income and Living Conditions (EU-SILC) and the publication Persistent poverty in the UK and EU.
Households below average income
Households below average income (HBAI) report is published annually by the Department for Work and Pensions (DWP) on GOV.UK.
It is designated as an accredited official statistic.
For more information on HBAI, please contact DWP at team.hbai@dwp.gov.uk
Source data
HBAI uses data from the Family Resources Survey (FRS). Please see the FRS section for further information.
Output data and availability
Results are available for the UK from financial year ending (FYE) 2003, with earlier results for Great Britain available from FYE 1995.
Users can access the data and produce customised tabulations using Stat-Xplore. For more specific usage, HBAI microdata can be accessed under a standard End User Licence on the UK Data Service website.
More detailed microdata are available as a Secure Access File to be used in the Safe Room at the University of Essex. Additional approval is needed for this level of access.
What the data measure
HBAI presents statistics and information on living standards in the UK. The primary measure used in the HBAI is net household income adjusted for household composition (called equivalisation), estimated on both a before housing costs (BHC) and after housing costs (AHC) basis.
The HBAI statistics incorporate widely used, international standard measures of low income and inequality. DWP has published an infographic summarising the process behind estimates of low income in the HBAI.
There are a range of measures of low income, income inequality and material deprivation, which capture different aspects of changes to living standards. A household is said to be in relative low income if their equivalised income is below 60% of median income, while they are in absolute low income if their equivalised income is below 60% of the 2010 to 2011 median income adjusted for inflation.
HBAI is considered to be the primary source for data and information on household income, income poverty, income inequality and material deprivation in the UK.
Annual estimates for several statistics related to the number and percentage of people living in low-income households are provided against several important groups including children, working-age adults, pensioners, and individuals living in a family where someone is disabled.
Net household income (BHC) combines the income of all household members including dependants. It includes the following components:
usual net earnings from employment
income from self-employment
income received from dividends (from FYE 2022)
state support benefits and tax credits
income from occupational and private pensions
investment income
maintenance payments, if a person receives them directly
income from educational grants and scholarships (including, for students, top-up loans and parental contributions)
the cash value of certain forms of income in kind (free school meals, Healthy Start vouchers and free school milk, free school fruit and vegetables, and free TV licence for those aged 75 years and over who receive Pension Credit)
Net household income (BHC) is net of the following items:
Income Tax payments
National Insurance contributions
domestic rates or Council Tax
contributions to occupational pension schemes
all maintenance and child support payments, which are deducted from the income of the person making the payment
parental contributions to students living away from home
student loan repayments
Net household income (AHC) is derived by deducting a measure of housing costs from the previously detailed income measure.
Housing costs include the following main components:
rent (gross of housing benefit)
water rates, community water charges and council water charges
mortgage interest payments
structural insurance premiums (for owner-occupiers)
ground rent and service charges
Negative household incomes BHC are reset to zero, but negative household incomes AHC are possible.
HBAI covers:
numbers and proportions of people living in relative low-income households, before and after housing costs
numbers and proportions of people living in absolute low-income households, before and after housing costs
a measure of income inequality, specifically the Gini coefficient [Note 1]
a measure of material deprivation for children, working-age adults and pensioners which was updated for FYE 2024
statistics on household food security and food bank usage, including in combination with low income
household income distributions and averages before and after housing costs
income components including income from wages, self-employment and benefits
household income in real terms (calculated using bespoke variants of the Consumer Prices Index (CPI) to adjust for inflation)
Please see the DWP Statistical Work Programme for updates on developments and planned future releases.
Strengths
Time series of consistent data back to 1995.
Large sample size and breadth of variables allow for detailed sub-category analysis.
Includes a measure of household income after housing costs (which is estimated using housing costs collected on the FRS survey).
The statistics contribute to DWP's statutory obligation to publish four measures of low income and material deprivation for children, as detailed under Section 4 of the Welfare Reform and Work Act 2016.
Provides estimates of household income in real terms (in other words, household income adjusted for inflation).
Limitations
Does not include residential institutions, therefore individuals in nursing or retirement homes, university halls of residence, prisons or detention centres or rough sleepers will not be included.
Typically, a 12-month lag from the reference period to the publication.
Known under-reporting of benefit receipt.
Known under-reporting at the top and bottom of the income distribution (although an adjustment is applied to correct for under reporting at the top of the income distribution).
Not suitable for analysis below the regional level or by small sub-groups (for example by ethnicity) without combining survey years and/or it will be subject to wider confidence intervals.
All household members are treated equally in terms of overall household income, in other words, equivalised household income is calculated and then all household members are in low income ("poverty") if the household's income is below 60% of the median; this is a more reasonable assumption where household members are related.
Uses
Informing policy development and monitoring of low income across the population.
International comparisons with Organisation for Economic Co-operation and Development (OECD) countries.
Parliamentary, academic, journalists, voluntary sector and lobby group analysis; examples include using the HBAI data to examine income inequality, poverty, the distributional impacts of fiscal policies and understanding the income profiles of vulnerable groups.
Used for the analysis of low income by researchers and across central government and the devolved governments.
For more details, please see the FRS: background information and methodology, FRS: quality assessment report and HBAI quality and methodology information report.
Effects of taxes and benefits on household income
The Effects of taxes and benefits on household income (ETB) output published by the Office for National Statistics (ONS) is split into two annual publications. The first is a headline release, called Household disposable income and inequality (HDII), which consists of two pages: Average household income and Household income inequality. The main ETB publication comes out several months later, providing additional detail on the impact of taxes and benefits on the distribution of income. The HDII publication is based on the same dataset as the main ETB publication, which means the figures are consistent between the two publications.
It is designated as an accredited official statistic.
For more information, please contact the ONS at hie@ons.gov.uk or call +44 1633 45 6082.
Source data
From financial year ending (FYE) 2018 onwards, the ETB dataset is sourced from the Household Finances Survey (HFS) which is a combination of data from the Living Costs and Food Survey (LCF) and the Survey of Living Conditions (SLC).
In February 2025, the ONS announced the cessation of the SLC. This was part of the ONS's strategy to deal with falling survey response rates and to boost samples that underpin headline economic statistics on prices and the labour market. This will affect future releases in this series with a sample size reduction, which may lead to further suppression of individual income components. In recent years the LCF has a sample of around 6,000 households, while the SLC has a sample of around 11,000 households (of which around 6,000 are longitudinal).
In addition, the main ETB release uses several administrative sources to improve the quality of estimates, particularly for estimates of indirect taxes (for example, Value Added Tax (VAT)) and benefits in kind paid by the state (for example, state education and healthcare).
Output data and availability
Output tables are published alongside the bulletins. Comparable time series estimates are available from 1977.
The final anonymised ETB microdata are supplied to the UK Data Archive under an End User Licence and to the Secure Research Service (SRS), managed by the ONS.
ETB microdata (and LCF and SLC survey microdata) are available at various levels of detail under different user agreements.
What the data measure
ETB statistics cover the UK. For the headline HDII publication, the Average household income page includes measures of net household income, adjusted for household composition (called equivalisation), with breakdowns by quintile and by people living in retired households.
The second page, Household income inequality provides insight into estimates of income inequality using measures such as the Gini coefficient [note 1] and typically includes further breakdowns such as by people living in retired households.
The main ETB publication provides additional information on how taxes and benefits affect the incomes of households in the UK. This includes estimates of both direct and indirect taxes, cash benefits (also known as state benefits) and benefits in kind paid for by the state (for example, state education and healthcare). As a result, the main ETB bulletin contains five measures of household income:
original income
gross income
disposable or net income
post-tax income
final income
Household disposable income combines the income of all household members including dependants. It includes the following components:
usual net earnings from employment
income from self-employment
state support benefits and tax credits
income from occupational and private pensions
investment income
imputed income from employer-provided benefits in kind, for example, a company car or medical insurance
additional sources, for example, maintenance payments, if a person receives them directly
Household disposable income is net of the following components:
Income Tax payments
National Insurance contributions
domestic rates or Council Tax
student loan repayments
Final income accounts for the following indirect components:
indirect taxes, for example, VAT, TV licence, Stamp Duty
imputed income from state-provided benefits in kind, for example, state education, healthcare or travel subsidies
The publication and tables also look at:
long-term trends in household income for income quintiles and deciles, with detailed breakdowns by income component (including individual taxes and benefits)
income for quintiles and deciles of retired and non-retired households, with detailed breakdowns by income component
long-term trends in income inequality, measured through the Gini coefficient [note 1] and S80/S20 [note 2] and P90/P10 [note 3] ratios
average incomes, taxes and benefits by household type, tenure status and region
taxes paid (direct and indirect) as a proportion of income and expenditure
households receiving more in benefits than paid in taxes
characteristics of income quintile or decile groups (including number of adults or children, household type, tenure, age or employment status of chief economic supporter)
household income in real terms (calculated using a bespoke variant of the Consumer Prices Index including owner occupiers' housing costs (CPIH) to adjust for inflation)
Strengths
Time series of consistent data back to 1977.
Consistent with international standards (for example, UN Economic Commission for Europe, Handbook on Household Income Statistics, 2011).
Provides post-tax income, which is estimated using expenditure information to derive indirect taxation (such as VAT and alcohol duties).
Provides final income, which is estimated by including benefits in kind provided by the state (such as state education and healthcare).
Allows for analysis of the distributional impact of government policy on taxes and benefits, including indirect taxes and benefits in kind.
An ideal source for analysis of household income that includes a breakdown by income component, individual taxes and benefits.
Provides estimates of household income in real terms (in other words, household income adjusted for inflation).
Limitations
Does not include residential institutions, therefore individuals in nursing or retirement homes, university halls of residence, prisons or detention centres or rough sleepers will not be included.
Typically, a 10-month lag from the reference period to the publication of headline household income, and a 15-month lag to the publication of the main Effects of taxes and benefits publication.
Likely to under-report benefit receipt.
Known under reporting at the top and bottom of the income distribution (although an adjustment is applied to correct for under reporting at the top of the income distribution).
Estimates for small sub-groups and geographical areas can only be produced by combining survey years together and/or will be subject to wide confidence intervals.
Uses
The primary source used by HM Treasury in their Intra-Governmental Tax and Benefit Microsimulation Model (IGOTM); this is used to model possible tax and benefit changes before policy changes are decided and announced.
Joint analysis of income and expenditure, to better understand people's economic well-being in terms of their material living standards.
Income Dynamics
Income Dynamics are published annually by the Department for Work and Pensions (DWP) on GOV.UK.
They are designated as an accredited official statistic.
For more information, contact DWP at teamincome.dynamics@dwp.gov.uk.
Source data
Income Dynamics are based on Understanding Society (USoc), a longitudinal survey run by the University of Essex. Fieldwork is conducted over a two-calendar-year period, with each individual being interviewed on a yearly basis. The longitudinal sample included in Income Dynamics in 2010 to 2011 was around 76,000 individuals; this had fallen to 23,800 individuals in 2022 to 2023.
Output data and availability
Supporting tables are published alongside the annual report. These provide further breakdowns on persistent low income and movements within the income distribution.
A time series is available from the second wave of USoc (2010 to 2011).
Income Dynamics microdata are not publicly available.
What the data measure
Income Dynamics provides information on changes in income over time in the UK. It presents findings on persistent low income and the characteristics of individuals in persistent low income, including children, working-age adults and pensioners, both before housing costs (BHC) and after housing costs (AHC). An individual is described as being in persistent low income if they are in relative low income in at least three out of four consecutive years.
Data are also published for low-income entry and exit rates, movements between quintiles over time, and where in the income distribution individuals spend the most time. Income Dynamics also explores the relationships between certain income, employment and demographic events and low-income entry and exit.
They complement the cross-sectional low-income statistics presented in households below average income (HBAI).
Income Dynamics statistics have been produced since 2017 in response to DWP's statutory obligation to publish a measure of persistent low income for children, under Section 4 of the Welfare Reform and Work Act 2016.
The income measure used in Income Dynamics is weekly net equivalised household income. This comprises total income from all sources of all household members including dependents. Income is adjusted for household size and composition by means of equivalisation scales. Incomes are also adjusted for inflation, corresponding to the middle January of the latest USoc wave. Like the HBAI series, Income Dynamics uses variants of the Consumer Prices Index (CPI) to adjust for inflation and to look at how incomes are changing over time in real terms.
Please see the DWP Statistical Work Programme for updates on developments and planned future releases.
Strengths
Provides longitudinal information on low incomes and persistent low incomes.
Allows the calculation of rates of entry into, and exits from, low income as well as analysis of movements within the income distribution overall.
Provides insight into the relationships between income, employment and demographic changes and low-income entry and exit.
Provides estimates of household income in real terms (in other words, household income adjusted for inflation).
Limitations
Does not include residential institutions, therefore individuals in nursing or retirement homes, university halls of residence, prisons or detention centres or rough sleepers will not be included.
Typically, a 15-month lag from the end of the reference period to the publication.
As with most longitudinal surveys, attrition has reduced the USoc sample size over time; this has resulted in small sample sizes for some groups (for example, some ethnicity categories), leading to increased suppression; the University of Essex has introduced boost samples to address issues associated with attrition.
USoc produces weighting factors rather than grossing factors, so estimates of the numbers of individuals in low income are not produced; instead, percentages of the population are provided.
There are known issues with the income information in the first USoc wave covering 2009 to 2010 and it is therefore excluded from all Income Dynamics analysis (for further information see Does repeated measurement improve income data quality?).
Uses
- The data are used by policy and analytical teams within the DWP, the devolved governments (for example, the Scottish Government's persistent poverty statistics), other government departments (for example, the Race Disparity Unit's Ethnicity Facts and Figures publication), Parliament, academics, think tanks, journalists, and the voluntary sector.
EU Statistics on Income and Living Conditions
European Union Statistics on Income and Living Conditions (EU-SILC) for the UK and other EU countries are published annually on Eurostat's website, along with more detailed articles and analysis.
The UK has not supplied these statistics to Eurostat since leaving the EU but data up to and including the 2018 calendar year remain available.
For more information, please contact the Office for National Statistics (ONS) at hie@ons.gov.uk
Source data
In the UK, the EU-SILC survey source is the Survey of Living Conditions (SLC) conducted by the ONS. In February 2025, ONS announced the cessation of the SLC. In recent years it has a sample of around 11,000 households (of which around 6,000 are longitudinal).
Output data and availability
EU-SILC is co-ordinated by Eurostat (the European Commission's statistical agency) under European Commission regulation.
Indicators and reports based on EU-SILC data are made available through the Eurostat website.
The main series is available from 2005, with limited information available from 1995.
More detailed analysis of EU-SILC is frequently published by the European Commission in publications such as Employment and Social Developments in Europe.
EU-SILC microdata are available to researchers through Eurostat's User Database (UDB).
What the data measure
EU-SILC is the EU reference source for comparative statistics on income, poverty, social exclusion and living conditions at the European level.
It provides two types of annual data for the 28 European Union countries as well as Iceland, Norway, Switzerland and Turkey:
cross-sectional data pertaining to a given time or a certain time period with variables on income, poverty, social exclusion and other living conditions
longitudinal data pertaining to individual-level changes over time, observed periodically over a four-year period
Strengths
Provides longitudinal information on low incomes and persistent low income (which is used as a measure of persistent poverty).
Consistency of the variables and concepts allows for meaningful comparative analysis across the EU.
Limitations
Does not include residential institutions, therefore individuals in nursing or retirement homes, university halls of residence, prisons or detention centres or rough sleepers will not be included.
EU-SILC is harmonised across the EU in terms of variables and concepts, but the means of data collection are more loosely specified, therefore, some countries collect data via household surveys, while others collect information via administrative sources; additionally, there may be variation between countries because of translation issues with the questionnaire, or culturally-based differences.
The need to specify a framework for classifying income that is consistent across countries means that the benefit income variables made available to researchers are grouped into streams such as "old-age benefits", rather than classified by the specific benefit themselves.
Uses
The main source of data used for policy monitoring and development at a European level; at a national level, this comparability is helpful in allowing researchers to examine what is happening in the UK in comparison with other countries with different welfare regimes and different policy interventions.
By policymakers to understand levels of persistent poverty.
Notes for: Household income
The Gini coefficient is the most widely used summary measure of inequality in the distribution of household income. The lower its value, the more equally household income is distributed.
The income quintile share ratio or the S80/S20 ratio is a measure of the inequality of income distribution. It is calculated as the ratio of total income received by the 20% of the population with the highest income (the top quintile) to that received by the 20% of the population with the lowest income (the bottom quintile).
The income decile ratio or the P90/P10 ratio is a measure of the inequality of income distribution. It is calculated as the ratio of the level of income at the 90th percentile to the level of income at the 10th percentile.
4. Individual income
Survey of Personal Incomes
The personal income statistics release is published annually by HM Revenue and Customs (HMRC) on the GOV.UK website.
It is designated as an accredited official statistic.
For more information, please contact HMRC at spi.enquiries@hmrc.gov.uk.
Source data
Personal income statistics are based on data from the Survey of Personal Incomes (SPI). The SPI is an administrative dataset based on information held by HMRC on individuals who could be liable to UK tax. It is carried out annually by HMRC and covers income assessable to tax for each tax year.
HMRC holds information about individuals who could be liable to UK Income Tax in two operational computer systems:
the National Insurance and Pay As You Earn (PAYE) Service (NPS) system covers all employees and occupational pension recipients with a PAYE record
the Computerised Environment for Self Assessment (CESA) system covers people with self-employment, rental or untaxed investment income and it also covers directors, those subject to higher rate tax and other people with complex tax affairs; where people have both NPS and CESA records, their CESA record is selected because it provides a more complete picture of their taxable income
Separate samples are drawn from these systems and then joined together to create the SPI.
For more information about how the SPI is constructed, its coverage and methodological changes from previous SPIs, please see the supporting documentation and quality report.
The SPI sample for tax year ending (TYE) 2022 has approximately 850,000 observations.
Output data and availability
Aggregated SPI output data are available from TYE 2011 onwards.
Personal income survey bulletins for TYE 2010 and earlier are on the National Archives website.
SPI Public Use Tape (PUT) microdata are available to approved researchers on the UK Data Service website.
What the data measure
The personal income statistics publication covers the UK and contains information on total gross income and breakdowns of different types of income by, for example, age, geographical breakdown (region, local authority district, Parliamentary constituency), sex and self-employment.
Strengths
Based on administrative data so it is the best source for taxable income.
Large sample size, which allows for detailed analysis and sub-regional breakdowns.
Includes details on types of income (for example, employment, self-employment, pensions, dividends, property income) and Income Tax liability.
Limitations
Typically, a two-year lag from the reference period to the publication.
The SPI is an individual-level survey based on administrative records; therefore, household income cannot be derived.
The publication focuses on taxpayers (and not those below the Personal Allowance threshold); however, the SPI dataset does include information on individuals below the Personal Allowance threshold.
The SPI covers only taxable benefits (or benefits in kind); therefore, it does not capture benefits such as Universal Credit or Housing Benefit.
The SPI sample is not stratified by geographical area; therefore the precision of estimates depends on measuring the proportion of the UK population that belong to an area. Please see the supporting documentation and quality report for more detail.
Uses
The SPI is compiled to provide a quantified evidence base from which to cost proposed changes to tax rates, personal allowances and other tax reliefs for Treasury Ministers; it is used to inform policy decisions within HMRC and HM Treasury, and the devolved governments, as well as for tax modelling and forecasting purposes.
It is used to provide summary information for the regional accounts that are prepared by the Office for National Statistics.
It is used to provide information to Members of Parliament, other government departments, companies, organisations and individuals.
The tables in the personal income statistics publication are of interest to policymakers in government, academics, journalists, "think-tanks" and other research bodies; they would be of use to individuals or organisations interested in the distributions of numbers and amounts of personal incomes, for example, by taxpayer marginal rate or income band.
5. Household sector income
The statistics in this section measure the income of the household sector, which are produced according to the System of National Accounts.
Gross disposable household income
National accounts estimates of gross disposable household income (GDHI) form part of the household sector accounts published quarterly by the Office for National Statistics (ONS). GDHI estimates are available in Table HH2 of the Quarterly sector accounts datasets and in Table 6.2.4 of the UK Economic Accounts.
It is designated as an accredited official statistic.
For more information, please contact the ONS at saving.ratio@ons.gov.uk or call +44 1633 45 5972.
Source data
As with other components of the national accounts, household sector accounts are compiled using information from a multitude of different sources, including household and business surveys as well as administrative records, to ensure that estimates are as coherent and integrated as possible.
Output data and availability
Household sector accounts are published by the ONS on a quarterly and annual basis. Quarterly statistics are available from Quarter 1 (Jan to Mar) 1955 and annual statistics are available from 1948.
What the data measure
Household sector accounts cover the UK. The following process is used to derive GDHI:
total household income equals gross operating surplus plus mixed income plus compensation of employees plus property income plus pension income plus Social Security benefits received (other than pensions), plus miscellaneous transfers and insurance claims received
total uses equals taxes paid plus social contributions paid plus property expenditures plus miscellaneous transfers and insurance premiums paid
GDHI equals total household income minus total uses
Estimates in the household sector accounts are comparable across time and across countries as they are produced in line with international standards set out in the European System of Accounts: ESA 2010 and the UN System of National Accounts 2008: SNA 2008. However, the entire back series is not always comparable because of changes in international national accounts standards over this period.
Strengths
It includes the income of institutional households often excluded from other survey sources of income.
Annual data are available from 1948 (and 1955 on a quarterly basis).
Recent data are widely comparable on an international basis as it follows the ESA 2010 and SNA 2008 regulations on national accounts.
Constant price estimates (which exclude the effects of inflation) are available, which are called real households' disposable income (RHDI).
Limitations
- Because of compliance with national accounts concepts, it includes the imputed rental of owner-occupiers as income, and therefore the estimates may not match specific user requirements; however, household gross disposable income with imputed rental removed are available as an official statistic in development in Table HH_Alt of the Quarterly sector accounts datasets.
Uses
Its main use is within the calculation of gross national income (GNI) and gross domestic product (GDP).
To inform decisions made by policymakers in both central and local government.
Frequently used in academia.
Regional gross disposable household income
Regional gross disposable household income (GDHI) data are published annually by the Office for National Statistics (ONS).
They are designated as an accredited official statistic.
For more information, please contact the ONS at regionalaccounts@ons.gov.uk or on +44 1633 45 6878.
Source data
A "top-down" approach is used for the production of regional GDHI estimates whereby the national aggregate, consistent with the UK national accounts, is allocated to regions using a regional indicator dataset. Numerous regional indicator datasets are used in the production of regional GDHI, comprising survey and administrative data, which conform as far as possible to international standards.
Output data and availability
Regional GDHI estimates are available from 1997 and are consistent with the UK national accounts.
Regional GDHI estimates are available at four geographical levels, in accordance with the UK International Territorial Levels (ITL):
ITL1: Wales, Scotland, Northern Ireland and the nine English regions; can be referred to as countries and regions
ITL2: 46 regions - mainly groups of counties and unitary authorities; can be referred to as sub-regions
ITL3: 182 regions - principally individual counties and unitary authorities; also known as local areas
LA: 361 local authority or local council areas
Local authority estimates can be aggregated to form other geographic breakdowns such as combined authorities, city regions and local enterprise partnerships (LEPs), which are also available to download.
These data are also available on the Nomis website.
What the data measure
GDHI is the amount of money that all of the individuals in the household sector have available for spending or saving after they have paid direct and indirect taxes and received any direct benefits. GDHI is a concept that is seen to reflect the "material welfare" of the household sector.
The household sector comprises all individuals in an economy, that is, people living in traditional households as well as those living in institutions such as retirement homes and prisons. It should be noted that regional GDHI relates to all individuals within the household sector for a region and not to an actual average household or family unit.
Total regional GDHI and the components of income are published in pounds million, pounds per head and per head index at all four geographical levels. Estimates are produced at current prices, which means the effect of inflation has not been removed.
Allocation of primary income account:
resources: operating surplus, mixed income, compensation of employees and property income received
uses: property income paid
Balance of primary income equals primary resources minus primary uses.
Secondary distribution of income account:
resources: social benefits and other current transfers received
uses: current taxes on income and wealth, social contributions and other current transfers paid
Balance of secondary income equals secondary resources minus secondary uses.
The balancing items of these two accounts then allow us to calculate GDHI as:
- GDHI equals balance of primary income plus balance of secondary income
The methods and data used are consistent with the guidance set out in the European System of Accounts 2010: ESA 2010.
Strengths
As with the national estimates, regional GDHI includes the income of institutional households often excluded from other survey sources of income.
Provides GDHI for low-level geographies (specifically ITL1, ITL2, ITL3 and local authority levels, plus additional areas of economic interest, allowing for comparison across UK and European areas).
It is considered valuable as a measure of relative wealth between regions.
Provides an overview of economic diversity and social welfare at regional, sub-regional and local area levels.
Limitations
Because of compliance with national accounts concepts, it includes the imputed rental of owner-occupiers as income; therefore, the estimates may not match specific user requirements.
Constant price estimates of regional GDHI (which exclude the effects of inflation) cannot be produced because of the lack of appropriate regional deflators.
Typically, a 16 to 18-month lag from the reference period to the publication of regional GDHI estimates.
Regional GDHI does not take account of mortgage capital repayments or payments of rent (except as income of private landlords); in national accounts terms, the former is counted in the capital account, while the latter is considered final consumption expenditure.
Regional GDHI gives no information on the spending patterns of households; however, regional household final consumption expenditure is being developed.
Uses
- Used by the UK government and the devolved governments of Northern Ireland, Scotland and Wales to formulate and monitor economic policy and allocate resources.
6. Income statistics for local areas
This section covers household income statistics for small areas. There are two outputs, both published by the Office for National Statistics (ONS).
The first is Small area income estimates (SAIE). These survey-based estimates are modelled by combining Department for Work and Pensions (DWP's) Family Resources Survey (FRS) data and Households below average income (HBAI) data with census and administrative data. They are published approximately every two years. SAIE are designated as accredited official statistics and are the main source of income estimates for small areas. SAIE are disseminated at a Middle-layer Super Output Area (MSOA) level, while the DWP FRS and HBAI statistics are published at regional level (and for inner and outer London). As SAIEs are calibrated to the FRS and HBAI estimates at a regional and national level, they fully align to these estimates.
The second are Admin-based income statistics (ABIS), which are being developed to examine whether alternative data sources can be used to measure income for small areas. ABIS use administrative data from HM Revenue and Customs' (HMRC) Pay As You Earn (PAYE) Real Time Information (RTI) and Self Assessment systems and the DWP's benefit systems. ABIS are designated as official statistics in development and are published on an ad hoc basis. Therefore they are not currently recommended for use in policy or decision making.
Small area income estimates
Small area income estimates (SAIE) are published approximately every two years by the Office for National Statistics (ONS).
They are designated as an accredited official statistic.
For more information, please contact the ONS at amie@ons.gov.uk.
Source data
The technique used to produce SAIE is a multiple linear regression model with synthetic estimation. This technique is used when survey data alone are insufficient to produce accurate estimates of income for smaller geographical areas. Combining survey data with other data sources known as auxiliary data or covariates (which can be obtained from administrative data or a previous census) can provide estimates for small areas.
To produce Small area income estimates, it is necessary to model the area-level relationship between the survey variables and auxiliary variables. The survey data can be used to estimate the mean level of income for a particular type of individual within the larger population, while other data sources can be used to estimate the proportion of a particular type of individual living within the small area, for example, the proportion of the population claiming Income Support. The relationship between the two can then be fitted to derive an estimate of weekly household income within a small area. The fitted model produces an estimate that describes the relationship between the area-level values of the target survey variable and the auxiliary variable.
This modelling methodology enables survey data from the Family Resources Survey (FRS) to be combined with census and administrative data to improve the quality of estimates at the small area level. As the estimates are model-based they are different to standard survey estimates.
Output data and availability
SAIE are available from financial year ending (FYE) 2005 onwards.
Users can not currently access SAIE microdata.
What the data measure
SAIE provide average (mean) household income for small areas within England and Wales. It is the income a household receives from wages and salaries, self-employment, benefits, pensions, plus any other source of income. These estimates are produced at the Middle-layer Super Output Area (MSOA) level.
The SAIE are produced for four different income types:
average weekly gross household income
average weekly net household income
average weekly net household income (equivalised) (also known as average weekly equivalised net household income before housing costs (BHC))
average weekly equivalised net household income after housing costs (AHC)
Strengths
Provides household income for low-level geographies (specifically the MSOA level).
Includes a measure of equivalised net household income after housing costs (which is modelled using housing costs collected on the FRS survey).
Limitations
Does not include Scotland and Northern Ireland.
Typically, a two to three year lag from the reference period to the publication.
SAIE are subject to the same coverage constraints and response rates as the FRS and therefore implicitly it does not include residential institutions; this means that individuals in nursing or retirement homes, university halls of residence, prisons or detention centres or rough sleepers are not included.
Only produces mean estimates of income, unable to produce median or percentile estimates of income because of the modelling methodology used.
The modelling process tends to shrink estimates towards the average level, so the true distribution of local area average incomes has more extreme high and low values.
There is no information on the distribution of household income within or between areas; this is a limitation as some areas will have a more skewed distribution (with a small number of households having very high income) than others.
The estimates do not enable direct comparisons of household income over time for a given area; however, the 95% confidence intervals can be used to make indicative comparisons.
The models selected are the best possible to describe the general pattern of income over all areas but the use of independent models for each income measure can occasionally result in implausible inconsistencies within the point estimates (for example, higher net income than gross income for a given MSOA); confidence intervals help summarise the variability caused by the modelling process and should be used alongside point estimates when interpreting the outputs.
Uses
- These data are used to help identify deprived and disadvantaged communities, to support work on social exclusion and inequalities, evaluation research, provision of information for practitioners, and the profiling of geographical areas.
Admin-based income statistics
Admin-based income statistics (ABIS) are published by the Office for National Statistics (ONS).
They are designated as an official statistic in development.
The ABIS are published on an ad-hoc basis in line with developments made as part of our transformation research. These developments include significant updates to methodology and/or when new sources of administrative income data become available. Therefore, these statistics are not currently recommended for use as an official indicator of poverty or living standards.
The ABIS demonstrate progress towards using administrative data to produce small area income statistics, with the potential to cover the income distribution across the population and an opportunity to examine this distribution across a range of population characteristics. They are also available aggregated to region and country level.
For more information, please contact us at amie@ons.gov.uk.
Source data
The ABIS bring together Pay As You Earn (PAYE), Self Assessment and benefits administrative data sourced from HM Revenue and Customs (HMRC) and Department for Work and Pensions (DWP) systems to derive gross and net individual and occupied address income statistics.
Output data and availability
Downloadable aggregate datasets are published alongside the ABIS release, which typically include experimental gross and net income deciles for England and Wales, regions, local authorities, and Lower-layer Super Output Areas (LSOAs). As the ABIS represent feasibility research, data availability may change as these statistics are developed over time.
The latest ABIS are currently available for the tax year ending 2018.
Users cannot access ABIS microdata.
What the data measure
As the ABIS are designated as official statistics in development, the information provided can change between publications. The outputs cover small areas within England and Wales. ONS's latest release includes:
Gross and net income percentiles for individuals by:
age and sex
region
local authority
LSOA
Gross and net income percentiles for occupied addresses by:
region
local authority
LSOA
Gross income as captured in the ABIS consists of:
income from employment, including employee income captured by HMRC's PAYE system and income from self-employment as reported by HMRC's Self Assessment system
current transfers received, including occupation and private pensions captured by HMRC's PAYE system, social assistance benefits, pensions or schemes captured through the available administrative data, and imputed measures of Christmas Bonus and Winter Fuel Payment
ABIS net occupied address income statistics are equivalised to account for differences in occupied address size.
Strengths
The ABIS have the potential to provide individual and occupied address income for low-level geographies (currently produced for the LSOA level).
They have the potential to produce analysis by small sub-groups of the population.
They are not impacted by known response rate issues in survey-based income estimates.
Limitations
The ABIS are currently official statistics in development.
The gross income measure is still under development and is missing some income components (such as investment and property income).
The net income measure is currently incomplete.
The ABIS include a measure of income for "occupied addresses," which differs from the typical measure of "households" used in survey and census statistics.
Scotland and Northern Ireland are not included.
The ABIS will only capture the incomes of individuals who appear in the administrative data; for example, they will not capture employee income for those not paid through the PAYE system.
They are impacted by the quality of the admin-based population base, which is also under development and known to have issues with over- and under-coverage.
Uses
- Given ABIS are under development, current application to decision making is limited. We welcome user feedback as we continue to develop this methodology.
7. Other income
The sources covered in this section either cover a specific measure of income or income may not be the primary focus of the output.
Family Resources Survey
The Family Resources Survey (FRS) report is published annually by the Department for Work and Pensions (DWP) on GOV.UK.
It is designated as an accredited official statistic.
For more information, please contact DWP at team.frs@dwp.gov.uk.
Source data
The FRS has returned to pre-coronavirus (COVID-19) pandemic fieldwork practices with an achieved sample in the region of 20,000 households, from financial year ending 2024.
The FRS has been running for over 30 years, since 1992 and is an annual cross-sectional survey. Until financial year ending 2003, the survey covered Great Britain; it was then extended to cover the UK.
Output data and availability
Users can access the data and create bespoke tabulations using Stat-Xplore. FRS microdata can be accessed under a standard End User Licence on the UK Data Service website. More detailed microdata are available as a Secure Access File to be used in the Safe Room at the University of Essex. Additional approval is needed for this level of access. Data are also available at the ONS Secure Research Service.
What the data measure
The FRS collects information on the incomes and circumstances of private households in the UK.
Information can be derived on an individual, family (benefit unit) or household level depending on which is the most appropriate.
The FRS is the primary data source for Households below average income (HBAI), the Pensioners' Incomes (PI) statistics and also the Separated Families statistics. It is also a main source of data for estimates within Income-related benefits: estimates of take-up, the Children in Low Income Families (CiLIF) release, and the ONS's Small area income estimates (SAIE).
Although the source survey is relatively large (with an achieved sample of 20,000 for financial year ending 2024), estimates for smaller sub-groups and geographical areas need to be produced by combining multiple survey years together, and/or will be subject to wide confidence intervals.
Please see the FRS: release strategy for confirmed changes to FRS statistics and the DWP Statistical Work Programme for future developments and releases.
Strengths
Large sample size and breadth of variables allows for detailed sub-category analysis.
The most comprehensive source of self-employed income data, linked to individual and household characteristics.
It collects contextual information on household circumstances, such as income, savings and investments, tenure and food security or food bank usage.
Individual characteristics are also collected, such as employment status, work history, education level and disability (type of impairment); together with information on childcare costs, child maintenance payments and whether respondents are carers or not.
It is considered the best survey source for looking at benefit receipt (state support), including receipt of Universal Credit, Pension Credit, Housing Benefit, Child Benefit, State Pension, and past benefits which are no longer in payment.
It is specifically designed to look at benefit receipt for families (and households) rather than an individual, alongside many personal and family characteristics, which are not available from administrative sources, thereby following the real-world design of the benefit system.
Limitations
Does not include residential institutions, therefore individuals in nursing or retirement homes, university halls of residence, prisons or detention centres or rough sleepers will not be included.
Typically, a 12-month lag from the reference period to the publication.
Known under-reporting of benefit receipt.
Known under-reporting at the top and bottom of the income distribution.
Not suitable for analysis below the regional level or by small sub-groups (for example by ethnicity) without combining survey years and/or it will be subject to wider confidence intervals.
Uses
It is the basis for DWP's Policy Simulation Model, which is used extensively by analysts for policy evaluation and costing of policy options.
It is used by other government departments including HM Revenue and Customs and HM Treasury; other users include the Ministry of Justice, the Department for Education, the Department for Environment, Food and Rural Affairs and devolved governments.
Below Average Resources
Below Average Resources (BAR) statistics are published by the Department for Work and Pensions (DWP) on GOV.UK.
They are designated as an official statistic in development.
For more information, contact DWP at team.povertystats@dwp.gov.uk
Source data
BAR uses data from the Family Resources Survey (FRS) and Households below average income (HBAI). Please see the FRS and HBAI sections for further information.
Output data and availability
Results are available for the UK from financial years ending (FYE) 2001 to 2023.
All tables can be downloaded via the BAR release page.
What the data measure
The BAR statistics are based on the approach proposed by the Social Metrics Commission (SMC). Unlike HBAI, which measures net equivalised disposable household income, BAR uses a broader approach: Total Resources Available (TRA). BAR provides a more expansive view of available resources (both savings and inescapable costs) than the income measurement adopted under HBAI, and also includes some methodological changes proposed by the SMC.
Once fully developed, the BAR measure will add value alongside existing DWP poverty measures, like HBAI, the UK's primary source of poverty estimates.
TRA are resources currently available to families to meet immediate needs, they are calculated on a weekly basis. TRA are calculated as net income, plus other resources available (such as weekly measure of liquid assets), minus inescapable family-specific costs (such as childcare, disability, recurring housing costs), minus debt (such as obligated weekly debt repayments). The calculation of the net income component is on the same basis as for HBAI on an after housing costs (AHC) basis.
TRA is calculated at the "sharing unit" level, which is based on individuals within a household who are related, rather than at household level as for HBAI.
Poverty trend statistics are provided against several important groups including age, disability, ethnicity, benefit unit type, tenure type, economic status and country.
Strengths
The data underlying these statistics are taken from existing sources and the strengths and limitations of these underlying data sources should be considered when interpreting these statistics; further details can be found in the Background and Methodology Note.
The BAR approach to poverty measurement is more expansive than that presented in the HBAI publication as it accounts for a greater range of income sources and inescapable costs.
The BAR poverty measure has a stronger correlation with other, non-income-based measures of poverty such as material deprivation and household food insecurity than does the relative AHC HBAI poverty measure.
Limitations
The measure is still under development and so the approach proposed by the SMC has not been fully realised; for example, data on family debt are not yet available and the poverty persistence and lived experience indicators have not been included in the present publication.
The reporting to date does not include measures of uncertainty or analyses examining statistical significance; the HBAI publication does report measures of uncertainty using confidence intervals calculated using bootstrapping methodology.
Uses
While still under development these statistics should be viewed as subject to further testing and change.
However, once fully developed, the BAR measure will sit alongside and add value to DWP's existing poverty related statistics; each measure in BAR will allow different insights and collectively the measures further enhance the overall understanding of poverty.
Pensioners' incomes
The Pensioners' incomes report is published annually by the Department for Work and Pensions (DWP) on GOV.UK.
It is designated as an accredited official statistic.
For more information, please contact DWP at pensioners-incomes@dwp.gov.uk.
Source data
The estimates are based on a subset of cases from the Family Resources Survey (FRS) where one member is over the State Pension age (see the FRS section for further information on the survey).
Output data and availability
Pensioners' incomes are available from financial year ending (FYE) 1995.
Users can access the data and create bespoke tabulations using Stat-Xplore. Pensioners' incomes microdata can be accessed using a standard End User Licence on the UK Data Service website.
What the data measures
Pensioners' incomes contain estimates of the levels, sources and distribution of pensioners' incomes. It also examines the position of pensioners within the income distribution of the population as a whole. The series includes information about gross and net income, both before and after housing costs.
The annual pensioners' incomes publication covers:
income for different groups of pensioners by age, for singles and couples, and broken down by region
a detailed look at various sources of income, including the proportion of pensioners who receive income from these different sources
the distribution of pensioners' incomes, both within the pensioner population and within the household population overall
additional analysis, including couples where one member is above State Pension age and the other below, married and cohabiting couples and results for ethnic groups
Please see the DWP Statistical Work Programme for future developments and releases.
Strengths
Long time series of data back to FYE 1995.
Measures the income of pensioner units and their dependent children only, disregarding income from other household members.
Breadth of variables allows for detailed analysis of different breakdowns.
The data are presented unequivalised, as single pensioners and pensioner couples are compared separately in most results; this allows us to break down pensioners' incomes by different sources in monetary terms.
Limitations
Does not include residential institutions, of particular relevance for pensioners' incomes, the exclusion of individuals in nursing or retirement homes.
Typically, a 12-month lag from the reference period to the publication.
Known under-reporting of benefit receipt.
Known under-reporting at the top and bottom of the income distribution (although an adjustment is applied to the top of the income distribution).
Some analysis of pensioners' incomes looking at small subgroups may need to pool years of data to produce large enough samples from which to draw robust results; some analysis in the main pensioners' incomes publication uses three years' worth of data to achieve this (for example, analysis by region, ethnicity, some quintile analysis).
Uses
The statistics are used by government departments, local authorities, academics, journalists and the voluntary sector to gain a deeper understanding of pensioners' incomes.
The statistics are used for government decision making about policies, and associated decisions about related programmes and projects.
Wealth and Assets Survey
Household total wealth statistics in Great Britain are published biennially by the Office for National Statistics (ONS).
They are designated as an accredited official statistic.
For more information, please contact the ONS at wealth.and.assets.survey@ons.gov.uk or on +44 1633 45 6295.
Source data
The Wealth and Assets Survey (WAS) commenced in 2006 with the aim of measuring the economic situation of households and individuals in Great Britain. It is a biennial, longitudinal survey conducted by the ONS and funded by a consortium of government departments.
For the period April 2020 to March 2022 - the eighth round of WAS - the achieved sample was around 15,100 households.
The design of the survey recognises the fact that wealth is highly skewed, with a small proportion of households owning a large share of the wealth. The efficiency of the sample is therefore improved by over-sampling addresses likely to be in the wealthiest 10% of households. Their addresses were identified using data from HM Revenue and Customs (HMRC).
Output data and availability
Biennial data are available from 2006.
Datasets are available for six outputs:
The microdata are accessible via an End User Licence (EUL) sent to the UK Data Archive (UKDA) and a less anonymised version via the Secure Research Service, which provides onsite access to the ONS data.
What the data measure
WAS data are fundamental to understanding the distribution of assets, debts, and liabilities in Great Britain. It collects information concerning all forms of personal assets held by individuals within private households, including their financial wealth, property wealth, physical wealth and private pension wealth.
Studies investigating a household's economic resources have often focused primarily on income. Such estimates of income are frequently used as a main indicator on which governments are held to account, and by which countries are compared. Nevertheless, income provides just one estimate of material well-being.
While the primary focus of WAS is the estimation of household and individual wealth, data on a household's total income have been available since 2010. Prior to 2010, earnings data (not income data) were collected on the survey.
To date, only limited income estimates have been published from WAS - concentrating on the relationship between household wealth and income.
Strengths
Wealth statistics allow consideration of factors other than income when considering an individual's or a household's economic well-being; this is of growing importance in many areas of government policy that are focusing on wealth rather than income or are concerned with saving for retirement.
The longitudinal design of the survey means that general life cycle effects and the impact of specific life events (for example, retirement) can be analysed.
Deflated using the Consumer Prices Index including owner occupiers' housing costs (CPIH) to reflect the change in the value of money overtime.
Limitations
Does not include residential institutions, therefore individuals in nursing or retirement homes, university halls of residence, prisons or detention centres or rough sleepers will not be included.
Typically, a 22-month lag from the reference period to the publication.
Self-valuation tends to yield higher estimates of worth than most other property indicators may suggest.
WAS is specifically designed to estimate household and individual wealth; the income measures available are designed to be classificatory variable (for example, to divide the population into income groups) rather than a continuous variable, and analysed alongside wealth measures.
Uses
- Used by the Department for Work and Pensions (DWP), HMRC, the ONS and other government departments as well as academics to provide a greater understanding of the levels and distribution of wealth in terms of pensions, property, financial and physical assets, and indebtedness.
Children in low income families
Children in low income families (CiLIF) is published by the Department for Work and Pensions (DWP) on GOV.UK.
It is designated as an accredited official statistic
For more information on CiLIF, please contact DWP at stats.consultation-2018@dwp.gov.uk
Source data
Statistics are derived from the administrative database "RAPID" (Registration and Population Interaction Database), which provides a single coherent view of citizens' interactions with DWP and HM Revenue and Customs (HMRC) within a tax year and across the UK.
Figures are calibrated to Households below average income (HBAI) estimates but provide more granular local area information not available from the HBAI, for example, by local authority, Parliamentary constituency and ward.
Output data and availability
CiLIF statistics are available from financial year ending (FYE) 2015.
More detailed breakdowns can be found via the DWP's online tabulation tool Stat-Xplore. The statistics released on Stat-Xplore can be broken down by age and gender of child, family type, work status, and a range of geographies.
What the data measure
CiLIF statistics provide information on the number and proportion of children living in relative and absolute low income before housing costs by local area across the UK.
For both relative and absolute measures, before housing costs, these annual statistics include counts of children by:
geography (including local authority, Westminster Parliamentary constituency, ward, Middle-layer Super Output Area (MSOA))
age of child
gender of child
family type
work status of the family
Consistent with DWP's approach to building local area statistics, census output area (COA) is used as the building block to derive standard geographies including:
Lower-layer Super Output Area (LSOA)
Middle-layer Super Output Area (MSOA)
ward
(higher tier) local authority
Parliamentary constituency
These statistics complement and should be viewed as a companion release to the HBAI statistics on children in low income households, which provide national and regional estimates.
Please see the DWP Statistical Work Programme for future developments and releases.
Strengths
Calibrated to (and therefore match) single year HBAI UK estimates of children in low-income families.
Provide local area insights for low level geographies.
While the HBAI estimates are built from a survey of households, these administrative statistics cover the family unit.
Limitations
The statistics are a measure of children and cannot be used to obtain the number of low-income families.
A family must have claimed Child Benefit and at least one other household benefit (Universal Credit, tax credits or Housing Benefit) at any point in the year to be classed as low income in these statistics.
Income is before housing costs and equivalised to adjust for family size and composition. It is defined as gross personal income from employment, self-employment, occupational pensions and benefits or tax credits; this is not the same as the HBAI income measures, but for the purposes of looking at the distribution of family income across local areas it offers a consistent approach that captures the main income streams.
Relationships are built from analyses of household benefits such as information on sole or joint claimants of Universal Credit, tax credits and Housing Benefits, which is used to determine claimant and partner information; when combined with Child Benefit claimant data, this view provides a measure of the family unit.
The statistics are not directly comparable with the predecessor of these statistics produced by HM Revenue and Customs (HMRC).
Uses
To meet the demand from users for local estimates of the number and proportion of children living in low-income families to enable strategic decision making and allocation of services at local levels.
To compare and contrast changes in the number and proportion of children in low-income families over time, and within and across local areas.
8. Labour costs
Labour costs typically refer to the gross earnings paid by a business (wage costs), plus several non-wage related costs such as employer National Insurance contributions, employer pension contributions and benefits in kind provided by the employer.
Average labour compensation per hour
Average labour compensation per hour (ALCH) is published quarterly by the Office for National Statistics (ONS) in the labour costs and labour share dataset with an annual commentary.
It is designated as an official statistic in development.
For more information, please contact the ONS at productivity@ons.gov.uk or call +44 1633 582563.
Source data
The component series used to derive ALCH (employment costs and productivity hours) are compiled using information from a multitude of different sources, including household and business surveys, as well as administrative records.
Output data and availability
ALCH for the whole economy is available from 1971, with industry sections available from 1997. The industry sections are from the Standard Industrial Classification (SIC) 2007.
From 1997 ALCH is also published as an aggregate for the production industries and service industries.
ALCH estimates are published as both an index series and British pound (GBP) per hour.
What it measures and breakdowns available
ALCH measures the average employment costs of an hour of labour in the UK economy. It is calculated as total employment costs, defined as compensation of employees plus part of mixed income, divided by productivity hours.
The mixed income component of employment costs seeks to measure the share of mixed income that consists of returns to labour rather than capital. This is calculated as mixed income multiplied by the share of compensation of employees within compensation of employees plus gross operating surplus. This share is known as the labour share. Self-employment income other than mixed income is allocated a labour share of zero, in accordance with national accounts definitions.
ALCH replaced the Index of Labour Costs per Hour (ILCH), which was published for the last time in December 2020. Conceptually, they are very similar except ALCH covers some self-employed people through the inclusion of part of mixed income, while ILCH covered the employed only. In practice, they are also different because of the different data sources used.
Strengths
Uses data consistent with the national accounts and unit labour costs (ULCs) (for total employment costs in the numerator) and labour productivity (productivity hours in the denominator); this means that ALCH is the product of ULCs and labour productivity, which allows users to decompose changes in any of the three variables into changes in the other two, this is useful for some analytical purposes.
Consistency with the national accounts means that, unlike labour costs or earnings measures that directly use survey data, it incorporates balancing and other adjustments to the components of total employment costs made as part of the Supply and Use compilation process.
Limitations
As the output is not directly based on survey data there is no information available to break the data down by specific characteristics (for example, employee age).
Uses gross operating surplus estimates to calculate the labour share; gross operating surplus estimates for industry sections are available only annually, and only for the Supply and Use period (a lag of around two years), therefore, the quarterly gross operating surplus estimates by industry section, extended past the Supply and Use period, used to calculate ALCH must be allocated to quarters and nowcast using time series models.
The share of mixed income (and other self-employment income) applied to total employment costs is modelled as there is no way of measuring the true share.
Uses
- ALCH can be used to assess levels or changes in the nominal compensation of labour per hour worked.
Unit labour costs and unit wage costs
Unit labour costs (ULCs) and unit wage costs (UWCs) are published quarterly by the Office for National Statistics (ONS) in the labour costs and labour share dataset with an annual commentary.
Whole economy ULC is designated as an accredited official statistic, while ULCs for specific industries are designated as official statistics in development.
UWCs for the whole economy and manufacturing industry are designated as accredited official statistics.
For more information about ULCs and UWCs, please contact the ONS at productivity@ons.gov.uk or on +44 1633 455086.
Source data
The component series used to derive ULCs (total employment and real gross value added (GVA)) are compiled using information from a multitude of different sources, including household and business surveys, as well as administrative records.
Output data and availability
Whole economy ULC estimates are available from 1955 onwards and ULCs for specific industries are available from 1997 and onwards. The industry sections are from the Standard Industrial Classification (SIC) 2007.
UWCs for the whole economy are available from 1955 onwards. UWCs for manufacturing are available from 1982 onwards.
A new measure of the labour share of income is also calculated as part of the ULC suite of statistics.
What the data measure
ULCs measure the cost of labour input per unit of real (inflation-adjusted) economic output. This is calculated by dividing total employment costs by output. Total employment costs are calculated in the same way as they are for average labour compensation per hour (ALCH) (see the ALCH section). Output is defined as real GVA.
UWCs are identical to ULCs except that they do not cover non-wage employment costs such as employers' social security contributions.
Strengths
Provide an indication of labour-related inflationary pressures in the economy.
ULCs use the same data sources as both national accounts and ALCH; this means that ULCs are ALCH divided by labour productivity, which allows users to decompose changes in any of the three variables into changes in the other two, and is useful for some analytical purposes.
Consistency with the national accounts means that, unlike labour costs or earnings measures that directly use survey data, they incorporate balancing and other adjustments to the components of total employment costs made as part of the Supply and Use compilation process; therefore, the total employment cost estimates for the Supply and Use period have been compared with other information about the economy and adjusted based on that information.
Limitations
As the output is not directly based on survey data there is no information available to break the data down by specific characteristics (for example, employee age).
ULCs' measures deal exclusively with the cost of labour, which, though important, should also be considered in relation to changes in the cost of capital; this consideration is more relevant in capital-intensive economies.
ULCs use gross operating surplus estimates to calculate the labour share; gross operating surplus estimates for industry sections are available only annually, and only for the Supply and Use period, so the quarterly gross operating surplus estimates by industry section, extended past the Supply and Use period, used to calculate ULCs must be allocated to quarters and nowcast using time series models.
The share of mixed income (and other self-employment income) applied to total employment costs must be modelled, as there is no way of measuring the true share; this limitation does not apply to UWCs, as they do not include self-employment income.
Uses
- ULCs are used by the Bank of England and others when analysing the extent of spare capacity in the labour market.
10. Cite this methodology
Office for National Statistics (ONS), updated 30 May 2025, ONS website, methodology, Income and earnings statistics guide