Table of contents
- Preface
- Introduction
- Construction of UK consumer price indices
- Measurement of owner occupiers’ housing costs
- Sampling procedures
- Collection of prices
- Validation procedures
- Weights
- Special issues, principles and procedures
- Introducing new data sources
- Publication and usage
- Retail Prices Index
- Alternative inflation measures
- Glossary: Terms and concepts
- Appendix 1: Historical background to the development of consumer price indices in the UK
- Appendix 2: Abridged characteristics of the different measures of consumer price inflation
1. Preface
Some aspects of this technical manual are out of date. From 25 March 2026, the Consumer Prices Indices Technical Manual has been replaced by our Consumer prices indices technical guidance.
This is the 2019 version of the Consumer Price Indices Technical Manual (with minor updates in 2023, 2024 and 2025, adding Section 10: Introducing new data sources). The Technical Manual is a reference tool that explains how measures of consumer price inflation and associated indices are compiled. This includes consumer price indices, such as the Consumer Prices Index including owner occupiers' housing costs (CPIH), the Consumer Prices Index (CPI) and the Retail Prices Index (RPI). It covers the concepts underpinning the indices, statistical methodology used, collection and validation of prices, calculation of weights, and publication and usage of the indices.
Consumer price indices are often used in contracts to index link or uprate payments to allow for inflation. The Technical Manual will help people drafting contracts to incorporate the major points that are necessary when using consumer price indices in this way. However, users of this manual are advised to form their own independent assessment in relation to consumer price indices and their uses in specific cases and to seek such specific advice as they consider appropriate. We accept no liability whatsoever for losses of any kind arising as a result of reliance on this manual.
The CPIH, CPI and associated indices are National Statistics. These statistics are produced to high professional standards set out in the UK Statistics Authority's 2018 Code of Practice for Statistics. The Technical Manual explains how these standards are met.
The RPI was assessed against the Code of Practice for Official Statistics in early 2013 and the UK Statistics Authority cancelled its designation as a National Statistic because:
the methods used to produce the RPI are not consistent with internationally recognised best practices
the decision to freeze the methods used to produce the RPI and only to contemplate "routine" changes was inconsistent with the requirement in the Code to seek to achieve continuous improvement
The RPI is therefore a legacy measure and only continues to be produced for use in existing long-term contracts.
We welcome feedback and would be happy to receive comments on this Technical Manual at cpi@ons.gov.uk.
Back to table of contents2. Introduction
2.1 Overview
This manual describes the procedures we use to produce measures of consumer price inflation and associated price statistics. This includes the Consumer Prices Index including owner occupiers’ housing costs (CPIH), the Consumer Prices Index (CPI) and the Retail Prices Index (RPI).
The CPIH is our most comprehensive measure of consumer price inflation and is the lead measure in our Consumer Price Inflation, UK bulletin. It was launched in early 2013 as a measure of UK consumer price inflation that includes owner occupiers’ housing costs (OOH). These are the costs of housing services associated with owning, maintaining and living in one’s own home and, as such, are an important component of household expenditure. For more information, see Section 4: Measurement of owner occupiers' housing costs.
The CPI is identical to CPIH but excludes OOH and council tax. It is a measure of consumer price inflation produced to international standards and in line with European regulations. First published in 1997 as the Harmonised Index of Consumer Prices (HICP), the CPI is the inflation measure that is currently used as the government’s target for inflation. Since October 2011, the CPI has been used for deflating consumer spending within the national accounts. The CPI is also used for purposes such as uprating pensions, wages and benefits, and it can aid in the understanding of the impact of inflation on family budgets.
The RPI is the longest-standing measure of inflation in the UK, but it is no longer designated as a National Statistic. In accordance with the Statistics and Registration Service Act 2007, the RPI and its derivatives were assessed against the Code of Practice for Official Statistics in early 2013 and found not to meet the required standard for designation as National Statistics. More recently, its use has been strongly discouraged by the then National Statistician John Pullinger in an article outlining the measure’s shortcomings. RPI inflation is currently used to uprate indexed-linked gilts and for the revalorisation of excise duties. Historically, the RPI had been used as the basis for the government’s inflation target and deflation in the national accounts and to index various prices and incomes including tax allowances, state benefits and pensions.
The uses of consumer price inflation statistics by individuals, government, businesses and academics are described more fully in Section 2.4: Uses of consumer price inflation measures and in Users and uses of consumer price inflation statistics.
The manual is aimed at users who want to know the concepts and statistical methods underlying the different indices and how the data are collected. While it does not attempt to go into every detail, which would require a volume many times the size of this one, it will answer most of the questions that we are usually asked about consumer price indices’ methodology and practice.
This manual also includes information on developments as a result of the programme of transformation across our consumer price statistics. This includes identifying alternative data sources (such as scanner and administrative data sources), improving methods, and developing systems. As a result, we will be able to produce more robust, timely and granular inflation statistics. An overview of the changes can be seen in Section 10: Introducing new data sources.
This manual is generally written in terms of the CPIH and CPI as these are the two measures that are National Statistics. However, the methods and procedures described in Sections 3 to 8 are also, in the main, applicable to the RPI; where methods differ, they are made clear in Section 12: Retail Prices Index.
2.2 A brief description of consumer price statistics
Everything that consumers buy has a price; the price may vary over time. Consumer price statistics are designed to measure such changes. A convenient way to understand the nature of these statistics is to envisage a very large shopping basket comprising all the different kinds of goods and services bought by a typical household. As the prices of individual items in this basket vary, the total cost of the basket will also vary – consumer price statistics measure the change from month to month in this total cost.
No two households spend their money in the same way. Each household’s or person’s experience of inflation will be different. UK consumer price statistics are measures of average inflation, based on household expenditure on the items in the shopping basket.
2.3 Historical background and estimates
The Consumer Prices Index including owner occupiers’ housing costs (CPIH) was launched in early 2013 with a back series available from 2005 and is a National Statistic. In December 2018, we produced estimates for CPIH back as far as 1988. We have badged this series as an official statistic (rather than a National Statistic1) reflecting the greater uncertainty around historical estimates and, as such, these data should be treated with some caution.
The Consumer Prices Index (CPI) was launched in January 1996. Estimates, which are broadly consistent with the data from 1996, are also available back to 1988. With the publication of the CPIH historical series, estimates for the CPI have now also been provided at a more detailed level. Indicative figures for the period 1975 to 1987 are also available for the CPI. Again, the historical CPI data should be treated with some caution. Harmonised index of consumer prices: historical estimates (PDF, 106KB) provides more details. More recently, we have produced a modelled historical series for the CPI covering the period 1950 to 2011. Again, these are indicative, modelled figures that should be treated with some caution. Modelling a Back Series for the Consumer Price Index (PDF, 412KB) provides more details. The CPI was published as the Harmonised Index of Consumer Prices (HICP) until December 2003; its name was changed in December 2003 to reflect its new role as the basis for the government’s inflation target that the Bank of England’s Monetary Policy Committee is required to achieve.
The Retail Prices Index (RPI) dates from 1947. The historical background to the development of the index can be found in Appendix 1. The book ‘Inflation: History and Measurement’ (Palgrave Macmillan, 2017) by O’Neill et al. goes into more detail on the history of the various consumer price measures.
2.4 Uses of consumer price inflation measures
Consumer price statistics are used in many ways by individuals, government, businesses and academics. As explained later in this manual, the uses to which the different indices are put have historically helped shape their development. Their uses are summarised in the following sections. A more comprehensive description of the uses is provided in Users and uses of consumer price inflation statistics.
2.4.1 A measure of inflation
2.4.1.1 Domestic
There is no single definition of the word “inflation”. However, most consumers might think of inflation as a fall in the value of money reflecting a continuous increase in the price of the goods and services that they purchase. Prices may also fall, of course, although a sustained fall in prices is unusual. Although a sustained fall in prices is unusual, the indices often fall between consecutive months owing to seasonal effects and random fluctuations.
The amount of money needed to purchase a fixed basket is also known as the internal purchasing power of the currency, which can be expressed in two ways. Firstly, it is the amount of money needed in period y to purchase the same basket of goods and services that one unit of currency could purchase in an earlier period x. Conversely, it is the amount of money needed in an earlier period x that could buy the same basket of goods and services that one unit of currency purchases in period y.
UK governments base their economic policies around targeting a specific rate of inflation, so that a comparison of the outcome for inflation against the target provides a means of measuring the success of the relevant economic policies. In May 1997, the Chancellor of the Exchequer announced that operational responsibility for setting interest rates would pass to the Bank of England. However, the government retains responsibility for setting the objectives of economic policy, including the inflation target. In December 2003, the target measure became the Consumer Prices Index (CPI). The main characteristics of the current inflation target are:
an inflation target for the CPI of 2%
if inflation is more than one percentage point higher or lower than the target, the Governor of the Bank of England is required to publish an open letter explaining why inflation has deviated from the target and what actions the Bank intends to take to get it back to target
provision for the target to be reviewed in each Budget
From May 1997 to December 2003, the target was expressed in terms of the Retail Prices Index excluding mortgage interest payments (RPIX). During the period up to December 2003, the inflation target for RPIX was 2.5%.
2.4.1.2 International
The UK’s harmonised index of consumer prices (HICP) is the same as the Consumer Prices Index (CPI). HICPs were developed in the EU for assessing whether prospective members of the European Monetary Union would pass the inflation convergence criterion and has subsequently acted as the measure of inflation used by the European Central Bank to assess price stability in the euro area. One of the main requirements, therefore, was for a measure that could be used to make reliable ‘like-for-like’ comparisons of inflation rates across EU member states. Such comparisons are not generally possible using national consumer price indices due to differences in index coverage and construction.
The rules underlying the construction of HICP indices for EU member states are specified in a European regulation (legal document). This was developed by Eurostat in conjunction with the National Statistical Institutes of member states of the EU and was effective from 11 May 2016. It replaced an earlier regulation that was established in October 1995, reflecting the need for the legal framework to adapt to current requirements and technical progress.
Eurostat describe the HICP as a “Laspeyres-type ‘consumer inflation’ or ‘pure price’ index measuring average price change on the basis of the changed expenditure of maintaining the consumption pattern of households and the composition of the consumer population in the base or reference period.” (Report from the Commission to the Council on harmonization of consumer price indices in the European Union, COM(2000)742). “Pure” means that, strictly speaking, only changes to prices between the current and the base or reference period are reflected in the index. The CPI therefore measures inflation with reference to the changing cost of a fixed basket of goods and services. The HICP is not a cost of living index. That is, it is not a measure of the change in the minimum cost for achieving the same ‘standard of living’ (as in, constant utility) from two different consumption patterns realised in the two periods compared and where factors other than pure price changes may enter the index.
2.4.2 Deflation of expenditure
For many purposes, comparisons over time are more useful when the effect of price changes is eliminated. For instance, estimates are made of Gross Domestic Product (GDP) and its main components in each period, revalued at the average prices in a selected year. Current levels of household final consumption expenditure (HHFCE) and other economic series in the national accounts are adjusted to produce constant price series. This is typically done by deflating (dividing) estimates of expenditure at current prices by appropriate price indices. The Consumer Prices Index (CPI) and its components have been used for deflation purposes in the national accounts since October 2011, consistent with international best practice. The CPI replaced the Retail Prices Index (RPI) and its components. For more information, see Deflation improvements in the UK National Accounts (PDF, 176KB).
Consumer price inflation indices are used to remove the effect of price changes by a wide range of other government departments, both to inform economic policies and to monitor the implementation of those policies. Other users, for example in business, academia and the general public, are also interested in removing the effect of price changes in economic time series, so they can understand changes in “real” terms. The newness of the Consumer Prices Index including owner occupiers’ housing costs (CPIH) means that users are still evaluating it and its use is still being established. It is being closely monitored by the Bank of England and HM Treasury, and we are aware of some users who have adopted it or are considering its use.
2.4.3 Income adjustment
2.4.3.1 Indexation of tax allowances
Some tax allowances and thresholds are revised annually in line with changes in the Consumer Prices Index (CPI), replacing the use of the Retail Prices Index (RPI) prior to April 2011. For progressive taxes, inflation means that the Exchequer takes a growing share of a person’s income. This is because wages tend to increase over time, resulting in a greater proportion of income moving into a higher tax bracket. This tendency is known as fiscal drag. To offset this partly, the Chancellor frequently raises the tax threshold to take account of changes to the CPI. Unless the Chancellor decides otherwise, an amendment to the Finance Act 1977, known as the Rooker–Wise amendment, made this automatic for income tax allowances and thresholds and certain National Insurance contribution thresholds.
2.4.3.2 Indexation of incomes
Consumer price inflation is an important factor in wage-bargaining and pay-setting deals. Some pay agreements explicitly link pay rises to either the CPI or RPI. It is likely that in the future, negotiations will also include consideration of the rate of growth shown by the Consumer Prices Index including owner occupiers’ housing costs (CPIH).
2.4.3.3 Index-linked gilts and national savings
The redemption values of certain gilt-edged securities and national savings certificates are automatically uprated by an amount dependent on the change in the RPI. A formal consultation on the issuance of CPI-linked gilts was completed in September 2011. A response to the consultation was published on 29 November 2011, concluding that CPI-linked gilts would not be issued in 2012/13, but the case for issuance would be reviewed in the future.
2.4.3.4 Indexation of pensions and benefits
Most benefits were uprated by 1% for three years beginning in April 2013, and from April 2016 to March 2020 most benefits have been frozen. Before this, they were increased in line with the CPI. The following benefits continue to be updated in line with the CPI:
Maternity Allowance
Statutory Sick Pay
Statutory Maternity and Paternity Pay
Statutory Shared Parental Pay
Statutory Adoption Pay
Disability, Carers and Pensioners’ Premiums
Other Disability, Carers and Pensioner Benefits
Support Group Employment and Support Allowance
Before 2011, most state benefits were automatically revised every April in line with the change in the RPI over the 12 months to the previous September.
2.4.4 Price adjustment
Private contracts: Many contracts link payments due, such as rent, to changes in consumer price indices.
Regulation of utilities: Certain regulated privatised utilities have their prices constrained to rise by no more than a rate dependent on a given consumer price inflation index.
Other price regulation: Many pieces of legislation refer to the indices as a way of adjusting prices, and there are several statutory instruments that refer to specific indices.
2.4.5 Price monitoring
Many government departments use consumer price statistics to understand price movements for specific goods or services, or to compare price changes for specific goods or services with general level of price change.
2.5 Overview of the CPIH and CPI
2.5.1 Definition of the CPIH and CPI
The Consumer Prices Index including owner occupiers’ housing costs (CPIH) and Consumer Prices Index (CPI) are consumer inflation or pure price indices defined as an average measure of change in the prices of goods and services bought within the domestic territory for consumption by households in the UK and foreign visitors to the UK.
There are several important points to note in this definition:
average measure: a single figure that combines, or averages, all the price changes covered
change: its purpose is to measure how prices change over time rather than the absolute level of prices at a point in time
goods and services: it does not just measure price changes for necessities such as food, heating and clothing, but a wide variety of things purchased by most households, including leisure goods and services
consumption: the CPIH and CPI do not cover investment spending. For example, in the CPIH, owner occupiers’ housing costs are included but the cost of the house, an investment, is excluded. Likewise, because they are not consumed, savings and direct taxes2 are also excluded
households: it measures price changes affecting private households, but it excludes price changes that affect business or government
in the UK: coverage extends to the whole of the UK (see Section 2.5.3: Geographical)
foreign visitors: the expenditure of foreign visitors to the UK is included in the reference population (see Section 2.5.4: Reference population)
2.5.2 Scope and coverage of the CPIH and CPI
The scope and coverage can be defined as follows:
Scope: All those transactions that one would ideally want to measure.
Coverage: Those transactions within the scope that it is possible to identify and measure in practice. This is determined by the expenditure categories for which weights are compiled (Section 8: Weights).
The scope and coverage of the Consumer Prices Index including owner occupiers’ housing costs (CPIH) and Consumer Prices Index (CPI) are those goods and services that are included in the household final consumption expenditure (HHFCE) component of the national accounts. The coverage of goods and services is consistent with the Harmonised Index of Consumer Prices (HICP) version of the international classification framework – Classification of Individual Consumption According to Purpose (COICOP). In the CPIH, owner occupiers’ housing costs (OOH) are included in the “Housing, water, electricity, gas and other fuels” division in their own class, which is called “Imputed rentals for housing”. Council tax is also included in its own eponymous class, which sits in the Housing division.
The CPI coverage excludes owner occupiers’ housing costs such as mortgage interest payments (MIPs), house depreciation, buildings insurance, ground rent, and other house purchase costs such as conveyancing and estate agents’ fees. These are also not included in the CPIH, which measures owner occupiers’ housing costs in a different way (see Section 4: Measurement of owner occupiers’ housing costs). Prior to 2012, trade unions subscriptions, vehicle excise duty and TV licence fees were also excluded from the CPI, since none of these categories were included in the HHFCE. However, in 2011 it was agreed that these items were within the scope of the CPI and should be included in the CPI from early 2012. Similarly, in March 2017, as a result of the consultation following Paul Johnson’s UK Consumer Price Statistics: A Review, council tax was introduced into the CPIH and the series was revised to include it from the CPIH’s inception in 2005.
2.5.3 Geographical
The geographical coverage of the Consumer Prices Index including owner occupiers’ housing costs (CPIH) and Consumer Prices Index (CPI) is the economic territory of the UK (England, Wales, Scotland and Northern Ireland), but not the offshore islands (the Channel Islands and the Isle of Man), which, strictly speaking, are not in the UK.
2.5.4 Reference population
This comprises all private households, foreign visitors to the UK and residents of communal establishments such as university halls of residence, retirement homes and nursing homes. Expenditure by UK households abroad is excluded.
2.5.5 Expenditure items
Expenditure items are the goods and services bought by the reference population for the purposes of consumption. Thus, expenditure for savings and investment purposes, most direct taxes, national insurance contributions, cash gifts, and gambling are excluded from the scope of the Consumer Prices Index including owner occupiers’ housing costs (CPIH) and Consumer Prices Index (CPI). Expenditure on illegal transactions is included in the scope but excluded from the coverage. However, expenditure at legitimate outlets on goods that may have been subject to illegal avoidance of tax or duty at some point in the supply chain will generally be covered. For instance, some smuggled alcohol and tobacco is thought to be sold through outlets such as bars, off-licences and similar outlets.
The CPIH and CPI measure the price of goods and services paid for by consumers. Typically, no account is taken of services free at the point of consumption, even if consumers have paid for them indirectly through taxes or National Insurance contributions. The exception to this role is council tax, which is included in the CPIH. For some goods and services provided or partly paid for by the government, a charge is made at the point of consumption, such as the supply of prescription medicines and dental treatment under the NHS. These charges are included in the CPIH and CPI but not the full economic cost of goods or services. When deriving the weights, only the costs paid by the consumer at the point of delivery are included.
2.5.6 Transaction prices
The prices used in the calculation of the Consumer Prices Index including owner occupiers’ housing costs (CPIH) and Consumer Prices Index (CPI) should reflect prices typically paid by the reference population for the goods and services within the scope of the CPIH and CPI. Consumption expenditure can be measured in three ways, which it is important to distinguish. These ways are:
acquisition, which means that the total value of all goods and services delivered during a given period is considered, whether or not they were wholly paid for during the period
use, which means that the total value of all goods and services consumed during a given period is considered
payment, which means that the total payments made for goods and services during a given period is considered, whether or not they were delivered
For practical purposes, these three concepts cannot be distinguished in the case of non-durable items bought for cash, and they do not need to be distinguished for many durable items bought for cash. The distinction is, however, important for purchases financed by some form of credit, notably major durable goods, which are acquired at a certain point of time, used over a considerable number of years, and paid for, at least partly, sometime after they were acquired, possibly in a series of instalments.
The difference between the three concepts of consumption is not just a matter of timing. If payment follows acquisition, interest may be charged on top of the equivalent of the cash price. When use extends over many years, the value of this use will reflect the price level of those years, not the price at the date of acquisition.
There is no simple answer as to which definition of consumption should be used. The CPIH and CPI mostly measure the acquisition of goods and services, but there are exceptions where it has been decided that this is not the most appropriate approach, most notably in the measure of owner occupiers’ housing costs used in the CPIH.
2.5.7 Responsibility for the CPI
The rules underlying the construction of the Harmonised Index of Consumer Prices (HICP) (known as the Consumer Prices Index (CPI) in the UK) are specified in a series of European regulations. These have been developed by Eurostat (the Statistical Office of the EU) in conjunction with the National Statistical Institutes of member states of the EU.
Since November 2015, the development of our consumer price statistics has been guided by our two Advisory Panels for Consumer Prices (APCPs) – Technical and Stakeholder. Further information on the APCPs can be found in Section 2.7: Advisory committees. The APCPs were initiated as a result of the findings of the Review of the Governance of Prices Statistics, led by Professor Sir Adrian Smith in 2014. They replaced the former Consumer Prices Advisory Committee, which ran between 2009 and early 2013.
2.6 Overview of the RPI
2.6.1 Definition of the RPI
Like the Consumer Prices Index including owner occupiers’ housing costs (CPIH) and the Consumer Prices Index (CPI), the Retail Prices Index (RPI) measures the average price change based on the changed expenditure of maintaining the consumption pattern of households and the composition of the consumer population in the base or reference period.
2.6.2 Scope and coverage of the RPI
The scope and coverage of the Retail Prices Index (RPI) are those goods and services that are based largely on our Living Costs and Food Survey (LCF). The coverage of goods and services is similar to the Consumer Prices Index including owner occupiers’ housing costs (CPIH) and Consumer Prices Index (CPI), although the RPI includes mortgage interest payments (MIPs), house depreciation, buildings insurance, ground rent, and other house purchase costs such as conveyancing and estate agents’ fees, whereas the CPIH and CPI do not. Like CPIH, the RPI also includes council tax, which is not included in CPI. The RPI excludes university accommodation fees, foreign students’ university tuition fees, and unit trust and stock broker charges.
2.6.3. Geographical
The geographical coverage of the Retail Prices Index (RPI) is the whole of the UK (England, Wales, Scotland and Northern Ireland), but not the offshore islands (the Channel Islands and the Isle of Man), which, strictly speaking, are not in the UK.
2.6.4 Reference population
This comprises all private households (not those living in institutions such as prisons, retirement homes or student accommodation, for example) excluding pensioner households, which derive at least three-quarters of their total income from state pensions and benefits, and high-income households, defined as those households whose total household income lies within the top 4% of all households, as measured by the Living Costs and Food Survey (LCF). Unlike the Consumer Prices Index including owner occupiers’ housing costs (CPIH) and Consumer Prices Index (CPI), the Retail Prices Index (RPI) also excludes foreign visitors’ expenditure in the UK. Households not excluded are called index households.
2.6.5 Expenditure items
Since expenditure items are the goods and services bought by the reference population for the purposes of consumption, expenditure for savings and investment purposes, direct taxes, National Insurance contributions, cash gifts, and gambling are excluded from the scope of the Retail Prices Index (RPI).
House purchases could represent the acquisition of a major capital asset (investment) rather than consumption, so purchase without a mortgage and capital repayments of a mortgage are excluded. Mortgage interest payments (MIPs), however, are included. Major home improvements, such as building an extension, are capital investments and so are excluded, but re-decoration and maintenance are included. Property taxes, currently council tax in GB (rates in Northern Ireland), are also included as they are considered an important part of the cost of using a dwelling.
Like the Consumer Prices Index including owner occupiers’ housing costs (CPIH) and Consumer Prices Index (CPI), no account is taken in the RPI of services free at the point of consumption, even if consumers have paid for them indirectly through taxes or National Insurance contributions. Charges made at the point of consumption, such as the supply of prescription medicines, are included, which is consistent with the CPIH and CPI.
2.6.6 Transaction prices
The prices used in the Retail Prices Index (RPI) should be purchaser prices actually paid by the reference population households to purchase individual goods and services via monetary transactions. These prices should include any taxes less subsidies on the products and exclude interest or services charges added under credit arrangements.
Section 2.5.6: Transaction prices described the three ways in which consumption expenditure can be measured. The distinction between the measures is important for purchases that are financed by some form of credit, notably major durable goods, which are acquired at a certain point of time, used over a considerable number of years, and paid for, at least partly, sometime after they were acquired, possibly in a series of instalments. In the RPI, housing costs paid by owner occupiers are an obvious example of this.
While the RPI mostly measures the acquisition of goods and services, there are several exceptions where it has been decided that this is not the most suitable approach. This particularly applies to owner occupiers’ housing costs, more detail of which is provided in Section 12.5: Treatment of owner occupiers' housing costs.
2.6.7 Responsibility for the RPI
The Statistics and Registration Service Act 2007 established new governance arrangements for the Retail Prices Index (RPI) and requires the UK Statistics Authority to compile and maintain the RPI and publish it every month. In terms of implementing any changes to the RPI, the Bank of England and the Chancellor of the Exchequer also have key roles in this aspect of RPI governance.
Before making any change to the coverage or the basic calculation of the RPI, the UK Statistics Authority must consult the Bank of England as to whether the change constitutes a fundamental change in the index that would be materially detrimental to the interest of the holders of relevant index-linked gilt-edged securities. If the Bank of England considers that the change does constitute a fundamental change in the index that would be materially detrimental, the change cannot be made without the consent of the Chancellor of the Exchequer.
2.7 Advisory committees
Between 1946 and 1999, major changes in methodology and procedures for the Retail Prices Index (RPI) were referred to an RPI Advisory Committee (RPIAC), convened by the Chancellor of the Exchequer whenever there were major issues on which advice was needed. The reports of successive RPIACs have been published, usually as Command Papers.
From 2000 to the establishment of the Statistics and Registration Act 2007, the National Statistician, within the Framework for National Statistics, was responsible for the definitions and methodology of the RPI. The National Statistician also led on advising on methodological questions concerning the RPI. The scope and definition of the index was the responsibility of the Chancellor of the Exchequer.
With the adoption of the Statistics and Registration Act 2007, any methodological changes to the RPI require the approval of the UK Statistics Authority before being referred to the Bank of England. To facilitate this, the Authority established a body in 2009 to advise it on proposals for changes to the RPI. This body was called the Consumer Prices Advisory Committee (CPAC). The Committee had three distinct roles:
to advise the UK Statistics Authority on the implication for the RPI of the improvements to this index recommended by the Office for National Statistics (ONS)
to provide the UK Statistics Authority with advice on RPI methodological issues
to advise the UK Statistics Authority on improvements to the UK Consumer Prices Index (CPI) recommended by the ONS
On 10 January 2013, the CPAC was suspended when the UK Statistics Authority announced its intention to undertake a review of the governance arrangements for consumer price statistics.
The independent Review of the Governance of Prices Statistics in February 2014, led by Professor Sir Adrian Smith, recommended the establishment of the Technical and Stakeholder APCPs. This considered matters relating to the governance arrangements and structures underpinning the production of consumer price indices by the ONS.
The Technical Panel functions to provide independent advice to the National Statistician on technical aspects of consumer price indices, as requested by the ONS and/or the Stakeholder Panel. The Stakeholder Panel functions to provide independent advice to the National Statistician on the uses and applications of consumer price indices, to ensure that these statistics meet the needs of users and serve the public good. The terms of reference for each of the panels can be found on the Technical APCP page and the Stakeholder APCP page respectively.
Notes for: Introduction
- See Types of official statistics for more details as to what defines an official or national statistic.
- Council tax, which can be thought of as a direct tax, is included in CPIH as it is an important cost associated with using a dwelling. Many of the services that it provides are consumed by households.
3. Construction of UK consumer price indices
3.1 Overview
This section describes the structure and calculation of UK consumer price indices (Consumer Prices Index including owner occupiers’ housing costs (CPIH) and Consumer Prices Index (CPI)). The components of calculation that are covered are:
elementary aggregate formulae
aggregation
chaining
re-referencing
3.2 Structure of UK consumer price indices
Please note that, from March 2025, we have introduced "consumption segments" into the aggregation structure for our consumer price inflation statistics. The information in this section has not been updated and therefore does not reflect this new aggregation process. We aim to fully update the Consumer Prices Indices Technical Manual to coincide with the introduction of groceries scanner data planned for March 2026, and will update the information on aggregation at that point. In the meantime, information on consumption segments can be found in Impact analysis on transformation of UK consumer price statistics, January 2025.
The coverage and classification of item indices are based on the international classification system for household consumption expenditures known as Classification of Individual Consumption According to Purpose (COICOP). Founded on national accounts principles, the COICOP system, along with the conceptual coverage of household final consumption expenditure (HHFCE), is the starting point for defining which expenditures, in principle, should be included in consumer price indices. This is because COICOP and HHFCE define which transactions constitute household final consumption as opposed to other flows such as taxes, other transfers, or capital and financial transactions. However, consumer price indices currently deviate from COICOP and HHFCE in several areas. For example, the Consumer Prices Index (CPI) does not cover owner occupiers’ housing costs (OOH), and neither the Consumer Prices Index including owner occupiers’ housing costs (CPIH) nor the CPI include financial intermediation services indirectly measured (FISIM) or games of chance.
COICOP is a hierarchical classification system comprising:
divisions (for example: 01 food and non-alcoholic beverages)
groups (for example: 01.1 food)
classes (for example: 01.1.1 bread and cereals)
subclasses (for example: 01.1.1.1 rice)
Subclasses are currently the lowest regularly published COICOP level1, although item-level indices underly the COICOP hierarchy and a majority of these are also published regularly.
Consumer price indices are produced in stages, with indices derived at each stage weighted together to produce higher-level indices. Figure 1 provides an example of this structure. A sample of prices is collected in line with the COICOP classification system, from a selection of items that are representative of UK consumer expenditure; prices are only collected for those items selected. To use tea bags as an example, prices are collected for boxes of 80 tea bags and boxes of 240 tea bags. Other box sizes are not priced as it is assumed that their price movements are similar to those of the tea bags that are priced.
Figure 1: The structure of UK consumer price indices

Download this image Figure 1: The structure of UK consumer price indices
.svg (21.9 kB)
There are currently approximately 700 representative items in the CPIH basket of goods and services. This basket is updated yearly to account for changes in the consumption behaviour of UK consumers. The items usually have relatively broad specifications (such as a roll of wallpaper or women’s jeans) and price collectors must choose a selection of products that conform to that item specification and that are believed to be representative of what consumers are purchasing. If goods come in various pack sizes, usually a size or weight range is given in the item specification.
There are two types of price collection for consumer price indices:
the “local price collection”, which involves price collectors going to shops in various locations across the country to collect prices for items (see Section 5 for how these shops and locations are sampled)
the “central price collection”, which involves price collectors from the head office collecting prices for items where there is a national price, or where most of the expenditure is from online, brochures or similar formats.
For more details on price collection, refer to Section 6 of this manual.
The lowest aggregate of prices, an “elementary aggregate”, covers all prices collected for one item in one stratum. For the local price collection, the UK is divided into regions and several locations are selected in each region. Outlets are selected in each location and are usually classified into two shop types: multiples and independents. Thus, prices for an item may be stratified by region, shop type, both or neither (see Section 5 for more detail). Indices for the strata are aggregated together to produce an overall index for each item.
Item indices are first aggregated into subclass indices, which are then aggregated into class indices. Class indices can be further aggregated to form group, division and aggregate indices:
food, alcoholic beverages and clothing are examples of groups
vegetables, wine and garments are examples of classes
potatoes, wine from grapes and garments for women are examples of subclasses.
Price indices are published monthly for each group, class and subclass. Most item indices are also published monthly.
3.3 Index calculation
The UK consumer price indices, the Consumer Prices Index including owner occupiers’ housing costs (CPIH) and the Consumer Prices Index (CPI) are “fixed-basket" price indices: they measure the change in the price of a basket of fixed composition, in terms of quantity and, as far as is possible, quality. This is often summarised by saying that they use a fixed-basket approach.
The index given here, I0,t at time t with base period 0 is a “Laspeyres-type” or fixed-basket index. This being the price of the basket at a given time as a percentage of its price at the base date, with amount of each item bought at time b:
where:
pit is the price of item i at time t (usually the current period)
pi0 is the price of item i in the base period, period 0
qib is the quantity of item i bought at time b
In principle, the sum should be taken over every possible good or service that is within scope (see Section 2.5.2: Scope and coverage of the CPIH and CPI) and the price measured in every outlet that supplies each good or service. In practice, only a sample of prices can be collected (see Section 5 for more information).
The equation can also be expressed as:
where:
is the weight or expenditure share of item i in period b often called the “weight reference period”.
This is a weighted arithmetic average of price relatives, with the weights being calculated using expenditure shares. A price relative is the ratio of a price at a given time to the price for the same commodity at another time, and an expenditure share is the ratio of the expenditure of an item to the total expenditure.
UK consumer price indices are Lowe-type indices. A Lowe-type index is a fixed-basket index where the quantities are taken from a different period to the prices, usually at a time before the base period. A Lowe index takes weights from period b and price updates them to period 0 (Figure 2), to account for prices changes that occurred between the weight reference period and the base period.
Figure 2: Periods in a price index

Download this image Figure 2: Periods in a price index
.png (6.7 kB)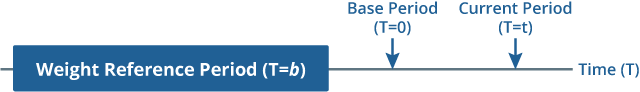
For consumer price indices to use Laspeyres formula, the base period and the weight reference period must coincide (that is, b=0). This cannot be done, for various reasons:
time 0 can be defined in different ways and may refer to a month, a week or even a particular day; however, expenditure data for short periods of time are often too variable to be used in practice
the production of comprehensive expenditure data is time consuming, hence reliable data are rarely available at time 0
if expenditure is seasonal, the pattern at time 0 may be unrepresentative of the average over time; in practice, expenditure data for the most recently available 12 months are used (for more information, see Section 8)
The value of consumer price indices also depends on the weight (wi0;b) and on what items are included in the basket of goods and services. For example, between 2015 and 2016 the weight for bananas decreased by 0.2 percentage points, meaning that the price changes of bananas would have less influence on the all-items index in 2016 than they did in 2015. Also in 2016, lemons were added to the basket so that in 2016, the all-items index included price changes associated with lemons while it did not in 2015.
When the index is said to cover or refer to a given population, it means that the weights have been calculated to reflect the expenditure of that population as a whole. With regard to prices, the basket is not comprehensive, since it does not include every possible item. However, the weights reflect all expenditure by households that is within scope (see Section 8.5: Higher-level weights and Section 8.6: Weights calculation for centrally calculated indices), and items that are included are chosen because they make up a significant proportion of households’ expenditure.
3.4 Elementary aggregates
At the lowest level of aggregation, detailed weights are not available with the current data sources. For example, the expenditure on “pink lady apples” bought in Cardiff from an independent shop is not known. To deal with this lack of weighting information, unweighted index formulae are used. The set of indices created using these index formulae are called “elementary aggregates”. These combine prices into indices, treating all the products as equally important. This gives the prices an equal weight, which is the reciprocal of the number of prices in that stratum.
An elementary aggregate index can be constructed in different ways. The most commonly used unweighted index number formulae are:
the Jevons index, the geometric mean of price relatives
the Dutot index, the ratio of average prices
the Carli index, the arithmetic mean of price relatives
The elementary aggregate formula primarily used in UK consumer price indices is the Jevons index. (See Elliot 20122 for the rationale behind the choice and Winton 20133 for properties of the index with respect to substitution.)
Algebraically, a Jevons index is calculated as follows: if prices p10 to pn0 are obtained in the base period and matching prices p1t to pnt are obtained for the same commodities, 1 to n, in month t, then we have:
This can be thought of as the geometric mean of the price relatives. An alternative, and algebraically equivalent, way of thinking about this calculation is to express it as the ratio of the geometric mean of the average prices:
It is essential to use prices for matching products. If, in any month, there is no price for an item corresponding to one in the base month, that price must be excluded from the calculations or a quality adjustment must be made (see Section 9).
The Dutot index is also used in UK consumer price indices at the elementary aggregate level. The Dutot index can be expressed as follows:
Eurostat regulations permit the use of the Jevons index and the Dutot index but forbid the use of the Carli index on the grounds that it does not produce indices that are comparable with other formulae, such as Dutot or Jevons. The regulations therefore help to ensure that differences in inflation rates between EU countries reflect underlying differences in price changes, and not simply differences in the basic formulae used to aggregate the price data.
Furthermore, it can be shown that in certain circumstances, use of the Carli index, when combined with chain-linking of the within-year indices, introduces an upward bias in the overall price index. This phenomenon is known as “chain drift”. The Jevons formula is not as susceptible to bias due to chain drift (nor is the Dutot formula) and, in the context of cross-country comparisons, is much less influenced by detailed differences in index and sample design in individual countries. (See Clews 20144 for an assessment of chain drift with different formulae.)
Among EU member states, 17 currently use the Jevons index in their national consumer price index (Austria, Bulgaria, Croatia, Cyprus, Denmark, Finland, France, Greece, Ireland, Italy, Luxembourg, Poland, Portugal, Romania, Slovenia, Spain and Sweden); 8 currently use the Dutot index (Belgium, Czech Republic, Estonia, Germany, Latvia, Lithuania, Malta and Slovakia); and 3 currently use a mixture of Jevons and Dutot (Hungary, Netherlands and the United Kingdom). Beyond Europe, Australia, Canada, New Zealand and the USA mainly use Jevons in the calculation of the national consumer price index, while Japan uses Dutot.
With the introduction of new data sources, to use these sources to their full potential, we will be using a weighted multilateral index method, the GEKS-Törnqvist, to calculate elementary aggregates. More detail on the GEKS-Törnqvist can be found in Section 10: Introducing new data sources.
3.5 Aggregation
As discussed in section 3.2, the information in this section has not yet been updated to reflect the introduction of "consumption segments".
Indices for higher-level aggregates are weighted averages of the elementary aggregate indices. If the kth representative item is stratified by region or shop type into strata in set K, the elementary aggregate indices for the strata K in month t are Ii(0,t) and the stratum weights are wi, then the item index for item k for month t is:
Weights are currently updated in two stages every year for both the Consumer Prices Index including owner occupiers’ housing costs (CPIH) and the Consumer Prices Index (CPI): once with the January index to take account of the new annual Classification of Individual Consumption According to Purpose (COICOP) weights, and once in the following month to take account of the changes to the basket of representative items. (Tucker 20175 provides further detail on this method.)
In practice, the item indices are computed with reference to prices collected in January. For the period February to December therefore, compilation of class indices proceeds straightforwardly, as a weighted arithmetic mean of the relevant item indices corresponding to the updated basket introduced in February:
where:
ICt is the index for COICOP class C, for month t (February to December) based on previous January
Ijt is the index for item j in COICOP class C for month t based on previous January
wjt is the weight for item j in COICOP class C for month t
For January, a different calculation is undertaken for the change of the class weights as the January indices have to be rebased to the previous December. This is done as follows:
where:
Ijm is the Index for item j in month m, based on previous January
wjm is the weight for item j in month m
IC(Jan|Dec) is the January index for COICOP class C based on previous December
For each class, the set of item indices used in this calculation will, in most circumstances, match those used in the compilation of the previous December’s index. However, for any classes subject to extensions in coverage in January, it is important that the calculation is based on an extended set of item indices consistent with the change in coverage.
In both cases – indices for January and indices for February through to December – higher-level aggregates (that is, group, division or the all-items index) are calculated as weighted arithmetic means of the relevant class indices, using COICOP weights for the current year.
The weight for January is calculated by price updating the expenditure (V) in the weight reference period to the December of the previous year:
The weight for February to December is calculated by price updating January’s weight using the month-on-month movement between January in the current year and December in the previous year:
This is mathematically equivalent to taking the original expenditure and price updating it to the January in the current year:
3.6 Chaining
The weights for both the Consumer Prices Index including owner occupiers’ housing costs (CPIH) and the Consumer Prices Index (CPI) are updated in two stages every year (as described in Section 3.5: Aggregation). Therefore, the indices must be chain-linked twice every year. This involves calculating an index for January based on the previous December = 100 and, for February to December, calculating a further index based on January of the current year = 100.
Both indices are currently published with a reference period of 2015 = 100. The chain-linked index is calculated as follows:
where:
IC(t,y|2015) is the index for class C in month t in year y with reference period of 2015
IC(Dec,y-1|2015) is the index for class C in the December of the previous year, y-1, with reference period 2015
IC(Jan,y|Dec) is the index for class C in the January of year y
IC(t,y|Jan) is the index for class C in month t in year y, with reference to January of the current year y
3.7 Re-referencing
When the Harmonised Index of Consumer Prices (HICP) was launched, it was referenced on 1996 = 100. Starting with the publication of the January 2006 index, it was referenced on 2005 = 100. The change of reference period was accompanied by a full re-referencing of all HICP indices back to 1996. This resulted in widespread revisions to 1-month and 12-month rates of change. This is because the rates of change with the 1996 reference period are calculated from indices rounded to one decimal place and are therefore subject to rounding errors. This is not the case for the rates of change referenced to 2005 that are calculated from unrounded indices; therefore, there will be no widespread revisions in future re-referencing exercises. The index was then referenced to 2015 starting with the publication of the January 2016 index. This re-referencing will continue to be completed on a 10-year basis for both the Consumer Prices Index including owner occupiers’ housing costs (CPIH) and the Consumer Prices Index (CPI). Re-referencing aids the interpretation of the indices.
Notes for: Construction of UK consumer price indices
Subclasses were introduced into the CPIH and CPI in 2017; before this, the lowest COICOP level published was class level.
Elliott, D., O'Neill, R., Ralph, J. and Sanderson, R. (2012) Stochastic and sampling approaches to the choice of elementary aggregate formula (PDF, 1,110KB), Office for National Statistics
Winton, J., O'Neill, R. and Elliott, D. (2013) Elementary Aggregate Indices and Lower Level Substitution Bias, Office for National Statistics
Clews, G., Dobson-McKittrick, A. and Winton, J. (2014) Comparing class-level chain-drift for different elementary aggregate formulae using locally collected CPI data (PDF, 677KB), Office for National Statistics.
Tucker, J. (2017) Guide to changes to consumer price inflation statistics: March 2017, Office for National Statistics.
4. Measurement of owner occupiers’ housing costs
4.1 Introduction
This section focuses on the construction of the owner occupiers’ housing costs (OOH) element of the Consumer Prices Index including owner occupiers’ housing costs (CPIH). OOH do not seek to capture increases in house prices. Although this may be inconsistent with some users’ expectations of OOH, the inclusion of an asset price and therefore capital gains makes the measure less suitable for a measure of consumption. For more information on CPIH, please refer to Section 2.
OOH developed faster in the UK than by Eurostat, owing to strong user demand. With guidance from the Consumer Prices Advisory Committee (CPAC), we developed two approaches to measuring OOH: the rental equivalence approach and the net acquisitions approach. The Board of the UK Statistics Authority accepted the National Statistician’s recommendation to use the rental equivalence approach to measure OOH in September 2012, following a report from the CPAC and a public consultation.
The CPIH is constructed using the standard international Classification of Individual Consumption According to Purpose (COICOP) classification system, and OOH are included in the “housing, water, electricity, gas and other fuels” division in its own class, which is called “imputed rentals for housing”.
4.2 OOH and CPIH methods
The underlying concept for a rental equivalence price index is that a dwelling is a capital good and therefore not consumed. Instead, it provides a flow of services that are consumed in each period. Such services include shelter and the security of tenure. The value of the flow of services that owner occupiers receive is assumed equal to the rent that the dwelling might attract in the rental market. Therefore, rental equivalence imputes owner occupiers’ housing costs (OOH) from the rents paid for equivalent rented properties. In other words, it is measuring the price owner occupiers would need to pay to rent their own home.
For more detailed information on our rationale behind the choice of rental equivalence and how the measure is constructed in practice, please see the CPIH Compendium. The remainder of this section summarises its construction.
4.2.1 OOH data source
The rental equivalence approach uses administrative private housing rental data collected by rental officers in the Valuation Office Agency (VOA) for all the regions of England, as well as data from the Welsh and Scottish Governments and the Northern Ireland Housing Executive (NIHE). These data are collected for the purposes of calculating the Local Housing Allowance (LHA) for Broad Rental Market Areas (BRMA).
The VOA provides prices for over 450,000 properties annually for England. Rent Officers Wales, part of the Housing and Regeneration Division of the Welsh Government, provides around 30,000 prices for Wales. Rent Service Scotland, part of the Communities Analysis Division of Scottish Government, provides up to 40,000 property prices for Scotland. The NIHE provides prices for over 10,000 properties in Northern Ireland.
When the Consumer Prices Index including owner occupiers’ housing costs (CPIH) was launched in 2013, there was not suitable comparable data available for Northern Ireland. We therefore used the existing Consumer Prices Index (CPI) private rental data collected in Northern Ireland. The Northern Ireland administrative data were deemed unsuitable because they were neither frequent nor timely enough for inclusion within a measure of consumer price inflation, and the coverage of the data only included the Belfast Metropolitan area rather than the whole of Northern Ireland.
The Northern Ireland Housing Executive (NIHE), responsible for collecting private rental data, have since undergone a programme of development to improve the timeliness of the data and to extend the coverage to the whole of Northern Ireland. We have now transformed the Northern Ireland rental indices, including NIHE data within the CPIH from March 2025.
From 2005, private rental data from the VOA are available. Private rental data from the Welsh and Scottish Governments are available from January 2009 and September 2010 onwards, respectively. Prior to this, the CPI unfurnished private rental series for Wales and Scotland have been used to calculate OOH. The CPI unfurnished private rental series for Northern Ireland is used in all years.
4.2.2 OOH methodology
Before 2024, our Index of Private Housing Rental Prices (IPHRP) Quality and Methodology Information (QMI) was used to measure the OOH element of CPIH for England, Wales and Scotland, this was continued to be used for Northern Ireland until 2025. To measure OOH, only unfurnished properties are used, and the strata are weighted by the owner-occupier stock. The IPHRP is based on a matched-pairs approach.
From 2024, the Price Index of Private Rents QMI is used to measure the OOH element of CPIH for England, Wales and Scotland, from 2025 PIPR was used to measure the OOH element of CPIH for Northern Ireland. To measure OOH, only unfurnished properties are used, and the strata are weighted by the owner-occupier stock. The Price Index of Private Rents uses a hedonic double imputation approach to measure how rental prices are changing over time.
Back to table of contents5. Sampling procedures
5.1 Introduction
To construct a perfectly accurate consumer price index, we would need to know and record the price of every variety of every good or service available in every retail outlet (both in store and online) available in the UK. This is not feasible in practice. So, it is necessary to sample prices. There are four levels of sampling for local price collection:
locations
outlets within location
items within section
product varieties
As only a sample of prices is recorded, there is inevitably some sampling error in measuring consumer price inflation. This section refers to sampling procedures for the local collection only.
5.2 Sampling of locations
5.2.1 Producing a location boundary
Since 2015, a new methodology termed the “location-allocation” method has been used to identify and define location boundaries around areas of high retail activity, known as hotspots. This forms a sampling frame from which to select locations for field collection. A location boundary sampling frame based on retail data is used to create locations that are representative of both the retail turnover and geographic areas of the UK. Similar to previous methods, location-allocation uses geographic information systems (GIS) software and the following steps:
the UK is split into 500 square metre grids and the latest Inter-Departmental Business Register (IDBR) data (on number of outlets, employees, expenditure and retail turnover) are assigned to each grid
hotspots are then used as the centre of the new location boundaries; these are identified as those areas with high retail turnover
the outlets (on the IDBR) within a certain impedance distance – 3.5 miles across the UK, except for London, which is set to 0.5 miles – of each hotspot are mapped, with each outlet assigned only to its nearest hotspot to avoid any overlaps in coverage
polygons are grown around the outlets for each hotspot, forming outlines of the location boundaries
the boundaries are then adjusted to fit real-world features (such as roads, railways and waterways) using Ordnance Survey map information, maintaining the retail turnover and number of outlets in each location, whilst reducing the space empty of outlets
Further details of the procedures used prior to 2015 can be found in Chapter 4 of the 2014 edition of the Consumer Price Indices Technical Manual.
5.2.2 Location selection
Location selection takes place separately within each region, using probability proportional to size (PPS) systematic sampling with a size measure that is relative to the locations’ retail sector activity. The number of locations selected in each region is determined as the proportion of national expenditure taking place in that region, multiplied by the total number of locations to be visited nationally.
Sampling takes place by first listing all shopping locations within each region. This forms the basic sampling frame, which is then modified in order to ensure that a full shopping basket (all the items in the sample) can be collected in each location.
Locations with too few outlets and where experience suggests that it is not possible to obtain a complete basket of goods are excluded. Locations that are judged not to be large enough to support the collection of a full basket on their own (based on field auditor experiences) are provisionally paired with a nearby excluded location. These locations have the potential to be merged to form a single collection area, from which it will be possible to collect prices for a complete basket of goods.
Interval sampling is performed by generating a random starting point between zero and the interval value. The location whose size variable contains the starting value is selected as the first location. The second random number is generated by adding the interval value to the starting point. This is then used to select the second location, by using the location whose size variable contains the second random number. The process of adding the interval value to the previous random number, and selecting the corresponding location, is repeated until the requisite number of locations has been sampled. This is illustrated in Table 1, with turnover used as the size variable.
| Location name | Number of outlets | Turnover | Cumulative total | Range¹ | Selection | |
|---|---|---|---|---|---|---|
| Location A | 607 | 5,377 | 5,377 | 0 < x ≤ 5,377 | ||
| Location B | 306 | 2,486 | 7,863 | 5,377 < x ≤ 7,863 | ||
| Location C | 264 | 2,265 | 10,128 | 7,863 < x ≤ 10,128 | Selection 1 | |
| Location D | 449 | 4,006 | 14,134 | 10,128 < x ≤ 14,134 | ||
| Location E | 322 | 2,589 | 16,723 | 14,134 < x ≤ 16,723 | ||
| Location F | 319 | 2,097 | 18,820 | 16,723 < x ≤ 18,820 | ||
| Location G | 283 | 2,127 | 20,947 | 18,820 < x ≤ 20,947 | ||
| Location H | 457 | 5,252 | 26,199 | 20,947 < x ≤ 26,199 | ||
| Location I | 539 | 4,945 | 31,144 | 26,199 < x ≤ 31,144 | Selection 2 | |
| Location J | 371 | 4,102 | 35,246 | 31,144 < x ≤ 35,246 | ||
| Location K | 518 | 4,875 | 40,121 | 35,246 < x ≤ 40,121 | ||
| Location L | 928 | 10,923 | 51,044 | 40,121 < x ≤ 51,044 | ||
| Location M | 407 | 3,366 | 54,410 | 51,044 < x ≤ 54,410 | Selection 3 | |
| Location N | 374 | 2,449 | 56,859 | 54,410 < x ≤ 56,859 | ||
| Location O | 539 | 3,625 | 60,484 | 56,859 < x ≤ 60,484 | ||
| Location P | 326 | 3,357 | 63,841 | 60,484 < x ≤ 63,841 | ||
| Number of locations | 3 | |||||
| Total turnover | 63,841 | |||||
| Interval value | 21,280.30 | = Total turnover / no. of locations | ||||
| Random number | 0.39904 | |||||
| Random starting point | 8,491.70 | = Interval value x Random number | ||||
| Random numbers (x) for selection | Derivation | Location to be selected | ||||
| 8,491.70 | = Random starting point | C | ||||
| 29,772.00 | = Random starting point + Interval value | I | ||||
| 51,052.40 | = Random starting point + 2 x Interval value | M | ||||
Download this table Table 1: Illustration of interval sampling
.xls .csv5.2.3 Location rotation and re-enumeration
It is not feasible to select and list all outlets (enumerate) for a fresh set of locations every year. However, maintaining a fixed sample of locations and enumerating only once would reduce the total number of locations ever used for price measurement. More importantly, this would result in enumeration lists that would contain outlets that were no longer operating, omit outlets that had opened since the enumeration and miss regional shifts in consumer expenditure.
The compromise used is to update a sample of around 30 locations each year, either by excluding a location and replacing it with a new one (rotation) or refreshing the list of outlets in the existing location (re-enumeration). Locations are enumerated in the year that they are sampled and then introduced into the collection the following year while the basket is updated. They should remain in the sample for four or five years so that each location is refreshed either through rotation or re-enumeration once in a five-year period cycle.
5.3 Sampling of outlets
Enumeration (listing of every shop) of the selected locations is carried out by price collectors visiting the postcodes in each location and noting details of all retail outlets found, up to a limit of 1,500 outlets per location, to produce a sampling frame. The details noted for each outlet include:
the outlet address
the outlet postcode
the range of items sold
(if a shop) its size and whether it is an independent store (I) or part of a multiple chain (M)
Shops of centrally collected chains (see Section 6.3: Central collection: central item) are excluded from the enumeration. In order to use PPS sampling, the ideal size measure of an outlet would be turnover. But as this is not readily available, the net retail floor space (estimated by the outlet enumerators) is used as a proxy. For department stores and other shops selling a wide variety of goods, the floor space devoted to each commodity group is measured. The appropriate code indicating what each shop sells is assigned to each outlet based on the appropriate classification.
5.3.1 Use of the coding list
The Consumer Prices Index including owner occupiers’ housing costs (CPIH) and Consumer Prices Index (CPI) classification, based on the Classification of Individual Consumption According to Purpose (COICOP) at a three-digit level (see Section 3), drives the link between outlets and items. The link is handled via a master list of shop types, taken from the full coding list, which shows those that are in scope for a given group of items, in that they sell all or most of the group. Using this, outlets are classified by commodity group and, where appropriate, by shop type (multiple or independent). This is not a true stratification: an outlet may be in more than one stratum if it sells items from more than one commodity group.
For each commodity group, the required number of outlets, plus some reserves (used if an outlet closes down), are drawn from the sampling frame. PPS sampling is used where there is known to be a wide range of store sizes and therefore a wide range of turnover, such as for do-it-yourself (DIY) stores which may be superstores or local shops.
Table 2 shows how this works for meat. Items are grouped into commodity groups, so fresh beef and lamb are grouped together, as are all cooked meats. The second column lists the shops where meat is sold. These meat items are sold in butchers, supermarkets and some department stores. The third column shows whether a multiple or independent shop should be selected; for meat, either may be selected. For meat there should be one price collected in each location: one from a butcher and one from either a supermarket or a department store that sells food.
| Commodity group | Shops to select | Type |
|---|---|---|
| Meat 1 Fresh beef and lamb 2 Cooked meats 3 Fresh bacon, pork and chicken | Butcher | M or I |
| Supermarket Department store that sells food | M or I | |
Download this table Table 2: Shop types for meat items
.xls .csvA shop holding a closing down sale is treated as already closed and hence excluded from the sampling frame (and new outlets are sought to replace them within the location). This is because its prices will neither be comparable with previous ones nor available in the future. Shops selling only second-hand goods are also excluded. Some exceptions to this rule exist where large high street chains have closed down and are treated on a case by case basis.
5.4 Sampling of representative items
It would be both impractical and unnecessary to measure price changes of every product bought by every household in compiling consumer price inflation statistics. There are some individual goods and services where expenditure is sufficiently large that they merit inclusion in consumer price indices in their own right; these include owner occupiers’ housing costs (OOH), the television licence fee, car insurance and electricity supply. However, more commonly, it is necessary to select a sample of specific goods and services that give a reliable measure of price movements for a broad range of similar items. For example, price changes for garden spades might be considered representative of price changes for other garden tools.
The selection of these representative items in the measures of consumer price inflation is purposive or judgemental; the significant difficulties involved in defining an adequate sampling frame (that is, a list of all the individual goods and services bought by households) precludes the use of traditional random sampling methods.
A number of factors are taken into account when choosing representative items. Specific brands or varieties conforming to the item description must be easy to find by the price collectors, ensuring that estimates of price changes are based on an adequate number of price quotations throughout the UK. Since the measures of consumer price inflation in the UK are based on the cost of a fixed in-year basket of goods and services, they should also be available for purchase throughout the year (except for certain food and clothing products that are seasonal, and so require a slightly different treatment).
The number of items chosen to represent price changes within each class depends both on the weight of the class and the variability of price changes between the various items that could be chosen to represent it (reflecting, for example, the diversity of products available). Intuitively, it makes sense to select more items in areas where spending is high; this helps to minimise volatility in estimates of price changes for high-weighted classes and therefore in the measures of consumer price inflation overall. However, if price movements for all possible items in a given section are very similar, it is sufficient to collect prices for only a few.
By contrast, if price movements within a class are very different, a much larger selection of representative items will be needed to obtain a reliable estimate of price change for that class. This helps to explain why a relatively large number of items are selected in areas such as food and clothing, whereas price changes for more homogenous product groupings, such as petrol, alcohol and tobacco, are based on fewer items.
In practice, relative expenditures on the different types of goods and services play the most important role in determining the selection of representative items used to compile the measures of consumer price inflation. This mainly reflects the wealth of data available describing household spending patterns. Two major sources of information come from household final consumption expenditure (HHFCE) and the Living Costs and Food Survey (LCF), which also underpin the calculation of the weights (see Section 8). This is supplemented by detailed analyses of trends provided by market research companies, trade journals and press reports. The price collectors and auditors also report developments in the retail environment to us.
Representative items are chosen centrally for the whole of the UK and, in order that the measures of consumer price inflation remain representative of consumer spending patterns over time, the selection of items is reviewed each year. Consistent with the principle of a fixed basket, the sample of items is held fixed within each year, with annual changes effective from the February index. At this point, revised item weights and chain-linking of indices (see Section 3.6: Chaining) are also applied.
New items may be introduced for a variety of reasons. These include:
the development of new products, particularly in high technology sectors such as audiovisual equipment
increasing household expenditure in specific spending areas such as leisure or personal services
the need to improve coverage in areas where consumers already spend a significant proportion of their expenditure
the replacement of existing items for very similar products that have become more popular
Additions to the basket of representative items each year are broadly matched by the number of items removed so that production costs and lags can be contained. There are currently approximately 700 items in the basket. In many cases, the decision to remove items from the basket reflects low or declining levels of household spending. However, where price changes for goods and services are very similar to other items within the same product grouping, items may be removed if they do not provide sufficient extra information to justify their continued inclusion; this does not necessarily imply that the consumer market for such items is small or declining.
The detailed contents of the consumer price inflation baskets, and changes to the sample from year to year, should not be afforded significance beyond their purpose as representative items. Indeed, within each product grouping there is usually a point at which the number, choice of items and the precise weights attached to them become a matter of judgement. At this detailed level, it is unlikely that such choices have any significant impact on the measures of consumer price inflation overall. For example, a selection of specific household appliances has been chosen to represent spending on small electrical goods, including irons, kettles and food processors. However, other representations would clearly be possible and equally valid.
In selecting the sample of items to represent distinct categories of household spending, those items must be well defined so that the product prices are reasonably homogeneous. However, sometimes a relatively wide definition is used to accommodate rapidly changing consumer tastes, for instance clothing, where fashions can change very quickly. If the definitions were too specific in these cases, it would be very difficult for the price collectors to find examples of the products in the shops. The diversity of products and therefore the range of possible price quotations that conform to a particular item’s description have implications for the choice of elementary aggregation method (see Section 3.4: Elementary aggregates).
Examples of typical item descriptions are:
- large loaf, white, unsliced
- home killed beef, braising steak, per kilogram
- spreadable butter, 40% to 70% butter content
- fresh vegetables, onions, per kilogram
- takeaway fish and chips
- Bitter, four cans 3.4% to 7.5% ABV
- Plumber, daytime hourly rate including call out and VAT
- single bed
- electric cooker four rings, grill and oven(s)
- dog kennel fees, boarding, daily charge
- child minder, hourly rate
- men’s suit, ready made
- ultra-low sulphur petrol
- swimming pool admission, standard adult off peak
5.5 Selection of products and varieties (price quotes)
For most goods, the selection of products and varieties within outlets is purposive. In each outlet, collectors choose one variety “representative of what people buy in your area” from all products matching the specification of each item to be priced within that outlet. To facilitate this, they ask the retailer what the most popular brands are and which of those are stocked regularly. As it is vital that the same product is priced each month, collectors must record enough detail of the product, such as make and model, to ensure that it is uniquely identifiable.
The chosen products are reviewed each January to ensure that what is being priced still reflects this criteria. If the product being priced is not available for January, one that is available must be chosen so that there is a valid base price for the forthcoming year. In January, prices are collected for both the old (if possible) and new products (and for old and new items where these change) to permit chain-linking.
5.5.1 Local probability sampling
Between January 2004 and January 2014 local probability sampling (sometimes referred to as remote sampling) was used for individual models within outlets for several goods. Further details of how this method was applied can be found in Section 4.5 of the 2014 edition of the Consumer Price Indices Technical Manual. This method ceased to be used for all items in 2014 due to concerns around the quality of the data used to implement the approach with no suitable alternative source available. Instead, the guidelines for collecting comparable replacements were improved and are updated annually.
5.6 Review of sampling arrangements
In 1996, as part of a programme of quality improvements to consumer price indices, we carried out a re-balancing of the sample design for local price collection. The result of the re-balancing was a 20% reduction in the number of locations offset by collecting more price quotations for commodities with a high variability of price changes and fewer price quotations for commodities with low variability.
This reflected our analyses, which suggested that the commodity dimension is a more important determinant of price changes than geographical location. The re-balancing was done using Neyman’s optimal allocation (a stratified sampling technique) and investigated how best to distribute the locally collected price quotations among the items so as to minimise the variance. It was not considered desirable to make wholesale changes to the existing structure of the index because of the importance of maintaining continuity for users.
The practical implementation of the optimal allocation centred on how best to re-balance the sample without increasing the number of outlets visited, without greatly increasing the number of items collected and within the existing structure. As a result of the re-balancing, the number of locations selected was reduced from 180 to 146 with effect from August 1996, without decreasing the accuracy of the indices. Collection was increased for items that showed high variability in their prices and reduced for items that showed very low variability.
The re-balancing of the sample in 1996 was part of an ongoing process to review the sampling arrangements, which also resulted in the introduction of the new location sampling methodologies in 2000 and 2015. As part of development work on consumer price inflation statistics, we continue to review the optimal location sampling process regularly.
Back to table of contents6. Collection of prices
6.1 Methods of price collection
There are two basic price collection methods: local and central.
Local collection is used for most items; prices are obtained from outlets in 141 locations around the country, with over 100,000 quotations obtained monthly by this method. Normally, price collectors must visit the outlet, but prices for some items may be collected by telephone (see Section 6.2.2: Choice of index day).
Central collection is used for items where we can collect all prices centrally (within the head office) with no field work. These collections can be further sub-divided into two categories:
central shops, where the prices come from retailers with national pricing (as in, the retailers assign the same price for a product in each region) and these prices are combined with prices obtained from the local collection to produce the price index
central items, where we collect the prices centrally and they are used on their own to construct centrally calculated price indices
6.2 Local price collection
6.2.1 General procedure
Price collection is completed by an external collection agency on a contractual basis, operated to European Community open competition tendering procedures. Prices are recorded on hand-held collection devices, which speeds up data processing and transfer and means that prices are validated interactively as they are entered. This also reduces the number of queries that need to be dealt with when the data are processed in the head office (see Section 7).
6.2.2 Choice of index day
The Consumer Prices Index including owner occupiers’ housing costs (CPIH) and Consumer Prices Index (CPI) are intended to reflect prices over at least one working week at or near the middle of each month. Collectors aim to provide month to month consistency by collecting prices on the same day of the week each month. The prices for petrol and oil, which can change regularly throughout the month, are averaged over the month based on the prices prevailing on each Monday. In February 2018, a second collection day was also introduced for fresh fruit and vegetables as the prices for these groceries can also change throughout the month.
The choice of collection days and the number of weeks between them depends on operational considerations, particularly the timing of bank holidays. Collection days will never fall in a week that includes a bank holiday Monday, because some prices will need to be collected on this Monday when outlets may be closed or charge abnormal prices. The collection dates are not published in advance because of the hypothetical risk that service providers or retailers may change their prices in order to influence consumer price inflation statistics.
6.2.3 Telephone enquiries
The prices for certain items, such as electricians’ charges, childminder fees and driving lesson fees, are obtained by telephoning the businesses or organisations concerned. Most items for which prices are obtained by telephone are periodic (see Section 6.2.4: Frequency of collection). Monthly telephone enquiries include oil central heating and theatre admission. In the local collection, certain outlets can be telephoned because it is relatively easy to avoid ambiguities in price where the outlet provides standard items or services. However, even if prices are obtained by telephone, the retailer must be visited occasionally. This helps to maintain personal contact and to ensure that there are no misunderstandings over the prices. This will be more important for some retailers than others. For example, due to the specialist nature of the service provided by opticians, this clarification will be more important than, say, the price of a take-away meal.
6.2.4 Frequency of collection
Local collectors try to collect all prices every month, except for seasonal items when they are not in season and periodic prices, which are only collected every three or four months in each location.
For periodical items, each location is allocated a code – A, B, C and D – at random. Prices are then collected according to the following timetable:
A – January, May and September
B – January, February, June and October
C – January, March, July and November
D – January, April, August and December
In the months when periodic items are not collected in a location, the previous month’s prices are carried forward. Items collected periodically are mainly services in the household and leisure groups, and their prices are known to change relatively infrequently compared to locally collected goods and services.
6.2.5 Methods of payment
The price usually used is that for a cash transaction. This means that charges for paying by instalments or for use of credit cards, and discounts for paying by direct debit, are usually ignored (though not always: some centrally calculated indices, such as electricity charges, measure the price of several different forms of payment) but discounts for paying by cash should be allowed for. Value Added Tax (VAT) and compulsory service charges are included, but delivery charges are not. Delivery charges are collected as a separate item.
6.2.6 Indicator codes
Collectors are required to note if there are any special features in the prices recorded. Certain codes are used:
S – sale or special offer (typically explains a reduction in price)
R – recovery from S (typically explains a price jump); this is not necessarily the same price as before the sale
N – non-comparable product or variety to represent an item (implying that the original product’s or variety’s base price is not suitable for comparison)
C – changed product or variety but not significantly different from old one (C for comparable, implying that the original base price is suitable for comparison)
T – temporarily out of stock
M – item missing from outlet and not likely to be stocked again in the near future
Q – a special note has been made (Q for query) by the collector for head office staff to examine and respond as required
W – weight or size change, for example manufacturer has made a permanent change to the weight of a product; this marker is essentially used for quantity adjustment purposes
X – comparable item introduced that is on sale
Z – non-comparable item introduced that is on sale
If the price entered fails a validation check carried out by the hand-held collection device, collectors must enter a message explaining why. These messages and indicator codes are used in the head office at a later stage of the validation process.
A price should only be recorded if the exact product being priced is on display or in stock at the outlet. For some items, such as furniture, which normally must be ordered, it is acceptable to record the price if the item is available to order.
6.2.7 Unavailable items
If a chosen product is temporarily out of stock, no price is recorded and a T code is used. If it is out of stock for three consecutive months, the collector should choose a replacement product that matches the item description, using an N, C, X or Z code as appropriate to inform head office staff carrying out subsequent validation on the replacement. If a replacement product cannot be found, the collector should use an M code.
6.2.8 Obtaining a price per unit
Some food items, such as cheese, are sold in packs of variable weight, so it may not be possible to find the identical weight each time. In this case, a price per unit weight is collected. If it is not marked, it is calculated from the displayed price and weight. Each month, a pack of roughly the same weight is used, as a lower price per unit weight may be charged for larger packs.
If a single good such as one bar of chocolate is specified, and it is only available as a multi-pack in January, the price of one bar is computed from that of the multi-pack. The same multi-pack is used in subsequent months. If price collectors are forced to calculate a single good price from a multi-pack price, they are instructed to use the smallest multi-pack (for example, using a two-pack rather than a three-pack).
6.2.9 Special rules for individual items
Book prices are collected locally; the collection is carried out in a mixture of specialised book shops, stationers and major retail chains. The collectors are required to price both fiction and non-fiction books, in both hardback and paperback (three price quotes in total), from a list of bestsellers compiled by a market research company based on their Sunday Times subscription. There is one exception to this: teenage fiction, whereby we compile our own list based on information from two high street retailers. The selected title is then priced until it falls out of the list from which it was selected. In all cases, the author’s name, number of pages, position and details of the bestseller list used must be provided to enable the collector to decide on comparability when a new title has been chosen. Collectors are also asked to price a reference book, a teenage fiction book and a children’s book for under-5-year-olds, all of their own choice.
Locally collected CD albums and singles, pre-recorded DVDs, Blu-ray discs and computer games are priced in a similar way to locally collected books. For CDs, Blu-ray discs and computer games, the selection is made from the top 40 bestsellers’ list in the shop in which the price collection takes place. These items are thus collected differently from other items as their chart positions or bestselling status are used to determine their place in the basket rather than a specific CD, Blu-ray disc or computer game being selected and recollected in following periods. The item is then priced until it falls out of the list when a replacement is chosen. A similar approach is used for DVDs, except the selection is made from the top 20 best seller list from an online chart.
6.3 Central collection: central shops
Central shop prices are obtained from major chains of shops with national pricing policies. Branches of these chains can then be excluded from the local collection. Some chains enter price data on spreadsheets via emails; more frequently, the data is obtained from the company’s website. Mail order catalogues are also treated as central shops: prices are collected via the internet twice a year. These prices are combined with those for the same items from the local collection.
Chains with no national pricing policy cannot be treated as central shops. However, it may be reasonable to visit only a few of their outlets and assume that each outlet reflects their pricing policy within a given region. Chains treated like this are called regional central shops. For these chains, one collection is carried out in each of the 9 regions in England, Wales, Scotland and Northern Ireland, where the retailer operates. This means a maximum of 12 price quotes will be collected for each item in each retailer. The prices collected in these stores are given extra weight to reflect their market share, in the same fashion as the weights applied to central shop collected prices (see Section 8).
6.4 Central collection: central items
There are about 150 items for which the prices are collected centrally, with the index calculation being carried out separately from the main method of index production. Selecting this type of collection and calculation is usually dependent on one or more of the following considerations:
sources of data
data presentation
frequency of price changes
the possibility of future fundamental changes to pricing methods
For most of these items, the method of collection and calculation is based on the generic model, the exceptions being those referred to in Section 9. Indices are aggregated from the lowest level up, with weights often available at the level of individual price quotes. Where weights are not available, the item index is generally calculated using the geometric mean or a ratio of average prices. The weights data used in the centrally calculated indices come from a variety of sources, which are usually specific to a particular index.
6.4.1 Collection
Where feasible, price data is collected over the internet. If this is not possible, price data is collected from one central source (for example, trade associations and Government departments) whenever possible; although, market forces do require contact with regional or competing companies in many cases. Data may be requested in writing, by telephone or by email, or may come automatically because we are on a provider’s mailing list. Providers may send either a full price list or tariff sheet from which the relevant prices will be extracted. Some travel fares data are provided in the form of price indices. Frequency of inquiry varies across the range of items and depends on when prices are known or expected to change. The most common frequencies are monthly, quarterly or annual. However, thrice (for example, some travel fares), twice (for example, local authority rents) and once a year (for example, football admissions) as well as “when necessary” (for example, when changes to national rail fares come into force) are also included in the timetable.
For DVDs and Blu-rays collected centrally over the internet, prices are only collected for the top 10 DVDs and Blu-rays on an online official charts bestseller list each month. The prices for these top 10 items are then collected from the websites of major retail outlets. CDs are also collected using the bestsellers list, but the top 20 are used. For these products therefore, prices are collected using chart positions over time rather than a specific item being selected.
A similar approach is used for computer games. Prices of the top few games (between three and 10, depending on the retail outlet and type of platform) on an online top 10 list are collected centrally from several major retailers.
6.5 Alternative data sources
In addition to the local and central collections, we are currently investigating the use of alternative data sources such as web-scraped prices and scanner data. Web-scraping data involves using a robot tool to extract price data from retailer websites. Scanner data requires companies to provide data that includes the prices and quantities of any transactions made.
For further information on our plans to introduce alternative data sources into consumer price statistics, please refer to our article.
Back to table of contents7. Validation procedures
7.1 Summary
The validation checks described in this chapter are applied to prices collected locally as well as prices collected for central shops, except for some centrally collected items, as outlined in Section 7.4: Exceptions.
7.2 Local collection checks using hand-held collection devices
Several checks are carried out on locally collected data to ensure that indicator codes (described in Section 6: Collection of prices) and price values have been entered on the hand-held collection device sensibly and correctly.
Key performance indicators (KPIs) are agreed with the external price collection agency to ensure that the expected quality and quantity of the price quotes sent across to the Office for National Statistics (ONS) are met.
The price collectors are prompted to validate their input on the hand-held collection device under the following circumstances:
the price entered lies outside the minimum and maximum price range (see Section 7.2.1: Min–max check) and/or outside the price change check range (see Section 7.2.2: Price change check) and/or is not accompanied by an appropriate comment
a C, N, Q, X or Z code has been entered without providing an appropriate comment
a C, N, X and Z code has been entered without any amendments to the product description
a T or M code has been entered alongside a genuine price, as opposed to a zero price (£0.00)
an S code has been entered when the price has not decreased from the previous month
an R code has been entered when there has not been either an S, X or Z code the previous month, or the accompanying price is less than, or the same as, that of the previous month
a W code has been entered without an accompanying volume or weight change, or a comment has not been provided to describe this change
letters or special symbols have been incorrectly entered in the price field or prices have been rounded inappropriately (to more than two decimal places)
7.2.1 Min–max check
Whenever a collected price quote exceeds the maximum or is below the minimum value set for that item, a warning message appears on the hand-held device. The min–max range for each item is derived from valid, non-zero price quotes from the previous month. The smallest and largest valid price quotes across all locations and shops are taken and then expanded by a set percentage, referred to here as the price-range percentage, to form the min–max range. The price-range percentage is set by item groups, except for some specific food items.
The agreed percentages are:
home-killed lamb – 50%
fresh fruit and vegetables – 100%
clothing and footwear – 40%
all other items – 33%
For example, tea bags are included in the “all other items” group, hence the price range percentage is 33%. Suppose that the cheapest packet of tea bags collected in May was £1 and the most expensive was £8. If a packet of tea bags that costs 70 pence was priced in June, then the min–max check would compute the following ranges for the quote:
Even though the value collected in June (70 pence) is less than the lowest price collected in May (£1), because it is between the adjusted minimum and maximum range, this price quote passes the test.
The scaling factor is applied with the aim of reducing the amount of genuine price quotes that fail validation. This helps to account for seasonal sales – for example, many clothing items experience large price reductions during the January sales, which would automatically fail validation if the scaling factor was not applied.
If the collected price exceeds the min–max range, the collector is asked to confirm the price they have entered is correct or to correct the price if it has been recorded incorrectly. Additionally, the collector can add a “Q” code and an associated comment to accompany the price for review.
7.2.2 Price change check
Every price quote collected is compared with the price for the same item, in the same shop, collected in the previous month. A warning message appears if the month-on-month change exceeds an agreed percentage change range for that item. Percentage change ranges are calculated by applying the price-range percentage (as seen in Section 7.2.1: Min–max check) to the price collected in the previous month. This generates upper and lower bounds for the price in the current month.
For example, if the price of a packet of tea bags in a specific shop in London increases from £8 in May to £9 in June, the hand-held device will compute the following ranges for the quote:
As the June price (£9) is between the lower and upper price change value, and therefore falls within the price change check range, it passes this test.
If a valid price for the previous month is not found, for example, because the item was out of stock, the check is made against the price two months ago or, failing that, three months ago. If there is no valid price for the previous consecutive three months, the test is not carried out. If the product had been recorded with an indicator code, then the tests are not carried out.
7.3 Internal data consistency checks
After the locally collected data are transmitted to the head office, the data are put through a series of checks.
Initial checks are carried out to ensure that data are complete and correct. For instance, checks are run to ensure that unexpected duplicate prices (for the same item, in the same shop, in the same location) are removed and that the location, outlet and item identifier codes that accompany each price exist and are valid. If any prices fail these checks, they are returned to the external collection agency for clarification and, if necessary, are re-submitted following corrections.
Once the price data are correct and complete, the quotes are run through a series of validation checks. Staff within the head office then review all price quotes that are failing these checks, along with any indicator codes, history of the quote, quote description and any messages provided by the collectors.
With the information available for each failed price, staff make one of the following decisions:
accept the price and metadata
accept the price but as a new non-comparable product and thus calculate a new base price (see Section 9: Special issues, principles and procedures)
accept the price but as a new comparable product and retain the same base price
change the price (if a price correction is confirmed by the external collection agency or another source – for example, on the retailer website)
change the response indicator (for example, to highlight the product is on sale or recovering from a sale)
confirm rejection of the price
7.3.1 Summary of validation checks
This section covers a summary of each validation check in order.
7.3.1.1 Quotes rejected in the previous month
Quotes are rejected as part of the internal scrutiny process if they do not meet the specified criteria outlined in the product guidance, or if the price or response indicator cannot be appropriately verified based on the information provided. In the following month, any quotes that had been rejected in the previous month are then flagged for review, to ensure that the price collector has taken appropriate action.
7.3.1.2 Price indicator checks
Price indicator checks ensure that if a given indicator code is used, for example, a T (temporarily unavailable) or an M (missing) indicator code, the price quote should have a corresponding £0 price. A quote with any other indicator code should have a greater than £0 price.
7.3.1.3 Message line check
Message line checks ensure that any quotes with indicator codes that require further information in the metadata provided by the external collection agency contain the information required.
7.3.1.4 Weight changes
Any quotes that have been marked with an indicator code “W” indicate there has been a weight or size change in the product. These are flagged for review by internal staff so that the weight adjustment is appropriately applied. These checks would flag if there were any discrepancies in units of measurement that needed to be accounted for – for example, if one month a weight is recorded in grams, and the next month in kilograms.
7.3.1.5 Price relative check
Any quotes showing extreme price changes since the base month (or within the previous three months if the product was temporarily unavailable in the month prior) are flagged for additional verification in the central office. Currently these thresholds are set to flag quotes that are more than 180% of the January base price or less than 60% of the January base price. For example, if the price of a chocolate bar in January was observed at £1, if in the current month the same chocolate bar is greater than £1.80 or less than 60 pence, the quote will be flagged for validation (unless they meet the criteria for auto acceptance, outlined in Section 7.4.2).
7.3.1.6 Min–max and price change checks
The checks described in Section 7.2: Local collection checks using hand-held collection devices, are applied again. Some price-range percentages used differ from those used on the hand-held devices. The ranges are now:
home-killed lamb – 50%
fresh fruit and vegetables – 0% (test not applied because of volatility)
food – 35%
clothing and footwear – 40%
all other items – 33%
Unlike the validation checks on the handheld devices, the only indicator codes that preclude these checks from being carried out are N or Z codes.
7.3.1.7 Tukey check
Taking just the prices not already flagged as potentially spurious or those with N or Z codes, an outlier detection process known as the Tukey algorithm is used to identify additional outliers.
The Tukey algorithm has been used in the production of our consumer prices statistics since 1987. It produces limits that are intuitively reasonable, consistent from month to month, robust in the presence of outliers (in other words, adding in one or two rogue observations does not affect the limits set by the algorithm very much) and robust as data volume changes (that is, limits calculated from a subset of the data do not vary much from those calculated on the full dataset).
The Tukey algorithm identifies and invalidates price movements that differ significantly from the norm for a particular item. For seasonal items with erratic price movements, the algorithm looks at price level rather than price change. It has three parameters that govern its operation, which are set uniformly over all items, though this is not essential.
The algorithm operates as follows:
the ratio of current price to previous valid price (the price relative) is calculated for each price quote (in the case of items tested by price level rather than price change, this stage is omitted)
for each item, the set of all such ratios is sorted into ascending order and ratios of one (unchanged prices) are excluded (in the case of items tested by price level rather than price change, the prices themselves are sorted)
the top and bottom 5% of the list are removed (this 5% is parameter one)
the trimmed mean is the mean of the residual observations
the upper and lower “midmeans” are the means of all observations above or below the trimmed mean
the upper (or lower) Tukey limit is the trimmed mean plus (or minus) 2.5 times the difference between the trimmed mean and the upper (or lower) midmean; this figure of 2.5 represents parameters two and three and these parameters can be set independently if desired but are currently set to be equal
price relatives, or price levels, outside the Tukey limits are flagged as invalid
7.3.1.8 Missing three months or over
If a quote has been unavailable for three or more months, in the month that a product has re-entered the collection it is flagged for review, so it can be ensured that the quote is the same as, or comparable with, the quote collected last time it was available, or else it uses the appropriate indicator code.
7.3.1.9 New item, shop or location
Any quotes collected for the first time because they are either a new basket item or have been collected from a new shop in an existing location or a new shop in a new location are also flagged for review. This is to ensure the product priced meets the item description as specified by the central team.
7.3.1.10 Other indicator code checks
Other indicator codes are also routinely checked during the validation process. For example, quotes with a Q (query) code mean there has been some uncertainty during collection and therefore have been flagged for inspection by internal staff. Any quotes with N (non-comparable replacement) or Z (non-comparable replacement on sale) codes can also be reviewed to ensure the product chosen to replace the originally sampled product is still representative of the specified item.
7.3.1.11 Final check
As a final check, the price relative check (see Section 7.3.1.5) is re-run after all other scrutiny activity has been completed. A report of all locally collected quotes is issued to senior price analysts for final approval. At this stage, the scrutiniser will seek confirmation that particularly high or low outliers have been checked and may withdraw them from the final calculation if not satisfied. Any quotes withdrawn (rejected) from elementary aggregation are checked with the external collector during the ensuing index cycles.
7.4 Exceptions
7.4.1 Validation check sequencing
Sequencing procedures mean that if a quote fails a certain check, it will not be included in additional checks. For example, if a quote is flagged as having an N or Z indicator code, that quote will only contribute to the min–max check.
7.4.2 Auto acceptance rules
Quotes that initially fail the price relative, min–max or price change checks are validated automatically in the following circumstances:
the indicator code (see Section 6: Collection of prices) shows that the item is on sale in the current month but was neither on sale nor recovering from a sale in the previous month, and the price has fallen by less than 55%
the item has recovered (R) from a sale in the previous month, and there has been a price increase of less than 110%
the price in the current month is the same as the (valid) price in the previous month
Quotes that initially fail the Tukey check are validated automatically only if the price in the current month is the same as the (valid) price in the previous month.
If there is not a valid quote in the previous month, quotes from up to three months before the current month can be used for auto-acceptance.
7.4.3 Centrally collected items
Items that are collected centrally via telephones and externally collected items that are supplemented with an internal Office for National Statistics (ONS) collection undergo the same validation procedures as those outlined in Section 7.3. However, the remainder of the items are validated on a case by case basis. Our staff record price quotes and other descriptors for these items on assigned spreadsheets, some of which are programmed to flag up potentially anomalous observations. Supporting evidence for price quotes collected are stored and subsequently used to verify the entered price during checking. Typically, price quotes for centrally collected items are checked by two members of staff: an initial checker and a sign-off checker.
7.4.4 Owner occupiers’ housing costs
The validation of owner occupiers’ housing costs (OOH) is explained in our Price Index of Private Rents Quality and Methodology Information (QMI).
Back to table of contents8. Weights
8.1 Introduction
Please note that, from March 2025, we have introduced “consumption segments” into the aggregation structure for our consumer price inflation statistics. The information in this section has not been updated and therefore does not reflect this new aggregation process. We aim to fully update the Consumer Prices Indices Technical Manual to coincide with the introduction of groceries scanner data planned for March 2026, and will update the information on aggregation at that point. In the meantime, information on consumption segments can be found in Impact analysis on transformation of UK consumer price statistics, January 2025.
Consumer price indices measure changes in the cost of a representative basket of goods and services. This involves weighting together aggregated prices for different categories of goods and services so that each takes its appropriate share within household budgets. For instance, as most people spend far more on electricity than on baked beans, a price rise for electricity must have a greater effect on overall price rises than a similar-sized increase for baked beans. At the lowest level, therefore, each elementary aggregate (Section 3) should receive a weight equal to the ratio of total expenditure on that good or service to all expenditure in the UK on goods and services within the scope of the index.
The Consumer Prices Index including owner occupiers’ housing costs (CPIH) and Consumer Prices Index (CPI) weights cover monetary expenditure within the UK on goods and services that are part of household final consumption expenditure (HHFCE). The weights are based on expenditure within the domestic territory by all private households, foreign visitors to the UK and residents of institutions (such as nursing homes, retirement homes and university halls of residence).
Within consumer price indices, there are four main categories of weight:
central or regional shop weights (Section 8.2)
stratum weights (region and shop type, Section 8.3)
item weights (Section 8.4)
Classification of Individual Consumption According to Purpose (COICOP) weights for the CPIH and CPI higher-level indices (Section 8.5)
1) and 2) are used to produce the item indices (that is, combining the individual price quotes up to the items within the basket); 3) are used to produce the COICOP subclass-level indices; and 4) are used to produce the COICOP class-level, group-level, division-level and the all-items indices. Both 3) and 4) are published.
Figure 3: Aggregation procedure in the CPIH and CPI

Source: Office for National Statistics
Download this image Figure 3: Aggregation procedure in the CPIH and CPI
.svg (9.3 kB)
The COICOP weights are largely calculated from HHFCE data, since they cover the relevant population and range of goods and services and, in addition, are classified by COICOP. This is supplemented for certain classes by Living Costs and Food Survey (LCF) data, International Passenger Survey (IPS) data, and data from the Public Sector Division of the Office for National Statistics (ONS).
In 2017, an additional level of the COICOP classification was introduced. This new level of detail, known as COICOP5 (or subclass in Figure 3) sits between the existing class-level (or COICOP4) indices and item-level indices. This is explained in greater detail in Section 8.5.1: COICOP weights.
All the weights used in compiling the measures of consumer price inflation are updated annually to coincide with the general review of the representative items in the basket (Section 5). Firstly, this ensures that the weights reflect the introduction of new items and the deletion of those no longer needed. Secondly, using up-to-date expenditure data ensures that the indices remain representative of current household expenditure patterns over time.
8.2 Central shop weights
As discussed in section 8.1, the information in this section has not yet been updated to reflect the introduction of "consumption segments".
These weights reflect the market share of chain shops and are used to weight the centrally collected shop prices. They are not strictly weights; they are replication factors that give the number of times that each central shop price should appear in each stratum. The centrally collected shops are of two types: supermarkets and non-supermarkets.
8.2.1 Supermarkets
The five biggest supermarkets account for about 65% of the food market. The method of price collection depends on the pricing policy of the company. If prices are reasonably uniform throughout the country, it makes sense to collect the prices centrally; if there are likely to be substantial regional variations, prices must be collected separately in each region. The five biggest supermarkets are all treated as regional collections and priced regionally (Section 6).
The same central shop weights are used in all measures of consumer price inflation. The market shares of the companies are calculated mainly from Living Costs and Food Survey (LCF) data, along with a variety of sources such as market research reports. These are then broken down into individual shop weights for each item priced at that shop. Before the shop weights are estimated, the stratum weights, the number of prices expected to be collected in each stratum cell and the weights given to other supermarket chains are considered. The weights for each company are broken down to regions, based upon the distribution of the company’s shops.
Suppose that for item “X”, which is stratified by shop type but not region, there is just one centrally collected supermarket “Shopco”, while all the other price data for this item are collected locally. Assume also that the following statistics relate to the collection of data for this item:
item “X” is stratified by shop-type (multiple versus independent shop types) only
“Shopco” has 20% overall market share for item “X”
on average, around 160 price observations are taken locally each month, of which 110 come from multiples and 50 from independent shops
multiples in total have a 75% market share for item X
Then, the single price observation from “Shopco” will be replicated 40 times in the multiple shop-type stratum cell. This means that of the 200 total price observations, 40 will be from “Shopco”, thus giving it 20% of the market share. Overall, there will be 150 price observations in the multiple-shop stratum cell (110 locally plus 40 from “Shopco”) and 50 price observations in the independent-shop stratum cell (all collected locally). The two stratum indices can then be combined using stratum weights to produce an item index for item “X”.
The formulae used to calculate the replication factors are:
where:
Rt = total of all replication factors for that item
Rs = replication factor for central shop s
L = expected number of prices to be locally collected for multiple shops for that item
Mt = market share for all central shops for that item (as percentage)
Ms = market share for central shop s for that item (as percentage)
W = shop-type stratum weight for multiple shops for that item (as percentage)
For example, suppose for central shop s, the following values apply:
L = 60;
Mt = 61;
Ms = 11;
W = 68
Inserting these values into the formula, the total of all replication factors for that item, Rt is 522.86, which rounds to 523, and the replication factor for central shop, Rs, is 94. So, 94 copies of the price collected from that central shop for that item will be included in the database when calculating the item index. If the item is also stratified by region, then the replication will be split up so that the price is replicated within each region as well. The proportion of the replication factor put into each region depends on market information on total revenue by region for that shop. If this information is not available, the proportions are estimated by examining the total number of outlets for that shop in each region.
8.2.2 Non-supermarkets
Central shop weights for non-supermarket retailers are calculated in the same way as for supermarkets. For other prices collected centrally (principally for clothing and minor household goods), two prices are collected for each item (in other words, two brands or varieties are priced).
8.3 Stratum weights
As discussed in section 8.1, the information in this section has not yet been updated to reflect the introduction of "consumption segments".
For some types of expenditure, purchasing patterns may differ markedly by region or type of outlet and, in these cases, stratification will improve estimates of item indices. Each locally collected item in the index is allocated to one of four different stratum types. This allows the best available information about purchasing patterns to be incorporated in the index calculation. The four stratum types are:
region and shop type
region only
shop type only
no stratification
The assignment of stratum type depends on the information available for constructing the weights for each item and the number of prices collected per item. In principle, all locally collected items should be stratified by both region and shop type. But if the weights data are inconclusive or there is no information available, then the item is allocated to another stratum type. Allocation also partly depends on which shop types were specified for the collection of prices and the number of prices collected. If the rules for the choice of outlets (Section 5) did not specify that both a multiple and an independent should be chosen for an item, there may be too few prices collected in one of these shop types to make stratification by shop type meaningful. In some instances, there is no stratification because research has shown that stratification has little effect.
Once calculated, the same stratum weights are used in all measures of consumer price inflation.
8.3.1 Shop type
Two types of shop are identified for the stratum weights: multiples and independents. Retailers with fewer than 10 outlets in the UK are classified as independents, while retailers with 10 or more outlets are classified as multiples. Shop-type weights were updated annually using data collected in the Annual Retailing Inquiry until its termination in 1999 and were updated where possible using data from various sources, including the Living Costs and Food Survey (LCF) until 2006. As of March 2020, the shop-type weights are updated annually using data collected in the Annual Business Survey matched to outlet counts from the Inter-Departmental Business Register. The same shop-type stratum weights are used in all measures of consumer price inflation.
8.3.2 Region
Regional stratum weights are used in the construction of many item indices. They represent the proportion of national average household expenditure by category of product in each region of the UK. The Living Costs and Food Survey (LCF) provides average household expenditure by product category and Government Office Region (GOR). From this, the percentage of expenditure in each product category and region is calculated. The regional weight for an item is the percentage for its section. Thus, if 12% of expenditure on fresh fruit occurs in Scotland, the regional weights for apples, oranges, etc. for Scotland are all 12%.
For example, suppose that for item X, the proportion of expenditure is 60% in multiples and 40% in independent shops and that the regional breakdown of expenditure by index households (expressed as percentages) for item X is as follows:
| Region | Proportion of expenditure (%) |
|---|---|
| London | 15 |
| South East | 15 |
| South West | 10 |
| Eastern | 5 |
| East Midlands | 5 |
| West Midlands | 10 |
| Yorkshire and the Humber | 10 |
| North West | 10 |
| North East | 5 |
| Scotland | 5 |
| Wales | 5 |
| Northern Ireland | 5 |
Download this table Table 3: Regional breakdown of expenditure by index households for item X
.xls .csvThen, the stratum weights for item X will be as follows:
| Region | Multiples weight | Independents weight |
|---|---|---|
| London | 0.09 | 0.06 |
| South East | 0.09 | 0.06 |
| South West | 0.06 | 0.04 |
| Eastern | 0.03 | 0.02 |
| East Midlands | 0.03 | 0.02 |
| West Midlands | 0.06 | 0.04 |
| Yorkshire and the Humber | 0.06 | 0.04 |
| North West | 0.06 | 0.04 |
| North East | 0.03 | 0.02 |
| Scotland | 0.03 | 0.02 |
| Wales | 0.03 | 0.02 |
| Northern Ireland | 0.03 | 0.02 |
Download this table Table 4: Stratum weights for item X
.xls .csv8.4 Item weights
As discussed in section 8.1, the information in this section has not yet been updated to reflect the introduction of "consumption segments".
Some items are intended only to represent themselves; others represent a subclass of expenditure within a section. For instance, within electrical appliances, the electric cooker item represents only itself and not any other kinds of electrical appliances. However, other items represent price changes for a set of items that are not priced; the weight reflects total expenditure on all items in the set. For example, a screwdriver is one of several items representing all spending on small tools within DIY materials, and there are other items within the section representing all spending on paint, timber, fittings and so on. It would be difficult to get expenditure data for each possible DIY item and inordinately time-consuming to collect and process these prices every month.
The expenditure figures for all items in a section are expressed as a percentage of the section weight. Each percentage is rounded to the nearest unit, except where percentages are less than 0.5, which are rounded up to 1. Manual adjustments are then made to constrain the sum of each section’s item weights to 100.
8.4.1 CPIH and CPI item weights
Since 2017, the Consumer Prices Index including owner occupiers’ housing costs (CPIH) and Consumer Prices Index (CPI) item weights are updated twice each year – once with the January index, when the new Classification of Individual Consumption According to Purpose (COICOP) weights are introduced, and once in February, when the representative items that make up the basket of goods and services are updated. For details of how the item weights were updated prior to 2017, please refer to the 2014 version of the Consumer Price Indices Technical Manual.
The CPIH and CPI item weights for January are generally calculated by scaling the previous year’s item weights to the new COICOP weights introduced that month, as follows:
where:
i = item i in COICOP subclass C in the basket in year y-1
WyC = weight of COICOP subclass C in year y
WiJan = weight of item i in January of year y
Wiy-1 = weight of item i in February to December of year y-1
This formula assumes that the goods and services covered by a COICOP subclass, and the items used to represent them, are unchanged between December and January. However, this is not the case when coverage of a COICOP class or subclass is extended. In these circumstances, new items will be introduced in January consistent with extensions in coverage and given appropriate weights. Weights for existing items are then scaled so that the sums of weights for all items (new and old) are consistent with the new subclass totals.
When the basket of goods and services is updated in February, item weights are updated by drawing on data from a variety of sources. These include detailed national accounts expenditure data, Living Costs and Food Survey (LCF) data, market research data and other sources including administrative data. For each COICOP subclass, the sum of the new item weights introduced in February is constrained to be equal to the updated subclass weight.
8.4.2 Seasonal item weights
Prior to February 2008, fruit and vegetables (including potatoes) in the measures of consumer price inflation had associated seasonal item weights (that is, the item weights varied from month to month, depending on typical expenditure on that item for each month). However, the higher-level section weights were fixed so that the principle of the fixed basket of goods was maintained. Since February 2008 there have been no items that have variable weights throughout the year.
8.5 Higher-level weights
8.5.1 COICOP weights
The Consumer Prices Index including owner occupiers’ housing costs (CPIH) and Consumer Prices Index (CPI) are classified according to the Classification of Individual Consumption According to Purpose (COICOP). This is the international classification of household expenditure and is used in the production of national accounts, the Living Costs and Food Survey (LCF), and consumer price indices. COICOP enables the consistent classification of individual consumption expenditure incurred by households, non-profit institutions serving households and general government according to their purpose.
In previous years (prior to 2017), there were four COICOP levels, with the fourth COICOP level being commonly referred to as “class level” within consumer prices. Items within these levels are aggregated together using expenditure weights up to COICOP level to form the headline index.
Traditionally, the class level was the first building block of aggregation; however, as of 2017, a new, more detailed level has been introduced into CPIH and CPI aggregation. This new level is referred to as COICOP5 (subclass) and it sits between the existing COICOP4-level indices and item-level indices. Effectively, the COICOP5 classification replaced COICOP4 as the first building block of aggregation in consumer price indices and is the level at which the household final consumption expenditure (HHFCE) is delivered and COICOP-based weights in consumer price indices are first calculated.
Each class is given an integer weight in parts per thousand, following rounding, so that the sum of the class weights equals 1,000. Within each class, each subclass is given a (non-integer) weight so that the sum of the subclass weights equals the class weight. The COICOP weights are calculated from HHFCE data, with the following exceptions:
the LCF, which is used in the calculation of weights for air travel, package holidays and actual rentals
the International Passenger Survey (IPS), which is used in the calculation of the weight for air travel
the public sector component of the national accounts, which is used in the calculation of the weight for passport fees
Since 20171, the COICOP subclass-level weights are updated annually with the January index (published in February), followed by a further update with the February index (published in March) owing to the introduction of an improved methodology in the “double price updating and the change in the level of linking” used for the production of consumer price inflation. The underlying expenditure in each COICOP grouping is converted to an expenditure share relative to total household expenditure for the overall basket and given an integer weight in parts per thousand so that the sum of the weights equals 1,000.
The weights are based on the latest available calendar year’s HHFCE data; however, this data is not timely enough for immediate use in consumer price indices due to the lag at which national accounts data are published. For example, in producing 2019 consumer price inflation weights, the latest available calendar year data are for 2017. To make the expenditure data as up to date as possible, we can restate the expenditure in current prices using price updating.
To explain further, for a given index year y, the weights are based on the latest available national accounts expenditure from y-2.
At the first annual update of weights (published with the January index), the expenditure needs to be price updated to December of year y-1. For the 2019 weights, this would mean expenditure from the calendar year 2017 is updated to December 2018 by applying the respective change in price between 2017 and December 2018.
At the second update of weights, published with the February index, the same underlying 2017 expenditure is updated to January of year y. So, for the 2019 weights, this would mean expenditure from the calendar year 2017 is updated to January 2019 by applying the respective change in price between 2017 and January 2019. This approach ensures the latest available expenditure is adjusted so that it is suitable for use in the calculation of consumer price inflation weights.
Further details as to how weights are calculated can be found in the Consumer price inflation, updating weights article.
8.5.2 Special case: Insurance
Insurance premiums can be considered as being made up of two parts – a payment into a “claims pool”, which is redistributed back out to households following insurance claims, and a service charge, which is the amount households pay for the service provided by the insurance companies.
When calculating the weights in the Consumer Prices Index including owner occupiers’ housing costs (CPIH) and Consumer Prices Index (CPI), the difference between household expenditure on insurance premiums and the amount redistributed back to households through claims is allocated to the relevant insurance heading. This calculation is based on the average of the most recent three years’ data. As insurance expenditure is recorded on a net basis (the difference between expenditure on insurance premiums and the amount paid out in claims), this approach safeguards against exceptional cases where the amount paid out in claims could exceed the amount paid in premiums. Note that the insurance indices themselves are constructed with reference to gross premiums paid.
8.6 Weights calculation for centrally calculated indices
For indices that are calculated centrally, weights are used to aggregate the strata (for example, varieties and suppliers) used in the item index calculation wherever this information is known. Wherever possible, weights used are calculated in expenditure terms, but where this information is not available, weights based solely on market shares are used as the closest available proxy. For some centrally calculated indices (or for some strata within a central index), no weights information is available and the item index (or stratum index) is calculated using geometric means or the ratio of average prices (Section 3).
Notes for: Weights
- For details of how weights were calculated prior to 2017, please refer to the 2014 version of the Consumer Price Indices Technical Manual.
9. Special issues, principles and procedures
9.1 Introduction
Most components of consumer price indices are collected locally or centrally in the manner described in Section 6, constructed as shown in Section 3, and combined using weights data as described in Section 8. However, there are some areas that are not covered by these generic descriptions for one reason or another, and these are described within this section. The issues covered are subsidies and discounts; product substitution, quality adjustment and imputation; services previously provided free; and other special cases.
9.2 Subsidies and discounts
There is a long-standing principle that the prices used in calculating consumer price indices are those actually paid by households. This may appear simple, but in practice it is difficult to implement in a completely consistent way, and there are several special treatments.
A European Commission Regulation (no 2602/2000) provides guidelines on the treatment of price reductions in the Harmonised Index of Consumer Prices (HICP).
The guidelines are implemented in the following ways in the production of the consumer price indices.
Discounted and subsidised prices are only recorded if available to anyone with no conditions of sale, otherwise the non-discounted or unsubsidised price is recorded. Money-off coupons and loyalty cards are excluded. Reduced prices for payment by direct debit are included in the calculation of some centrally calculated indices such as electricity charges. If there is a discount for multiple purchases, only the price of a single purchase is recorded. Where a price reduction on one product is associated with the purchase of another product, this reduction is excluded. However, a reduction associated with a given level of total spending on purchases is included where the cost of the single item being priced lies above that level (for example, the discount “10% off for purchases over £500” would be deducted for a bed priced at more than £500).
Sale prices are recorded if they are temporary reductions on goods that are likely to be available again at normal prices or end of season reductions. Prices for special purchases of end-of-range, damaged, shop-soiled or defective goods are not recorded as they are deemed not to be of the same quality as, or comparable with, goods previously priced or those likely to be available in future.
Free gifts or extras such as plastic toys in cereal boxes, “send in 20 tokens for a free pen” and trading stamps are ignored; they are regarded as extras that may not be wanted by consumers. Prices for items temporarily bearing extra quantities (for example, 20% extra free) are not adjusted to account for the increased quantity.
Rebates: the treatment of these is not clear-cut. It is made on a case-by-case basis, with reference to historical precedents. For instance, they are sometimes treated as subventions to income and hence not allowed as a price change, as in the case of rent rebates; in other cases, they are treated as price changes. Two examples come from electricity charges. Regional electricity companies made a one-off reduction of about £50 on their charges on the first bill of 1996 to all domestic customers in England and Wales, as a result of the flotation of the National Grid in December 1995. Its main economic impact was considered to be to raise household incomes (that is, electricity consumption was not expected to increase markedly) and so it was not treated as a price reduction. This was consistent with the UK National Accounts treatment of the rebate according to international guidelines of national accounts compilation (the European System of Accounts) where a price change is expected to “have a significant influence on the amounts producers are willing to supply and on the amounts purchasers wish to buy”. However, more recently, there was a further reduction on electricity bills as a result of the abolition of the fossil fuel levy. In this case, it was decided, because of the payment method of the rebate (reducing bills rather than sent as a separate cheque) and in accordance with historical precedents that this would be treated as a price change.
9.3 Product substitution, quality adjustments and imputation
One of the more difficult issues in producing the consumer price indices is the accurate measurement and treatment of quality change due to changing product specifications. As a measure of price change alone, measures of consumer price inflation should reflect the cost of buying a fixed basket of goods and services of constant quality. However, products often disappear or are replaced with new versions of a different quality or specification, and brand-new products also become available. When such a situation arises, one of the following methods is adopted:
a. Direct comparison
b. Direct quality adjustment
c. Imputation
In all cases, a nominal price in the base month is needed for the new or replacement product; this nominal base price is used until the following January. If the retailer can supply the previous January price of the new product, this can be used as the new base price with no further adjustment.
a) Direct comparison
If there is another product that is directly comparable (that is, it is so similar to the old one that it can be assumed to have the same base price), for example, a garment that is identical in all respects but colour, then the new garment directly replaces the old garment and its base price remains the same. This is described as “obtaining a replacement that may be treated as essentially identical”, and it is equivalent to saying that any difference in price level between the new and the old product is entirely due to price change and not quality differences.
b) Direct quality adjustment
This is the preferred method of dealing with the situation where a replacement product is of a different quality or specification. An attempt is made to place a quantitative value on the quality or specification difference, and the base price is adjusted accordingly. This section discusses quantity adjustment and hedonic regression. Another method of direct quality adjustment, option costing, can be used when a product changes in specification and it is possible to value separately the components that have changed.
Quantity adjustment
The simplest form of direct adjustment is quantity adjustment, which is used when there is a permanent size change in an item. This occurs most frequently with homogenous goods such as food and drink, and it is used, for example, when the size of confectionery bars is changed. In this case, in each outlet the nearest equivalent new size of the product priced in that outlet is found and an adjustment made to the base price pro rata for the change in weight.
For example, if the base price of a chocolate bar is 50p and the weight decreases from 85g to 80g, the new base price is 47p:
More complex calculations are required when a component part of a more complex product changes in specification. In practice, adjustments of this sort can only be made where it is possible to value the change separately. The following section describes how this is done using the hedonic regression technique.
Hedonic regression
Hedonic regression is a technique that uses ordinary least-squares regression to relate the price of an item to its measurable characteristics. Since 2014, it has been used for quality adjustment of desktop personal computers (PCs), laptop PCs, pre-pay smartphone handsets and tablet PCs. For PCs, the measurable characteristics may include the speed of the processor, the size of the hard disk drive and the amount of memory. For smartphones, the characteristics may include the screen size and resolution or the number of camera megapixels. The results of the regressions are used to value changes in quality when a product that is part of the sample is no longer available and is replaced by another product.
Here is an example of how the hedonic regression technique is done for PCs. Hedonic regressions are calculated based on a single month’s data, using unweighted regressions built from price and attribute data collected from retailers’ websites. The log of price is chosen as the dependent variable in the regression for two reasons. Firstly, a log-linear model produces a multiplicative relationship between the price of a PC and its attributes, which is a better reflection of pricing in the retail market. This is because the cost of adding a new feature tends to be related to the underlying quality and price of a machine. For example, the addition of a solid-state drive (SSD) to an expensive PC typically costs more than to a cheaper PC, because a higher-quality drive will be included in the more expensive PC. Secondly, multiplicative relationships are more robust to general changes in price and so have a longer life span.
An iterative approach is used to derive the hedonic regressions. This procedure includes an element of statistical judgement and product or market knowledge, and it is preferred over the more traditional automatic stepwise regression technique because it is better able to cope with the potential relationships between independent variables in the regressions. For instance, the attributes “resolution” and “pixels per inch” are inter-correlated because pixels per inch is formulated from the PC’s vertical and horizontal resolution and its monitor size. These relationships can cause the automatic methods of regression estimation to produce either sub-optimal regressions or, in some circumstances, ones in which the relationships revealed are counter-intuitive.
The regression models are then used to predict prices when an existing PC in the sample is no longer available and has had to be replaced by a PC with a different level of quality. Price adjustments are made based on the ratio of predicted prices for the base and current period products.
The following is an illustrative example of how hedonic-based quality adjustment can be applied in a situation where an individual PC was priced in January but could not be found in February. The replacement is close in quality, but it has a single change in specification – an increase in processor speed.
Step 1: Produce regression function
Step 2: Predict old and new price
| Regression model | January PC | February PC | |||
|---|---|---|---|---|---|
| Attribute | Coefficient | Level | Effect on price | Level | Effect on price |
| Brand | PC company A | PC company A | |||
| Intercept | 5.02277 | 1 | £151.83 | 1 | £151.83 |
| Monitor | 0.03886 | 19 | x 2.09 | 19 | x 2.09 |
| Processor speed | 0.00014 | 1600 | x 1.25 | 2800 | x 1.48 |
| Hard drive | 0.00004 | 640 | x 1.03 | 640 | x 1.03 |
| Memory (MB) | 0.00003 | 3072 | x 1.10 | 3072 | x 1.10 |
| Video card | 0.06673 | 1 | x 1.07 | 1 | x 1.07 |
| Predicted price | £480.87 | £569.35 | |||
| Actual price | £475.00 | £550.00 | |||
Download this table Table 5: Using the regression function to predict an old and a new price
.xls .csvThe effect on price for each individual attribute is calculated by multiplying the level of the attribute by its coefficient, and then taking the exponential of the resulting value. For instance:
These effects on price are then multiplied together to give the overall predicted price:
For instance:
Step 3: Adjust base price to reflect new attributes
This step essentially computes the price that the new product would have sold for, had it been available in the January (base) period.
Step 4: Compare current price with new base price
The calculation shows that once the difference in quality between the original PC and its replacement has been accounted for, the price has effectively fallen by 2.2%. This compares with an increase of 15.8% in the unadjusted prices.
Regression models for each hedonic item are updated regularly throughout the year to account for new and changing product attributes, for example, the introduction of a new operating system or a new feature such as a curved screen. It also accounts for advancements in the technology market to avoid extrapolation of the model coefficients to values not seen when the models were initially produced.
c) Imputation
If the replacement product is of a different quality or specification, and no information is available to quantify the difference, assumptions must be made. A base price is calculated for the new product by assuming that its price change from the base month up until that month equals the average price change for products within the same stratum. Thus, if the price is £14.99 and the index for that item (calculated excluding the product in question) in that stratum is 108.34, the new base price is:
This procedure ensures that bringing in the new product has no effect on the elementary aggregate for that item in the month that it is introduced.
If an outlet closes, or refuses to allow further price collection, all products priced there are dropped. In that case, a new outlet is selected in the same location and new base prices are imputed for products priced in the outlet, as shown earlier.
9.4 Services previously provided free
From time to time, services that have hitherto been provided free at the point of provision have become chargeable. Examples are the introduction of university fees in 1998 and the London congestion charge in 2003. The problem for consumer price indices in these cases is twofold:
there is no weight in the base period (expenditure is zero)
there is no base period price with which to compare the new price to create a price relative
The solution is to go back to the standard formulation of the Laspeyres index (Section 3) in terms of quantities and price levels, rather than expenditure weights and price relatives. We treat the new product as if it were already included in an existing section (or item) index with zero price but with non-zero quantity equal to its consumption in the base period. The index is then adjusted from the point of introduction of the new price to take on the new expenditure. The adjustment is as follows:
where:
Ia = adjusted index
Iu = unadjusted index
EXPu = average weekly household expenditure in the base period for the index
Q0 = quantity of the newly priced service used in the base period
Pt = price of the newly priced service
In practice, it is not necessary to know Q0 and Pt explicitly if their product, the expenditure on base year quantity at period t, is known or can be estimated.
After the first year of introduction, the product may merit a separate index.
9.4.1 University fees
From the 1998 to 1999 academic year, new students on full-time higher education courses contributed up to £1,000 a year towards the cost of their tuition. The actual amount depended on their own and, if appropriate, their parents’ or spouse’s income. The introduction of student fees raised several conceptual issues relating to the coverage of the indices and the service paid for.
9.4.1.1 Index coverage
The Consumer Prices Index including owner occupiers’ housing costs (CPIH) and Consumer Prices Index (CPI) are intended to reflect the average spending pattern of private households and spending by residents of institutional households, but in 1998 to 1999 they covered only private households. The definition of household in the case of students might be considered to vary according to whether they are:
dependent or independent (depending on age and whether married)
living at home or away from home
(if away from home) living in communal or independent accommodation
However, in practice, most households would regard dependent students as part of their household even if attending an institution away from home. It was therefore decided to treat all students in higher education as within scope.
9.4.1.2 Scale of fees
In the case of goods or services provided or partly paid for by the government, the amount paid is the charge made at the point of acquisition, not the full economic cost of the service. (A similar approach is used for medicines bought on prescription, where the fixed charge is taken rather than the cost of the medicine itself.) In this situation, students are liable for an amount between zero and a maximum set by the government, depending on their own or family income. This implies that the price recorded, and the index weight, should be that actually paid by the consumers, for which average estimates are made by the Department for Education.
9.4.1.3 Timing
The assumption is made that all fees are billed at the beginning of the academic year, before the October collection.
9.4.1.4 Method of incorporation
Initially, the index was combined with private education fees to compute an adjusted index.
The price of student fees was zero in the base period (January 1998) and an average of £550 in October 1998. This figure was combined with the estimated average payment of school fees. From 2000, higher education fees and private education fees were represented by separate item indices and no longer had a special treatment.
9.5 Special cases
9.5.1 Treatment of seasonal items
A small number of areas covered by the consumer price indices have marked seasonal purchasing or consumption patterns: some items of clothing, gardening products, holidays and air fares. Historically, some fresh fruit and vegetables were also seasonal, though this has become less evident with products being imported from around the world into supermarkets, so that prices are now collected throughout the year. The treatment of seasonal clothing and gardening is described in this section. Air fares and holidays are described in subsequent sections.
9.5.1.1 Clothing and gardening
For seasonal clothing and gardening products, some items are unavailable for part of the year and there is seasonal variation in the supplies of other items. Examples of these include men's shorts, raincoats, barbecues and seeds, all of which are largely available only in certain months of the year.
For these items, we will use the same methods as those outlined in the base price imputation section (in 9.3(c)) - any products where a price is collected in month t, but where there are no base prices, will use the month t prices and the stratum month t index to impute base prices for these products, for us to then calculate indices from month t+1.
The key difference when applied to seasonal items such as those described above, is that if the seasonal item runs (for example) from April to October, then we will not collect any prices between January and March for any of the products, meaning every product lacks a base price, and we will need to use the April prices, along with the April stratum index, to impute base prices for all products. This also means that since no prices are collected until April, the index for the stratum is imputed up until and including April.
9.5.2 Electricity and gas tariffs
For each of the major electricity and gas suppliers, we collect fixed costs (standing charges) and prices per unit of the most popular domestic tariff bands at both day and night rates. Average bills are calculated for each tariff using average consumption figures, and the tariffs for each supplier are weighted together using expenditure figures derived from average bills and customer numbers. The individual suppliers are then weighted together, again using expenditure figures derived from average bills and customer numbers, to give a final index.
9.5.3 Purchase of motor vehicles
9.5.3.1 Second-hand cars
Before 2024, we produced two price indicators for second-hand cars; one for two-year-old and one for three-year-old cars. The two indicators were combined (giving equal weight to each) to give a single price index for second-hand cars. These indicators were based on a sample of 35 models of one-year-, two-year- and three-year-old cars and priced using retail price information from a monthly trade guide. The resulting price indices were weighted together according to the corresponding makes' and models' approximate market shares.
From 2024, our approach for second hand cars has been updated as part of a programme of transformation to utilise new methods and data sources. More details about our current methodology are available in Section 10:3: Rental prices and second-hand cars within Section 10: Introducing new data sources.
9.5.3.2 New car prices
New car prices are also represented within consumer price indices. The index is based on collecting new car prices, net of discounts, from dealer websites for a sample of around 35 cars covering a range of manufacturers. The use of dealer websites to collect new car prices has been effective from early 2012 and was implemented to provide a more realistic measure of true transactional prices.
Details of how the new car price index was calculated prior to 2012 are given in the 2014 edition of the Consumer Price Indices Technical Manual.
9.5.4 Vehicle Excise Duty
Vehicle Excise Duty (VED) rates typically change in April of each year and are pre-announced in the Budget. For this reason, the VED price index is only updated once a year to reflect these changes. The VED rate to which a car is subject depends on several factors:
whether it is in its first tax year or not
when it was first registered
fuel type
what carbon emissions category it falls into
The period for which VED is paid also impacts on price.
A separate index is calculated for new and pre-owned cars using weighted average rates. Volume data provided by the Department for Transport (DFT) are used for weights. The volume data shows the number of cars on the road split by what tax band and payment scheme they fall into. The VED rates for new and pre-owned car indices are then weighted together using expenditure data to create an overall VED price index. The expenditure data is calculated by multiplying the DFT volume data and rate prices collected in the January base period.
9.5.5 Air fares
The key features of the air fares index are as follows:
changes in the price of air fares are recorded in the index in the month in which the flight departs, not when the ticket is bought
prices are compared against January base prices
separate sub-indices are compiled for domestic, short-haul (European) and long-haul flights
prices are collected for return flights at various intervals in advance of departure, reflecting usual consumer behaviour
The sample of destinations is selected in line with their relative importance based on expenditure data derived from the International Passenger Survey (IPS) and the Civil Aviation Authority (CAA).
Prices are collected over the internet from web pages of airlines and the prices recorded are the online prices for travelling with one item of checked-in baggage. The airlines chosen are those with a departure flight closest to a pre-specified time on a particular day on randomly selected routes. The return flight is a pre-specified number of days later. Some flexibility can vary these details, for example, if the prices collected are unreasonably high (because the flight is booked out, for instance). This would involve choosing an alternative flight, operated by a carrier of similar quality, departing at a slightly different time of day, or on the day preceding or following. Only scheduled flights are priced because they account for by far the greater proportion of independent travel. Most of the travel on chartered flights is undertaken as part of a package holiday, which is included in the foreign holiday’s index.
Prices for long-haul flights are collected six months, three months and one month in advance of departure dates; short-haul prices are collected three months and one month in advance; and domestic prices are collected one month in advance. Separate indices are calculated for each advance booking period for each of the three sub-indices, with individual routes weighted according to expenditure share. The short-haul three- and one-month indices are given equal weights in deriving the overall short-haul index while the six-, three- and one-month long-haul indices are weighted together in the proportions 45:45:10. The overall index is obtained by weighting the domestic, short-haul and long-haul indices in line with IPS expenditure and CAA passenger traffic data.
9.5.6 Telephone charges
9.5.6.1 Fixed-line telephone charges
Figure 4 illustrates the detailed pricing information, including VAT, that is collected for both call charges and line rental for each of the main packages offered.
Within each of these packages, headline pence-per-minute call charges are collected according to destination (local, national, international, calls to mobiles and non-geographical calls) and, within each destination, time of day (daytime, evening and weekend). Call charges to 0870 and 0845 are used to represent call charges to all non-geographic numbers. Line rental is collected for all packages.
Figure 4: Stratification of the fixed-line telephone charges index

Source: Office for National Statistics
Download this image Figure 4: Stratification of the fixed-line telephone charges index
.svg (13.4 kB)
Detailed annual consumption information is obtained each year to weight together the individual components mentioned.
9.5.6.2 Cable telephones
Prices are obtained from major suppliers by type of call (local, national, international or to a mobile telephone), by time of day (daytime, evening and weekend), and for connection fees and line rental. For each type of call, prices are weighted together by supplier and by destination (for international calls) or time of day (for other call types) to give indices for each call type. These are then weighted together to give an overall index for cable telephony. The weights are derived from information obtained from the Office of Communications (OFCOM).
9.5.6.3 Mobile phone charges
Mobile phone charges were introduced into the consumer price inflation statistics in 1998. The large number of service providers, complex pricing structures and substantial variation in customer usage pose significant difficulties in accurately measuring the average change in prices actually paid by customers.
The index is based on the monthly bills for a set of detailed customer profiles supplied by the Office of Communications (OFCOM). Each month, the packages offered by the service providers are costed against these profiles and the cheapest package for each profile on each network is used in compiling the index. This methodology therefore embodies the principle of a fixed basket of consumers, as opposed to a fixed basket of representative packages. Profiles are categorised according to voice and text usage and, from 2011, data usage. Company indices are further subdivided between pay-as-you-go (PAYG), contract customers and SIM-only customers, with some variation in specific methodology employed in each case, as we will describe next. The final index is a weighted average of the company indices, with weights based on expenditure shares supplied by OFCOM.
Pay-as-you-go (PAYG)
Pay-as-you-go (PAYG) users have no formal contract with a service provider and so are free to switch between the various packages available following price changes. Each month, the cheapest package available from each of the main service providers is selected for each customer profile and weighted over the profiles to produce a PAYG index for each supplier. The methodology only allows for in-year migration between packages within service providers. Substitution across providers typically involves the additional cost of replacement handsets, and price changes in this case could also partly reflect changes in the quality of the service provided (due to differences in network coverage, for example).
Monthly contract
Monthly contract customers by contrast are usually “locked” into a package for 12 months or more, with the typical contract currently lasting 24 months. For profiles in this group, the cheapest package available is selected in January and tracked in subsequent months in compiling indices for each of the main providers. However, in each subsequent month, it is assumed that every twenty-fourth customer will switch to a cheaper alternative contract package (if one exists) from the same service provider, reflecting the ongoing turnover in existing contracts.
SIM-only
SIM-only customers are typically “locked” into a contract for 12 months. For profiles in this group, the cheapest package available is selected in January and tracked in subsequent months in compiling indices for each of the main providers. However, in each subsequent month, it is assumed that every twelfth customer will switch to a cheaper alternative contract package (if one exists) from the same service provider, again reflecting the ongoing turnover in existing contracts.
9.5.7 Measurement of holiday prices
9.5.7.1 Foreign holidays
The basic principles in the construction of this index are as follows:
a. holidays taken in different months are fundamentally different items, each with its own weight and price indicator: a January holiday is a different item from an August holiday
b. each month’s index covers holidays for all 12 months of the year – the weight for holidays, like all weights, covers expenditure over a 12-month period.
This procedure means that price levels in any month are compared with those in the same month of the preceding year for the same holidays. The resulting price relative is weighted with the price relatives for previous months of the year to compile the index. The weight for an individual month’s holidays (for example, August holidays) in the overall index reflects the relative expenditure for that month in a 12-month base period.
c. the price for a particular month’s holiday changes only in the month in which the holiday is taken
The index changes as and when people take holidays and to the extent that prices of holidays bought this year have changed from comparable holidays bought a year ago. In months when many people experience a price change, the index shows a larger overall change than in those months when few are affected. For example, the change in the index between July and August depends upon the extent to which August prices this year are higher or lower than the comparable prices last August, and reflects August being a peak holiday month. In the 11 months when the holiday is not taken, the price used in the calculation of the index is the last one to have been observed.
d. the price of a holiday is used when the holiday is taken, not when it is booked or when the final balance is paid.
For example, the price for a holiday to be taken in August 2019 first enters the index in August 2019 rather than in some earlier month when it was booked and any deposit was paid or when the final balance was paid.
e. the price used is that paid by the customer, including any discounts (provided the discount is universally available – see Section 9.2)
Price collection
Prices are mostly taken from tour operators’ websites for a sample of package holidays, both in winter and summer, though some are taken from tour operators’ brochures. As tour operators usually issue revised brochures during the booking season to incorporate any modifications to prices, the most recently available brochures are used to measure holiday prices for the index. The prices used are the cost of a holiday for an adult sharing a double room and a child sharing a room with adults.
These prices are compared against comparable holidays taken 12 months previously, and a price relative is calculated for each one. These are then combined, using information from the International Passenger Survey (IPS) on the composition of groups taking holidays, to give indices by country and month for each tour operator. The resulting indices are weighted together, using information on market shares of the tour operators involved, to give an index for each country in each month. These, in turn, are weighted together using data from the IPS on inclusive tours to individual countries abroad, to give the final index for the month in question.
Separate indices are calculated for apartments and villas, hotels, cruises, city breaks, and coach holidays. Holidays are priced for departure on the first day of every month. If the brochure does not have this option, then the thirty-first day (or earlier) of the previous month is taken as long as the holiday will run over to the first day of the following month.
9.5.7.2 UK holidays
Principles a. to e., in Section 9.5.7.1: Foreign holidays, also apply to UK holidays. To avoid double counting costs already covered in other sections, the index covers only independently booked accommodation and packages. Expenditure on packages may, however, include meals and leisure services to the extent that these components are included in the package. Five relatively homogenous types of holiday are sampled:
weekend and short breaks (up to three nights)
hotel and bed and breakfast accommodation
package holidays such as holiday camps and centres
coach holidays
self-catering holidays and accommodation
A sample of holidays is distributed between these holiday types and between the regions of the UK in line with their relative importance, as measured by the expenditure in each region or group.
Prices come from operators’ brochures and websites or from enquiries to hotels, guest houses, or caravan and camping grounds. They are generally taken for seven-night stays for sharing a double or family room, but there are exceptions:
short-break holidays, where the length of visit is shorter
some types of self-catered accommodation, such as holiday cottages or camping sites, where there is a flat rate irrespective of the number of guests
coach holidays, where a range of tour types is priced
These prices are weighted together using data from the United Kingdom Tourism Survey on holiday types, location and by the month in which they are taken, to provide a final index.
9.5.8 Horse racing admission
From 2003, the cost of admission to a selection of racecourses and special meetings, for example, Royal Ascot, has been included in consumer price statistics. Like holidays, different months’ race meetings are seen as different items, with the programme of events changing from month to month and attendance patterns varying markedly over the year. The basic principles outlined in Section 9.5.7.1: Foreign holidays, for constructing an index for holidays therefore apply in a similar way to horse racing admissions.
Information on admission prices is collected for regular meetings at main racecourses as well as for special events (for example, Royal Ascot and the Grand National). An average price for entry to the racecourses in the sample is calculated for each month and compared to the average price for the corresponding month in the previous year, for example, August 2019 against August 2018. Each month’s index covers admission for all 12 months of the year. For example, the price relative calculated for August is weighted with the price relatives for the previous months of the year to compile the item index.
9.5.9 Car insurance
The car insurance price index is a combination of two separate indices, one for fully comprehensive insurance and the other for third party, fire and theft insurance. Each of these is split further into price indices for specific car insurance companies. Expenditure data is used to weight these indices together and to ensure that a representative sample of insurers is selected. Each index is constructed from actual insurance price quotes provided by a third-party company. These quotes are returned for a database of customer profiles. The customers in question cover a wide range of ages, driving experience, regions and vehicles. The database of profiles is fully rotated every three months, meaning a comparable insurance quote is only collected for three consecutive months for each person in the database. To create a consistent price index, a rolling imputation process is carried out to accommodate new price quotes entering the sample while those over three-months old drop out. The three-month life cycle of a price quote works as follows:
Month 1: Price is recorded but does not feed into the price index.
Month 2: A January base price for the new quote is created by adjusting the Month 1 price by the movement in the elementary aggregate for that item up to the month it was collected. A price relative for that item is then created by comparing the Month 2 price with the imputed base price.
Month 3: A price relative is calculated by comparing the Month 3 price with the imputed base price.
The price relatives are combined using standard elementary aggregation (see Section 3).
9.5.10 Home contents insurance
The home contents insurance index is aggregated using price indices for specific insurance companies. Expenditure data are used to weight these indices together and to ensure that a representative sample of insurers is selected using probability proportional to size (PPS). Each index is constructed from actual insurance price quotes provided by a third-party company. These quotes are returned for a database of customer profiles. The customers in question cover a wide range of regions, the material used for the construction of their house or flat, the number of rooms, the number of occupants and many other attributes. The database of profiles is fully rotated every three months so, in the same way as for car insurance, a rolling process of imputation is carried out to accommodate new price quotes.
Back to table of contents10. Introducing new data sources
10.1 Overview
As part of the transformation of consumer price statistics, we have targeted certain categories that we believe would benefit the most from improved methods and alternative data sources. These data sources allow us to produce more robust, timely and granular inflation statistics. Introduction of these data sources follows a period of research, published in our Research and developments in the transformation of UK consumer price statistics articles. Our initial targeted categories for introduction were rail fares, rents, and second-hand cars, with a future focus on groceries. For further information on our future work plan, please see our Transformation of consumer price statistics articles.
With the introduction of alternative data sources (such as rail fares), we continue using a Lowe-type index for aggregation. We have also introduced the GEKS-Törnqvist multilateral index method for measuring inflation of elementary aggregates for rail fares and second-hand cars. Like other index methods, the GEKS-Törnqvist measures price change of a set of products between a base and reporting month. However, unlike traditional formula, it does this while also incorporating data from other months, allowing us to better account for dynamic behaviours such as products entering and exiting the market.
The method allows us to weight products according to consumer spending, so products that consumers spend more on have a greater influence on the inflation rate for the category. These weights are provided for all months the data source covers and therefore do not come with a time lapse, or lag. For guidance on how the GEKS-Törnqvist will be used, please see our Introducing multilateral index methods into consumer price statistics methodology.
10.2 Rail fares
In 2023, we incorporated new rail fares data sources and methods into our headline consumer price statistics. The rail fares data for Great Britain are provided to us by the Rail Delivery Group and are sourced from the rail industry's Latest Earnings Networked Nationally Overnight (LENNON) ticket revenue system. We receive approximately 60 million rows of data each month, of which we use around 30 million to produce a price index. They are transaction-level scanner data that contain information on the expenditure and quantities of purchased tickets, along with associated metadata related to the journey travelled.
We use this metadata to create unique products to track their price over time and to filter these data down to only the products that are relevant to the general consumer. More detailed data also allow us to publish more granular indices, stratified by fare product group (such as peak, off-peak, advance). For more information on the new methods for rail fares, please see our Using transaction-level rail fares data to transform consumer price statistics, UK article. We also researched the use of outlier detection methods with these new data sources, identifying outliers when product prices more than treble, or reduce by more than two-thirds.
Historical impact analysis shows that the transformation of rail fare indices would not have affected headline Consumer Prices Index including owner occupiers' housing costs (CPIH), Consumer Prices Index (CPI) and Retail Prices Index (RPI). For instance, there were only small impacts (up to 0.1 percentage points) at the transport division level of CPIH and CPI. For more information, please see our Impact analysis on transformation of UK consumer price statistics: rail fares, February 2023 article.
10.3 Rental prices and second-hand cars
In 2024, we incorporated new approaches for measuring private rental prices and second-hand cars into headline consumer price statistics. For rental prices, the data sources remained the same, but the methods have been updated. We changed from using a matched-pairs methodology to a hedonic double imputation methodology. Improving our methodology has enabled us to produce more granular rental price data that are comparable over time. For more information on the new methods for rental prices, please see our Price Index of Private Rents Quality and Methodology Information (QMI).
For second-hand cars, we are using new data sources and methods in our updated measure. The second-hand cars data are provided to us by Auto Trader, the UK's largest digital automotive marketplace. We receive around 450,000 unique car listings each month, of which we use 300,000 to produce a price index. These data are web-provided so no explicit data on sales or revenues are available. Instead, the data include the advertised price and other detailed information about the listed car. For example, the make and model of the car, the condition, and the mileage.
We use these variables in the data to define product identifiers that can be used to track price change over time and to filter these data down to only products that are relevant to a second-hand cars index. By leveraging more intricate data, we are able to publish indices stratified by fuel type, which is currently petrol and diesel cars, with the opportunity to incorporate hybrid and electric in the future. For more information on the new methods for second-hand cars, please see our Using Auto Trader car listings data to transform consumer price statistics, UK article and the update to the methodology.
Historical impact analysis shows that the transformation of second-hand cars and rental indices had a small impact. The average indicative impact to the annual rate of change was 0.2 percentage points for CPIH, less than 0.1 percentage points for CPI, and neutral for RPI (0.01 percentage points from unrounded calculations). For more information, please see our Impact analysis on transformation of UK consumer price statistics: private rents and second-hand cars article.
Back to table of contents11. Publication and usage
11.1 Availability
Following an independent review and subsequent public consultation, the then National Statistician published a statement setting out plans for consumer inflation statistics in the UK, to ensure that they meet current and emerging user needs. Since then, we have continued to develop our most comprehensive measure of consumer price inflation, the Consumer Prices Index including owner occupiers’ housing costs (CPIH), which became our lead measure of inflation in March 2017. In addition, the publication of Retail Prices Index (RPI)-related data was scaled back, limited to the information required for critical needs of existing users to be met. Further detail can be found in Clarification of publication arrangements for the RPI and related indices.
The CPIH, Consumer Prices Index (CPI), RPI and associated data are first issued in a publication called the consumer price inflation statistical bulletin at 9.30am, usually on the second or third Wednesday in the month immediately following the month to which the data refers. At the same time, accompanying briefing notes are published giving more detail about the factors contributing to changes in the percentage change over 12 months for the headline indices. The data are published simultaneously on our website. More detailed data can also be found on our website by downloading the data associated with the latest release as an Excel file or via the time series data function. The latest data are available for download at the same time as the statistical bulletin. The lower-level price quote and associated metadata underpinning the production of consumer price statistics are also available for download from our website.
11.1.1 Revisions
The Consumer Prices Index including owner occupiers' housing costs (CPIH) and the Consumer Prices Index (CPI) are revisable, although this would only occur in exceptional circumstances. The CPI has not been revised since its introduction in 1996, except when the index was referenced in 2006 and in 2016. It is usual practice not to revise these figures when methodological improvements are introduced, although the CPIH has been revised twice since its launch in 2013. The first revision was on 24 March 2015, which incorporated improvements to the measurement of owner occupiers’ housing costs (OOH). The second was on 21 March 2017, incorporating council tax and revised weights for OOH. In both cases, the full back series (to 2005) was revised. From this point, we do not expect to make further revisions. Once the Retail Prices Index (RPI) are published, they are never revised.
Users would be alerted to any revisions to the CPIH or CPI through the consumer price inflation statistical bulletin.
11.1.2 Pre-release arrangements
On 15 June 2017, the then National Statistician announced that pre-release access to Office for National Statistics (ONS) publications would stop with effect from 1 July 2017, except under exceptional circumstances.
Exceptional circumstances are where someone would need to act or make a decision in the public interest based on the statistics. Not granting pre-release in such a case runs the risk of decisions being made based on out of date information. Exceptional pre-release access has been granted to the Bank of England’s Monetary Policy Committee (MPC), and the dates on which this is set to occur are published as an exchange of letters between ourselves and the Bank of England.
11.1.3 Choice of publication date
The consumer price inflation statistical bulletin is published as early as practicable, four or five weeks after Index Day, usually on the second or third Wednesday of the month. In practice, this means publication generally falls between the 13th and 21st of the month. The dates of publication are announced in advance on our release calendar. During each summer, the final dates for the following calendar year and provisional dates for the year after that are released.
11.2 Percentage change between any two months
Once a chain-linked index is produced, it can be used to calculate changes between any two months. For example, the all-items Consumer Prices Index including owner occupiers’ housing costs (CPIH) for April 2015 is 99.9 and that for August 2017 is 104.0 so the change between these months is:
Note that the reference period in both the CPIH and Consumer Prices Index (CPI) is 2015 = 100.
The definitive level is quoted as a level relative to the reference period; for instance, the CPIH for January 2019 is 106.4. However, for users’ convenience, the result is also expressed as the percentage change on the figure 12 months earlier, which is commonly known as the annual inflation rate. The CPIH level for January 2018 is 104.5, so the annual inflation rate in January 2019 was 1.8%.
In the Retail Prices Index (RPI), the reference period (month) is January 1987. The computation of the changes between any two months after the reference period is applied in the same way as is applied to the all-items CPIH in the previous example. However, for months before January 1987, the time period is split at January 1987. The series based on January 1974 is used up to January 1987, and then the series based on January 1987 is used for the remainder of the period. The long-run series is also referenced completely on January 1974. This is not used in the official RPI but is used for creating quick estimates. The indices for July 1986 and January 1987 based on January 1974 are 384.7 and 394.5 respectively; the index for July 1987 based on January 1987 is 101.8. Thus, the change from July 1986 to July 1987 is:
For the months before January 1974, the series based on January 1962 is also needed. For example, the indices for July 1968 and January 1974 based on January 1962 are 125.5 and 191.8 respectively; that for January 1987 based on January 1974 is 394.5; the index for July 1987 based on January 1987 is 101.8. Thus, the change from July 1968 to July 1987 is:
In the CPIH and CPI, percentage changes are calculated from the unrounded indices and are then rounded to one decimal place. However, the RPI is calculated from published rounded indices (see Section 11.4: Rounding policy and the effects of rounding for more detail).
11.3 Annual and quarterly averages
The annual average is defined as the arithmetic mean of the 12-monthly values for the year in question. Quarterly indices (for example Quarter 1, January to March) are defined similarly. Since the indices are always calculated so that a period (currently the year 2015 in the Consumer Prices Index including owner occupiers’ housing costs (CPIH) and Consumer Prices Index (CPI)) equals 100, there will not usually be any other year or quarter with an average index of exactly 100.
The CPIH and CPI calculations are performed at maximum precision throughout; therefore, the quarterly and annual average indices are calculated from unrounded monthly indices with changes over 12 months in the quarterly and annual average indices being calculated from the corresponding unrounded quarterly and annual average indices. The approach adopted in the UK differs from that used in other European countries for each country’s Harmonised Index of Consumer Prices (HICP) where:
annual and quarterly average indices are calculated from the published rounded indices
the 12-month rates for the annual and quarterly indices are calculated from the unrounded averages of the rounded monthly indices
For consumer price inflation statistics, the annual average inflation rate is the change in the annual average index from the year before. For example, for the all-items CPIH for 2017, we have the annual average = 103.6, and the annual average for 2016 = 101.0, so the percentage change is:
In general, this will not equal the average of the percentage changes for January to December but, in practice, the difference will be small. Either average figure will usually be closer to the change between the middle of the year before and the middle of that year than to the change between the start and end of that year. Note that the Retail Prices Index (RPI) uses a slightly different approach for calculating quarterly and annual average inflation rates (see Weights).
To calculate an annual average inflation rate over any period other than a year, the following equation should be used:
where:
I2 = CPI or other index in later month/year
I1 = CPI or other index in earlier month/year
n = number of months in the period in question
It should be noted that this may produce misleading results for just one- or two-months’ change in the index. One reason is that the month-to-month change includes a seasonal component. Another is that some prices change only infrequently, perhaps only once a year. Hence, a comparison between different years’ annual average indices, or at least between the same month in different years, is preferred.
11.4 Rounding policy and the effects of rounding
All derived statistics (annual and quarterly average indices, 1- and 12-month percentage changes) are published rounded to one decimal place. Very occasionally, because of the degree of precision to which decimal fractions are stored electronically, a derived statistic ending with the digit 5 may be rounded downwards. For the main Consumer Prices Index including owner occupiers’ housing costs (CPIH), Consumer Prices Index (CPI) and Retail Prices Index (RPI) monthly indices, the percentage changes are manually checked and, where necessary, rounded up if the calculated figure is exactly at the rounding point. Because of practical constraints, other derived statistics are not manually overridden in the same way.
The CPIH, CPI and RPI differ in the way in which the derived statistics are calculated. The CPIH and CPI follow the standard approach, which is to calculate derived statistics from unrounded monthly indices, while the RPI calculations are based on the published rounded indices.
The CPIH and CPI approaches limit the impact of rounding effects and ensure that re-referencing will not in future lead to revisions to 1- and 12-month percentage changes. However, it means that the derived statistics cannot always be calculated from the published headline indices. To address this, the CPIH and CPI indices rounded to three decimal places are published in the consumer prices data tables.
The RPI approach is transparent in that all derived statistics can be traced back to the published monthly index levels. However, when publishing rounded indices to one decimal place, and then calculating percentage changes from these rounded indices, which are then themselves rounded to one decimal place, some extreme rounding effects can occur. See Section 12.7: Publication for an example illustrating rounding effects in the RPI.
11.5 How to use the CPIH, CPI and RPI
Measuring changing prices and costs for consumers and households provides an overview of how the range of consumer price statistics is designed to meet user needs.
Users should be aware that, in accordance with the Statistics and Registration Service Act 2007, the Retail Prices Index (RPI) and its derivatives have been assessed against the Code of Practice for Official Statistics in early 2013 and found not to meet the required standard for designation as National Statistics. A full report can be found on the UK Statistics Authority website (Assessment of compliance with the Code of Practice for Official Statistics: The Retail Prices Index, Assessment Report 246, March 2013). As confirmed in a statement by the former National Statistician in March 2016, we strongly discourage the use of the RPI. An article published in March 2018 summarises the shortcomings of the RPI.
The decision to employ an indexation mechanism, as well as the choice of the most suitable index, is up to the individual or party. When drafting the terms of an indexation provision for use in a contract to adjust future payments, both legal and statistical questions can arise. We cannot help in relation to legal questions; we cannot draft specific wording for contracts nor mediate interpretative or other legal disputes that may arise between the parties to an agreement. On statistical questions, we can provide assistance, and certain general guidance is set out in the following paragraphs. However, this assistance and guidance is provided without acceptance of any responsibility. As stated at the start of this manual, users should form their own independent assessment in relation to the consumer price inflation measures and their use in specific cases and should seek such professional advice as they consider appropriate. Users are advised to take account of the relative levels of accuracy of the relevant indices.
11.5.1 General guidance
The section provides general guidelines to consider when drafting a clause using the Consumer Prices Index including owner occupiers’ housing costs (CPIH), Consumer Prices Index (CPI) or Retail Prices Index (RPI).
Define clearly the payment (rent; wage rate; maintenance; child support; or other value) that is subject to review in line with prices. Identify the precise index (CPIH, CPI or RPI) or component that will be used to adjust the base payment. This should include the full series title (for example, all-items CPI as published by the Office for National Statistics, ONS) and index base period (for example, 2015 = 100). Specify clearly a reference period from which changes in the CPIH, CPI or RPI will be measured. This is usually a single month or an annual average. There is a lag of about two weeks from the end of the reference month to the date when data for that reference month are published.
If you decide to use the CPIH or CPI, then note that, unlike the RPI, these are revisable indices and that CPIH and CPI rates of change are calculated from unrounded indices. Hence, in specifying the CPIH or CPI rate of change, you must specify not only the reference period over which the change is measured, but also the date on which that CPIH or CPI was published. You must also specify whether the index to be used is the published index rounded to one decimal place or the unrounded index.
State the frequency of adjustment. Adjustments are usually made at fixed time intervals such as monthly, quarterly or, most often, annually. Determine the formula for the adjustment calculation. Usually, the change in payments is directly proportional to the percentage change in the index between the two specified periods. Consider whether to have a “cap”, which places an upper limit to the increase in things like wages and rents, or a “floor”, which promises a minimum increase regardless of the percentage change (up or down) in the index. Provide a built-in method for handling situations that may arise because of major revisions to the structure of indices or changes in the index reference period.
Adjustment clauses usually involve changing the base period payment by the percentage change in the level of a price index between the base period and a subsequent time period. This is calculated by first determining the change between the two periods and then the percentage change. This example illustrates the computation of the percentage change:
| CPIH for current period (t) | 136.0 |
|---|---|
| CPIH for previous period (t-1) | 129.9 |
| First figure (t) less second figure (t-1) equals change | 136.0 - 129.9 = 6.1 |
| Divided by previous period CPIH (t-1) equals result | 6.1/129.9 = 0.047 |
| Multiplied by 100 equals the percentage change | 0.047 x 100 = 4.7% |
Download this table Table 6: Example computation of the percentage change
.xls .csvIt is acceptable to refer to the “Consumer Prices Index including owner occupiers’ housing costs” or “CPIH”, but users may consider it better to clarify it by referring to the “all-items CPIH” and perhaps stating “... or any future government index that shall replace that index and shall provide a measure of the general increase in consumer prices”.
Referring to a component of the price index is riskier as the sub-division components vary over time. Perhaps reference should be made to a suitable alternative if the definition changes (for example, refer to the all-items index if the component level is no longer published). Users should refer to the fact that the indices in question will still be used even if calculated differently, on a different basis, or using different components.
If reference is made to the annual percentage change in an index, ensure that the number of decimal places to be used in the calculation is mentioned (preferably one decimal place). It is better to refer to the annual percentage change as published rather than attempt a calculation oneself.
Refer to which months’ or years’ values of the index will be used, if possible. Referring simply to the latest available index may cause problems. For instance, if the uprating is due on 15 January, the latest available CPIH may in some years be the December CPIH but in other years it may be the November CPIH. This is because of the publication schedule. This could affect the number of months to be used in the uprating calculation.
Reference should be made to the possibility that the Office for National Statistics (ONS) may change its name at some point in the future, or consumer price inflation measures may even be published by another government department. The words “ONS or any successor government department” may be used.
Finally, reference should be made to cover the event of re-basing of the measures of consumer price inflation. The following form of words may be useful as a starting point:
“The all-items Consumer Prices Index including owner occupiers’ housing costs (CPIH) is expressed in terms of a comparison of prices relative to a reference date, currently the year 2015. To uprate an amount of money in line with the movement in the CPIH, multiply it by the published index at the later date in question and then divide it by the index at the earlier date in question.”
11.6 How to construct aggregates
For the Consumer Prices Index including owner occupiers’ housing costs (CPIH) and Consumer Prices Index (CPI), the indices for Classification of Individual Consumption According to Purpose (COICOP) divisions, groups and classes can be combined to suit users’ requirements where the standard aggregates are not appropriate. In all cases, the weights relate only to the applicable year, not to the whole period since the reference date (2015 = 100). The aggregate indices must therefore be calculated one year at a time, as follows:
a. For each component, unchain the index for the current month as follows:
- i. For January, divide the January index by the previous December index and multiply by 100. This step is needed since both the CPIH and CPI are chain-linked twice each year.
- ii. For February to December, divide the current month’s index by the current year’s January index and multiply by 100.
b. Calculate a weighted average of these indices, using the weights relating to the current year. Note that, from 2017, there are a separate set of weights used for January and for February to December.
c. To convert the aggregates back to the standard reference base (currently 2015 = 100):
- i. The January 2015 index is set to equal 100.
- ii. The individual monthly indices between January and December 2015 are then divided by the average of the indices for 2015 and multiplied by 100 to provide an index for each month on the required base, 2015 = 100.
d. Forward indices are then calculated from January 2016 as the inverse of the calculation set out in 11.6.a. above.
If chained aggregates prior to January 2015 on the standard reference base (2015 = 100) are required, then they can be calculated in retrospect once the January 2015 index has been calculated:
a. for December 2014 as 100 divided by the unchained aggregate for January 2015 multiplied by the chained aggregate for January 2015
b. for February to November 2014 as the current month’s unchained index divided by the unchained aggregate for December 2014 multiplied by the chained aggregate for December 2014
c. for January 2014 as 100 divided by the unchained aggregate for February 2014 multiplied by the chained aggregate for February 2014
d. for as many years (say, N) as are necessary to get back to the official start of the CPI (January 1996) or CPIH (January 2005)
11.7 Contributions to changes in the all-items index
It is often of interest to estimate the effect of the component Classification of Individual Consumption According to Purpose (COICOP) categories on the change in the all-items Consumer Prices Index including owner occupiers’ housing costs (CPIH) or Consumer Prices Index (CPI). The contribution of a component to a change in the all-items index over a given period of time is defined as the change that would have occurred in the all-items index if that component had undergone its observed change but all other component indices had remained frozen at their values at the start of the period (and all weights are kept the same). The effect of each component depends on both the magnitude of its change and its weight.
Note that in 2017, a change was made to the CPIH and CPI to introduce an additional set of weights in February for use in the construction of February to December’s index (see Section 3). For this reason, the formula for the contribution to the change in the annual rate are split into two parts; one for use prior to 2017 and another for use after 2017.
The formula for calculating the contribution of a component to the monthly change in the CPI is given here:
where:
Iti = index for component i (base previous January = 100) month t
Iit-1 = index for component i (base previous January = 100) in month t-1
a = all items CPI
wti = weight (parts per 1000) of component i in all items CPI in month t
As the definitions of the variables here make clear, it is important that these calculations are performed using unchained indices (that is, based on previous January = 100 or, for the January index, based on previous December = 100 for the CPIH or CPI). The formula for the contribution of components to the monthly change in the Retail Prices Index (RPI) is the same as for CPI. However, the formula for the contribution to the change in the annual rate is different, reflecting the fact that the CPIH and CPI are chain-linked twice every year (see Section 3.5: Aggregation). The contributions calculation for the years prior to February 2017 can be found in the Consumer Price Indices Technical Manual (2014 Edition) (PDF, 802KB).
The calculation for contributions to the annual change in the all-items CPIH and CPI used from February 2017 is the same as the methods applied before this period except that weights are updated twice each year for COICOP-level indices: in January and then again in February.
where:
CX = COICOP level
WCXmonthyear = COICOP x level weights (pts/1000) and the month and year of the weights that should be applied
I = Month and year of index being used | Month and year of the base period for this index
A = All-items level
It is important that the calculations are performed using unchained indices (that is, based on previous January = 100 or, for the January index, based on previous December = 100). For the month of interest, the contribution of each component to the 12-month rate is calculated. The same is done for the preceding month. The differences between the two are the contributions to the change in the CPIH or CPI 12-month rate, which are published in the consumer price inflation statistical bulletin and the accompanying briefing notes.
11.7.1 Example calculation
Using the previous formula, the contribution for food and non-alcoholic beverages to the Consumer Prices Index including owner occupiers’ housing costs (CPIH) all-items annual rate for March 2017 can be calculated based on this example. The published (chained) index values, based on 2015 = 100, for food and non-alcoholic beverages and the all-items CPIH are as follows:
| Published (chained) index (2015 = 100) | |||||
|---|---|---|---|---|---|
| Jan-16 | Mar-16 | Dec-16 | Jan-17 | Mar-17 | |
| Food and non-alcoholic beverages | 98.7 | 98.1 | 97.9 | 98.2 | 99.3 |
| All items | 99.9 | 100.4 | 102.2 | 101.8 | 102.7 |
Download this table Table 7: Chained index values for food and non-alcoholic beverages and all-items CPIH
.xls .csvTo work out the contribution of food and non-alcoholic beverages to the all-items CPIH 12-month rate for March 2017, it is necessary to unchain the indices so that they are based on the most recent January or, in the case of the January indices, on the previous December. This is done by dividing the current month’s index by the previous January’s (or December’s) figure. For instance, the food and non-alcoholic beverages index for December 2016 (the first link month) is calculated as:
Performing this calculation for each of the dates gives the following set of unchained index values:
| Published (unchained) index (2015 = 100) | |||||
|---|---|---|---|---|---|
| Jan-16 | Mar-16 | Dec-16 | Jan-17 | Mar-17 | |
| Food and non-alcoholic beverages | 100 | 99.4 | 99.2 | 100.3 | 101.2 |
| All items | 100 | 100.5 | 102.3 | 99.6 | 100.9 |
Download this table Table 8: Unchained index values for food and non-alcoholic beverages and all-items CPIH
.xls .csvThe contribution of food and non-alcoholic beverages to the 12-month rate for March 2017 can then be calculated as follows, given that the weights for food and non-alcoholic beverages are 83 parts per thousand in February to December 2016 and 81 parts per thousand in January and February to December 2017:
Thus, food and non-alcoholic beverages contributed 0.1 percentage points to the all-items Consumer Prices Index (CPI) 12-month rate in March 2017.
Back to table of contents12. Retail Prices Index
12.1 Overview
The Retail Prices Index (RPI) is the most long-standing measure of inflation in the UK, but it is not a National Statistic. It is a legacy measure that is required to meet existing user needs and is currently used for long-term indexation and for index-linked gilts and bonds. In the past, it has been used for a variety of other purposes, including:
the government’s inflation target
uprating tax allowances
state benefits
pensions
deflating consumer expenditure in the national accounts
The RPI was assessed against the Code of Practice for Official Statistics in early 2013 and the UK Statistics Authority cancelled its designation as a National Statistic because:
the methods used to produce the RPI are not consistent with internationally recognised best practices
the decision to freeze the methods used to produce the RPI and only to contemplate “routine” changes was inconsistent with the requirement in the Code to seek to achieve continuous improvement
The RPI also has other known weaknesses as a measure of consumer price inflation, including its population coverage that excludes certain households. The 2015 Johnson Review on Consumer Price Statistics described these deficiencies and the National Statistician’s letter in March 2016 strongly discouraged its use. The article Shortcomings of the Retail Prices Index as a measure of inflation summarises the main flaws of the RPI.
The following section describes the RPI and makes a number of comparisons to the Consumer Prices Index including owner occupiers’ housing costs (CPIH) and the Consumer Prices Index (CPI). The majority of the differences between the RPI and the CPIH also apply to the CPI. The exception is owner occupiers’ housing costs (OOH) and council tax, which are included in both the RPI and the CPIH (although the methods used to measure OOH differs between the indices), but not CPI.
12.1.1 History of the Retail Prices Index
Although there were occasional official comparisons of prices for food in the late 19th century and early 20th century, the government first began a systematic, continuous check on the increase in the cost of living in 1914. This “cost of living index” was produced throughout the 1920s and 1930s. In 1946, a Cost of Living Advisory Committee was set up. This Committee recommended fundamental changes in the selection and number of representative items for which prices should be collected, as well as the removal of the name “cost of living index” and the associations it implied. The resulting index, the Interim Index of Retail Prices, began being produced in June 1947 and continued, with some minor modifications, to 1956. By 1955, sufficient information became available to underpin a new index and this became the first official Retail Prices Index (RPI), beginning in January 1956. Various minor changes were made to the RPI through the 1960s and 1970s and in the early 1980s, an advisory committee was convened to review the RPI. During the 1990s, two new indices based on the same data that are collected for the RPI were also introduced: RPIY (RPI excluding mortgage interest payments and indirect taxes) and the Harmonised Index of Consumer Prices (HICP). The historical background to the development of the index can be found in Appendix 1.
12.1.2 Basic principles
The Retail Prices Index (RPI), like the Consumer Prices Index including owner occupiers’ housing costs (CPIH) and the Consumer Prices Index (CPI), measures inflation with reference to the changing cost of a fixed basket of goods and services. In most areas, the RPI is calculated from the same basic price data as the CPIH and uses similar methodology both in compiling and aggregating the component price indices. However, it does differ from the CPIH in some specific respects and, in some cases, these differences can have an important influence on the measured rate of inflation. The differences, including the coverage and classification of goods and services, the population basis for the weights, and the mathematical formula used to aggregate the prices at the most basic level, are considered in the sections that follow.
12.1.3 Reference period
The published Retail Prices Index (RPI), and its components, express price levels at a given point in time as a percentage of the level at some previous date, known as the reference period. The level at the reference period is 100. A change in reference period has no effect, other than due to rounding, on the percentage movement between any pair of months but is merely a re-scaling of the whole series up or down by a constant factor. For the RPI, unlike many other statistical series, the reference period has no connection with the “weighting base date”.
The RPI uses a single collection point in time, a January, for the reference period. It is possible to use, say, an annual average as a reference period. The RPI Advisory Committee reviewed this issue and decided to keep the reference period as a single month in its 1986 report, partly because it makes the chain-linking calculation far more straightforward for compilers.
Since 1947, the reference period for the RPI has changed five times (in January 1952, January 1956, January 1962, January 1974 and January 1987), on each occasion following the recommendations of the RPI Advisory Committee (see Appendix 1 for more information on the Committee). The main argument against changing the reference period is that users prefer to have a continuous series for as long as possible; re-referencing causes them inconvenience. The main argument for re-referencing is that some users find that index numbers much in excess of 100 are more difficult to use, particularly if they are not accustomed to concentrating on changes in percentage terms rather than in index levels. Further, very high index levels can lead to misleading impressions among users of the precision of the RPI. The RPI can only be regarded as accurate to about one-tenth of 1%. The difference between 400.0 and 400.1 is only a quarter of this, so it would not be meaningful.
12.2 Index coverage and classification
The Retail Prices Index (RPI) scope, and its associated classification system comprising groups and sections, was specified and developed by earlier RPI Advisory Committees. The coverage and classification of the Consumer Prices Index including owner occupiers’ housing costs (CPIH) indices are based on the international classification system for household consumption expenditures known as the Classification of Individual Consumption According to Purpose (COICOP); for more information, please see Section 3.2: Structure of UK consumer price indices. The RPI classification system comprises:
broad groups (for example, food and catering)
groups (for example, food)
sections (for example, bread)
Table 9 provides a summary of the broad relationship between the RPI groups and the Classification of Individual Consumption According to Purpose (COICOP) divisions.
| COICOP Divisions | RPI Groups |
|---|---|
| 01 Food and non-alcoholic beverages | Food |
| 02 Alcohol and tobacco | Alcoholic drink (off sales) Tobacco |
| 03 Clothing and footwear | Clothing and footwear |
| 04 Housing and household services | Housing (exc mortgage interest payments, owner occupiers' housing costs (OOH) payments, depreciation, council tax, ground rent and building insurance) Fuel and light |
| 05 Furniture and household goods | Household goods Domestic services |
| 06 Health | Personal goods and services (health-related items) |
| 07 Transport | Motoring expenditure Fares and other travel costs |
| 08 Communication | Household services (exc. domestic services and fees and subscriptions) |
| 09 Recreation and culture | Leisure goods Leisure services |
| 10 Education | Fees and subscriptions (education-related items) |
| 11 Restaurants and hotels | Catering Alcoholic drink (on sales) |
| 12 Miscellaneous goods and services | Personal goods and services (non health-related items) Fees and subscriptions (non education-related items) |
Download this table Table 9: Broad relationship between COICOP divisions and RPI groups
.xls .csvWhile the vast majority of goods and services that are priced are included in the RPI, CPIH and Consumer Prices Index (CPI), there are a small number of important differences in scope. A summary table of the indices in Appendix 2 describes the main characteristics of each index.
The main differences are in the area of housing costs. In particular, unlike the CPI, the RPI and CPIH include council tax and owner occupiers’ housing costs, though their approach used to measure OOH is different.
Some items in the CPIH and CPI are collected over several weeks. Prices for petrol and oil can exhibit particularly volatile price movements. For the CPIH and CPI, these prices are collected on a weekly basis (every Monday), and then are averaged over the month to create a price. The RPI, in comparison, only uses one price point taken on a specific collection date. Fruit and vegetables also exhibit volatile price movements and so from February 2018, the measurement of fruit and vegetable prices in the CPIH and CPI baskets was improved by including additional price quotes collected on the Friday preceding index day.
Conversely, there are a small number of representative items that are excluded from the RPI but included in the CPIH and CPI because they represent expenditure by people who are not covered by the RPI weights. This includes high-income private households, residents of institutional households and foreign visitors. In practice, the number of these items is small, currently including:
university accommodation fees
foreign students’ university tuition fees
unit trust and stockbrokers’ charges
foreign exchange commission on the purchase of sterling by overseas visitors
12.3 Elementary aggregate formula
One of the key differences between the Retail Prices Index (RPI) and the Consumer Prices Index including owner occupiers’ housing costs (CPIH) and the Consumer Prices Index (CPI) is the formula used for the calculation of elementary aggregate indices. The RPI uses arithmetic means: the average of price relatives (Carli) and ratio of average prices (Dutot). The CPIH and CPI mainly use the geometric mean (Jevons) instead, although Dutot is also used in part. In line with international best practice, we consider the use of Carli to be inappropriate, as discussed in Section 3.4: Elementary aggregates.
The divergence between the RPI and CPIH caused by their differing approaches to elementary aggregation is referred to as the formula effect. Between February 2006, when the official CPIH annual growth rate series begins, and December 2018, the formula effect (that is, the effect of using Jevons for elementary aggregation in the CPIH, rather than arithmetic means) has contributed at least 0.3 percentage points, and on average about 0.6 percentage points, to the difference between the CPIH and RPI 12-month rates of change. In other words, the CPIH annual rate would typically have been about 0.6 percentage points higher if the elementary aggregates had been using arithmetic means as in the RPI. In December 2009, the formula effect contributed 0.4 percentage points to the difference between the CPIH and RPI annual inflation rates; by December 2010, the formula effect contributed 0.7 percentage points. This increased impact between 2009 and 2010 was driven by changes to collection practises within the clothing and footwear division. The clothing and footwear division is the largest contributor to the absolute impact of the formula effect.
12.4 Aggregation and chain-linking
The Retail Prices Index (RPI) is an annually chain-linked index: each year a separate index based on the most recent January = 100 is produced, and each year’s indices are then chained together once a year as the weights are updated at the same time as new items are introduced each February, to produce an index covering several years. This is in contrast to the Consumer Prices Index including owner occupiers’ housing costs (CPIH) and Consumer Prices Index (CPI), which must be chain-linked twice every year (see Section 3.6: Chaining).
12.4.1 Aggregation
Indices for higher levels (based on the previous January) are weighted averages of the elementary aggregate indices. If the kth representative item is stratified by region or shop type into strata in set K, the elementary aggregate indices for the strata in month t are Ii,t and the stratum weights are wi, the item index for item k for month t is:
The same formula is used with item weights to generate section indices from item indices and with section weights to generate the all items index from section indices. This aggregation is done with indices based on previous January = 100, before they are chained as described in the following. (In practice, sections are aggregated into groups, groups into broad groups, and then these into the all-items index.)
12.4.2 Chain-linking
To produce the 1987-based indices, the indices are chained together each January starting from 1987. Thus, for May 1988 we have:
For May 1989 we have:
and so on.
Item and elementary aggregate indices are not chained, because many items in the Retail Prices Index (RPI) basket change each year.
Unlike a within-year index, a chain-linked index spanning more than one year cannot be represented either as the ratio of the price of a basket in the current month to that in the base month or as the weighted average of price relatives, as the weights are not constant and even the list of items in the basket is not fixed.
It is necessary to chain the RPI every year because the weights and samples change. It is possible to chain an index every month rather than just every January. For Dutot indices, provided that the weights and item list remained fixed, this would yield the same results. However, for the Carli index, the result would usually be that the index would grow more rapidly than it should, a phenomenon known as “price bounce”.
12.5 Treatment of owner occupiers’ housing costs
The Retail Prices Index (RPI), like the Consumer Prices Index including owner occupiers’ housing costs (CPIH), includes owner occupiers’ housing costs (OOH). However, the RPI uses a variant of the user cost approach, which omits opportunity cost and capital gains, to measure OOH. The CPIH also measures user costs, but instead uses a rental equivalence approach (Section 4).
The RPI approach is sometimes also described as following a pseudo-payments approach because of the similarities with the payments approach. Nonetheless, there are a number of differences between the RPI measure and the payments approach, such as the RPI including a proxy for the depreciation cost of the property rather than directly accounting for major repairs and maintenance.
In the CPIH, the preferred method for measuring OOH is the rental equivalence method because the exclusion of asset prices makes it more appropriate as a measure of consumption. The underlying data are of good quality and allow the measure to be reliably estimated. This is widely used internationally.
The housing component of RPI includes:
council tax and rates
depreciation
DIY materials
dwelling insurance and ground rent
mortgage interest payments
repairs and maintenance charges
water and other charges
The following sections describe the approach currently adopted for mortgage interest payments, depreciation, council tax and estate agents’ fees that are part of the household services component.
12.5.1 Mortgage interest payments (MIPs)
Both the weight and price changes for mortgage interest payments (MIPs) are modelled in the Retail Prices Index (RPI). This model is designed to estimate the interest payment due on a standard dwelling for an average index household over time. A range of assumptions and parameters are employed, meaning that the calculation can appear complex in practice. However, the underlying approach may be summarised as follows.
Consistent with the fixed-basket approach adopted throughout the RPI, average payments are calculated each month with respect to a fixed stock of new and existing mortgages (of various ages) equivalent to those existing in the January base period. In calculating the index in subsequent periods, it is important that the base period stock of mortgages of various vintages is uprated according to changes in house prices. For example, a new mortgage taken in February will in most years be higher than the equivalent new mortgage taken in the January base period, reflecting the monthly increase in house prices. Similarly, in February the value of a mortgage taken, say, 24 months earlier will on average be higher than the equivalent two-year-old mortgage in January to the extent that house prices rose between the two months two years ago.
Interest payments on this basket of revalued base mortgages may then be calculated with reference to current-period mortgage interest rates. It follows that current mortgage rates and movements in house prices over time are the main determinants of the MIPs component of the RPI.
Table 10 provides a stylised example of the monthly calculation underpinning the MIPs index.
| Average house price (£) | Proportion of repayment mortgages | Proportion of endowment mortgages | Proportion of debt outstanding for repayment mortgages | Proportion of mortgager households | Current debt for repayment mortgages (£) | Current debt for endowment mortgages (£) | Current total debt (£) | Debt per household (£) | |
|---|---|---|---|---|---|---|---|---|---|
| Column reference | a | b | c | d | e | f | g | h | i |
| Current month | 141,553 | 0.75 | 0.25 | 1 | 0.0074 | 58,391 | 19,464 | 77,84 | 576.12 |
| 1 month ago | 143,37 | 0.75 | 0.25 | 0.9981 | 0.0074 | 59,022 | 19,712 | 78,74 | 582.63 |
| 2 months ago | 141,76 | 0.75 | 0.25 | 0.9962 | 0.0073 | 58,256 | 19,493 | 77,79 | 567.57 |
| 3 months ago | 142,86 | 0.75 | 0.25 | 0.9943 | 0.0073 | 58,605 | 19,647 | 78,21 | 571.23 |
| 4 months ago | 140,322 | 0.75 | 0.25 | 0.9924 | 0.0072 | 57,443 | 19,294 | 76,77 | 552.51 |
| 5 months ago | 142,267 | 0.75 | 0.25 | 0.9904 | 0.0072 | 58,122 | 19,562 | 77,63 | 559.32 |
| 6 months ago | 138,554 | 0.75 | 0.25 | 0.9885 | 0.0071 | 56,496 | 19,051 | 75,57 | 536.39 |
| 7 months ago | 135,756 | 0.75 | 0.25 | 0.9866 | 0.0071 | 55,249 | 18,666 | 73,95 | 524.8 |
| 8 months ago | 132,692 | 0.75 | 0.25 | 0.9847 | 0.007 | 53,898 | 18,245 | 72,13 | 505 |
| 9 months ago | 131,101 | 0.75 | 0.25 | 0.9828 | 0.007 | 53,149 | 18,026 | 71,15 | 498.23 |
| 10 months ago | 130,152 | 0.75 | 0.25 | 0.9809 | 0.007 | 52,662 | 17,896 | 70,58 | 493.91 |
| 11 months ago | 127,913 | 0.75 | 0.25 | 0.979 | 0.0069 | 51,656 | 17,588 | 69,24 | 477.78 |
| 12 months ago | 128,796 | 0.75 | 0.25 | 0.9771 | 0.0069 | 51,912 | 17,709 | 69,61 | 480.39 |
| … | … | … | … | … | … | … | … | … | … |
| 273 months ago | 25,735 | 0.75 | 0.25 | 0.024 | 0.0012 | 255 | 3,539 | 3,794 | 4.55 |
| 274 months ago | 25,555 | 0.75 | 0.25 | 0.0159 | 0.0012 | 168 | 3,514 | 3,682 | 4.42 |
| 275 months ago | 25,376 | 0.75 | 0.25 | 0.0079 | 0.0012 | 83 | 3,489 | 3,572 | 4.29 |
| Sum over 276 month period | 1 | £40,000.00 | |||||||
| x 76% for those owner-occupiers under 23 years (revised annually) | £30,400.00 | ||||||||
| x 73% for those under 23 year owner occupiers with mortgage | £22,192.00 | ||||||||
| x 72% for those index households which are owner occupiers | £15,978.24 | ||||||||
| x average mortgage interest rate (5%) | £798.91 | ||||||||
| = average payment per index household (£ week) | £15.32 | ||||||||
Download this table Table 10: Example of monthly calculation of MIPs in the RPI
.xls .csvThe calculation begins with the average price of new and existing dwellings (column a) bought on mortgages in each month over a finite history (currently 23 years). The average house price is weighted to reflect a constant mix of house types across the UK, as described later. For each month in the 23-year calculation, house prices are then multiplied by the proportion of the purchase price that is borrowed to finance house purchase, fixed at 55% for houses.
The resulting time series for the value of the average mortgage advance is then used to calculate two separate current debt series, one for repayment mortgages and another for endowment-type mortgages. For repayment mortgages, debt is first multiplied by the current proportion of capital outstanding on a standard 23-year repayment mortgage started t months earlier (derived from a standard annuity calculation in which the initial debt is amortised over 23 years assuming a fixed interest rate throughout – column d). Debt outstanding on an endowment-type mortgage, by contrast, does not decline over time. The two series are weighted by the proportions of households holding repayment and endowment-type mortgages (columns b and c).
The resulting series (columns f and g) are summed to give average current debt outstanding on mortgages of 276 different vintages, weighted by mortgage type (column i). Multiplying by the proportion of index households holding mortgages of each vintage (column e – proxied by the living costs and food survey (LCF) data showing the length of time owner-occupying index households have lived at their present address) and summing across all months yields the average mortgage debt currently outstanding per owner-occupying index household with a new or existing mortgage.
This average debt figure is then scaled down to give an average over all index households, including outright owners and tenants. The scaling factors, derived from the LCF, are:
the proportion of all index households who are owner occupiers
the proportion of all index households who have been at the same address for less than 23 years
the proportion with mortgages
(All other types of index household will have, or are assumed to have, zero mortgage debt in the model.)
The resulting figure is multiplied by current-period mortgage interest rates in deriving average weekly payments per index household (£15.32 in this example).
The estimated January average payment determines the weight of MIPs in the RPI for the current year (the average payment is expressed in weekly terms so that it can easily be combined with other LCF data used in the calculation of RPI section weights). The MIPs index, based on the previous January = 100, is calculated as the current month’s average weekly payment expressed as a percentage of the average weekly payment in January. In-year indices are chained in the usual way to provide a long-run MIPs index based on January 1987 = 100.
12.5.1.1 House price estimates
Following the introduction of a new UK House Prices Index (UKHPI) in June 2016, there was an update to the calculation of the housing components of the Retail Prices Index (RPI) to reflect the new UKHPI rather than the historic House Prices Index (HPI). These changes were introduced in February 2017.
The new UKHPI includes all residential properties purchased at market value in the UK. The UKHPI, which is produced by us but published by HM Land Registry, introduced improvements such as cash sales, which were previously excluded from our HPI, and using a geometric mean, while our HPI used an arithmetic mean.
However, although the published UKHPI uses a geometric mean, an arithmetic mean is required for the RPI. Therefore, a version of the UKHPI is calculated separately using an arithmetic mean for use in the RPI. The UKHPI is used in the calculation of some RPI housing components, namely mortgage interest payments, estate agents’ fees, ground rent and house depreciation.
Sales only appear in the UKHPI once the purchase has been registered, meaning that there can be a delay before transactions feed into the index. The timeliness of the monthly UKHPI is such that it is not available for direct use in the RPI calculation of that month. The house price estimate used in the RPI is therefore calculated by combining the monthly change in the Nationwide index with the latest available UKHPI average house price value. The Nationwide index is assumed to “lead” the UKHPI index by one month. Prior to February 2017, Halifax data was used for this forecast, but analysis of the two series found that the Nationwide index provides a better forecast. Calculation of the average house price for the mortgage interest payments (MIPs) index in any given month is, therefore, given by the following formulae:
where:
HPt = house price in the current period
HPt-1 = house price in period t-1
UKHPIt-1hp = UKHPI house price in period t-1
NWt-1ind = Nationwide index in period t-1
NWt-2ind = Nationwide index in period t-2
The HPI reference period is currently January 2023, and this is regularly updated to ensure the index reflects the type of properties being sold. While the price levels in the series change because of re-referencing, the inflation rates are unchanged and do not impact the mortgage interest payments price series when they are introduced in that series in March 2025.
12.5.1.2 Sources of interest rate data
The interest rates used are a weighted average of interest rates charged by the largest banks and building societies. Up to January 2010, the interest rate was a weighted average of the Standard Variable Rate (SVR) of interest from the main bank and building society providers using data supplied by the Bank of England. However, the mortgage market had evolved with increased take up of alternative mortgage types including fixed rate, discount and tracker mortgages, which were not covered in the SVR measure. The key concern was that few mortgages were on SVR rates and as such the SVR did not reflect the average rate that borrowers were paying.
As an alternative measure of interest, we developed the Average Effective Rate (AER) jointly with the Bank of England. This is more representative of the mortgage rates available, covering around 90% of bank and building society lending. The AER is calculated using the same data as the Bank of England’s published effective rate, which includes various mortgage rates weighted together based on market share. For the RPI, these rates are weighted by the relevant stock of mortgages each January. (For the calculation of the “effective rate”, the Bank reweight the index each month.) The AER is in line with the Retail Prices Index (RPI) concept of a fixed basket with fixed weights within each year. The final mortgage interest payments (MIPs) series then reflects both new and existing mortgages and can follow the evolution of the mortgage market.
The AER for any month cannot be compiled in time to be included directly in that month’s RPI. However, the Bank of England forecasts the effective rate for the current month using the latest available data, and this was extended to produce a forecast AER. Such an approach is consistent with the methodology used to estimate the change in house prices within the MIPs series. The forecast is produced by weighting together a combination of fixed and floating rate mortgage series. The fixed rate series uses two- and five-year quoted fixed rates weighted together after taking 24- and 60-month rolling averages respectively. The SVR is used for the stock of floating rates. The use of forecasting does have an effect on both the MIPs series and the all-items RPI, but any error introduced is much smaller than the difference between SVR- and AER-based series.
12.5.1.3 Re-weighting mortgage interest payments (MIPs)
At the annual Retail Prices Index (RPI) re-weighting, the data derived from the Living Costs and Food Survey (LCF) and the relative weights for different mortgage interest rates are all assessed and revised as necessary.
The various parameters used in the mortgage interest payments (MIPs) model need to be revised from time to time to ensure that the model continues to represent the experience of RPI households. Those factors that affect the quantity of owner occupied housing are reviewed annually, while those that affect the quantity of mortgage financing are reviewed more infrequently, usually being kept fixed for at least five years at a time. Under these guidelines, the sources and frequency of updating the model parameters are shown in the following.
The re-referenced HPI has been taken on as part of the 2025 re-weighting. The HPI reference period is currently January 2023, and this is regularly updated to ensure the index reflects the type of properties being sold. The new data has been used in calculating the average debt outstanding as described in section 12.5.1.
12.5.1.4 Reviewed annually:
Profile of length of time owner occupiers have lived in their present houses: these data are used as a proxy for the profile of time since the initial mortgage was taken out, excluding owner occupiers of more than 23 years’ residence. Data are obtained from the Living Costs and Food Survey (LCF) on an annual basis, and we interpolate these data into monthly values.
The repayment of capital profile (that is, for repayment mortgages) is the proportion of the initial mortgage that is still outstanding for each month.
Proportion of index households who are owner occupiers and who have lived at current property for less than 23 years: these are derived from the LCF.
12.5.1.5 Reviewed periodically:
Proportion of mortgage borrowed for house purchase: previously obtained from the General Household Survey.
Proportions of endowment-type versus repayment mortgages, average initial length of mortgage (currently 23 years): data are obtained from the Council of Mortgage Lenders’ survey of mortgage lending.
Proportion of owner occupiers with duration of residence under-23-years with mortgages: data are obtained from LCF.
12.5.2 Owner occupiers’ housing depreciation
Since January 1995, as a result of the recommendations of a Retail Prices Index Advisory Committee (RPIAC) review of the treatment of owner occupiers’ housing costs in the Retail Prices Index (RPI), a house depreciation component has been included in the RPI. Its inclusion represents the expenditure that all owner occupiers would find necessary to maintain their house at a constant quality, the intention of the RPI being to measure prices of goods of constant quality.
Depreciation is measured at current replacement cost. It represents the notional amount needed to be put aside to cover large infrequent renovations required to make good deterioration and obsolescence and does not include routine repairs and maintenance covered elsewhere in the RPI. The cost of depreciation to owner occupiers is a measure of the amount of housing “consumed” in the current period and, combined with mortgage interest payments (MIPs), provides an approximation of the current cost of shelter to owner occupiers while excluding the investment element of house purchase.
The RPIAC recommended that an index of house prices be used as a proxy for the depreciation component. To understand why this index was chosen as the price indicator, it is necessary to examine first how the weight for depreciation costs is calculated. The market value of the UK housing stock represents the price at which housing could be purchased at current prices, so using a proportion of market value as an RPI weighting component is consistent with the use of a house prices index as the price indicator. Ideally, it would relate to the price of dwellings excluding land, but there is no such index suitable for RPI purposes. Instead, the monthly house price index used is based on the UK House Prices Index (UKHPI) house price used for MIPs (see section on MIPs).
The new UKHPI was introduced in June 2016, leading to there being an update in the calculation of the housing components of the RPI to reflect this. These changes were introduced in the February 2017 index published on 21 March 2017. Prior to this, house prices from our House Price Index (formerly produced by the Ministry of Housing, Communities and Local Government) were used.
12.5.2.1 Smoothing the user price series
From January 1995 to June 1996, the depreciation component of the RPI was based on the monthly Ministry of Housing, Communities and Local Government (MHCLG) House Price Index. However, this series is volatile, leading to volatility in the all-items RPI. As the depreciation component represents only notional, rather than actual expenditures, a smoothed version of the MHCLG House Price Index (not the index used for MIPs) has been used since July 1996. The smoothed index was scaled to have the same level in June 1996 as the unsmoothed index, so that no step change occurred. The smoothed index is also used for ground rent, which is also a notional measure. However, the unsmoothed index is still used for MIPs and estate agents’ fees, as these represent actual expenditures. Since February 2017, the UK House Price Index (UKHPI) has replaced the MHCLG House Price Index (produced by us after 2012) in this calculation.
The smoothing technique used is exponential smoothing. If Ht is the house price index for the current month, St the smoothed index and Ht-i the index i months ago, then:
For calculating the index, the following algebraically equivalent formula is used:
In practice, the UKHPI is not available until a month after it is needed. The current month's index for housing depreciation is therefore the smoothed index for the previous month calculated using the previous month's UKHPI data. Each January, the resultant series is re-scaled to 100. The parameter α is currently set at 0.5. It is reviewed periodically. If the UKHPI index is rising (or falling) steadily, the smoothed series will be systematically below (or above) the original. This does not introduce bias, as only the change in the smoothed index affects the RPI.
The weight of the depreciation component in the RPI is calculated by multiplying the previous end- year’s average house price, excluding land, by a rate of depreciation derived from UK national accounts data. This is then converted to obtain the notional weekly expenditure on depreciation by the average index household.
The rate of depreciation derived from UK national accounts’ data is the ratio of the capital consumption of household sector dwellings at current replacement cost to the gross capital stock of household sector dwellings for the previous year, expressed as a percentage. The rate of depreciation actually used is the average of the rates over the last ten years. This is reviewed annually.
The previous end-year’s average house price is calculated by dividing the total value of owner-occupied housing stock by the total number of owner-occupied dwellings. Then the average value of a small plot of building land, is subtracted to arrive at an average value of an owner-occupied dwelling excluding land. This is recalculated during the annual RPI re-weighting.
12.5.3 Council tax
The index is based on the average Band D council tax bills across all households in Great Britain. Council tax bills for other bands are set as fixed proportions of the Band D bill and so the percentage change experienced by households occupying these homes will be the same as for a Band D property.
Information for England, Wales and Scotland is supplied by the Ministry of Housing, Communities and Local Government (MHCLG), the Welsh Government and the Scottish Government respectively. The average figures are weighted together using the number of chargeable properties in each country to give the overall figure for Great Britain. The index measures households’ liability for council tax, rather than actual payments made, and is usually fixed for 12 months from April of each year, so the index increases only in April. However, “charge capping” of some local authorities’ expenditure plans can cause the index to drop after April when the caps are implemented.
The average level of payments is slightly lower for index households than for all households. However, analysis of several years of data from the Living Costs and Food Survey (LCF) shows no significant difference in year-on-year percentage changes in bills for index and for non-index households, so no adjustment needs to be made to the price index. Use of the same sources for deriving the weight for council tax would, however, overstate the expenditure. The weight is thus adjusted using data from the LCF so that only index households are included. The figures are also adjusted for discounts reflecting householders’ status. Since the RPI weight should reflect actual expenditure rather than liability, a final adjustment is made to the weight to allow for the proportion of households that evade paying council tax.
12.5.3.1 Northern Ireland rates
In Northern Ireland, domestic rates are still levied and there has been no community charge or council tax. The Department of Finance and Personnel in Northern Ireland supplies the average net domestic rates bill annually and an index is derived by comparing the current year’s bill with the previous year’s bill. The calculation involves working out the gross domestic poundage rate, and then multiplying this by the average domestic valuation to get the average gross rates bill per year. The average discount across all households is then removed from the gross figure to obtain the average net domestic rates bill per year.
12.5.4 Estate agents’ fees
Estate agents normally quote a price for selling a house as a percentage of the house sale price, rather than as a fixed price. The price collection is done locally, and price collectors therefore collect the percentages charged (excluding Value Added Tax, VAT) by estate agents for average house prices for the region in which each location falls. The regional average house prices are obtained from the UK House Prices Index (UKHPI) by region. The percentage fees are then averaged to form regional stratum average percentage charges. These stratum percentages are then weighted together using HM Revenue and Customs (HMRC) data on total value of house transactions by region, to construct a national average percentage charge. This is applied to the national average house price (using the same house price as for MIPs, Section 12.5.1), to work out an average cash price, onto which VAT is then added.
These monthly average prices are then compared as usual with the previous January price to construct the item index.
12.6 Weights
As with the Consumer Prices Index including owner occupiers’ housing costs (CPIH), all of the weights used in compiling the Retail Prices Index (RPI) are updated annually to coincide with general review of the representative items in the basket. Section 8 describes how the CPIH weights are calculated – many of the procedures are similar to those applied to the RPI. Within the RPI, the same central or regional shop weights and stratum weights are used as in the Consumer Prices Index (CPI) and CPIH. RPI item weights are used for the section indices and section weights are used for the all-items index. Only the section weights are published. RPI weights are mainly based on data from the Living Costs and Food Survey (LCF) and are related to expenditure by private households only, excluding the highest-income households and pensioner households mainly dependent on state benefits.
12.6.1 Differences in weights
The Retail Prices Index (RPI) sources additional weight information for housing depreciation, council tax, and domestic rates and mortgage interest payments (MIPs). Details of the calculation of the weights are provided in the following.
12.6.2 Mortgage interest payments (MIPs)
The basis of any weight used in the Retail Prices Index (RPI) is the average expenditure per index household per week in the base period. For mortgage interest payments (MIPs), this is the current January figure produced by the model used to calculate the average weekly index household expenditure on MIPs.
12.6.3 Council tax and domestic rates
The section weight for council tax and domestic rates is derived from the most recently available Living Costs and Food Survey (LCF) data from the financial year of the current January. LCF data give the weekly average council tax liability after status discount among index households for each government office region in Britain. It is necessary to stratify by region to take account of the differential survey response rates across regions. Otherwise, the lower response rates for some regions for which council tax liability is typically higher (for example, London) would bias the result downward.
A weighted average of the average liabilities in the nine English regions is derived using estimates from the Ministry of Housing, Communities and Local Government (MHCLG) of the total number of households in each region. (These are not restricted to index households.) The figures giving the average liability for England, Wales and Scotland are adjusted to reflect actual expenditure by using estimates of the respective non-payment rates (supplied from the MHCLG, the Welsh Government and the Scottish Executive). In Northern Ireland, rates are still levied. The average level of rates (including water and sewerage charges) applicable in Northern Ireland, and an estimate of the number of households, are provided by the Northern Ireland Department of Finance and Personnel.
The figures for average expenditure on council tax or rates (as appropriate) for England, Wales, Scotland and Northern Ireland are then combined to form a weighted average using the estimates of total number of households in each area.
12.6.4 Housing depreciation
The section weight for owner occupiers’ depreciation costs is calculated from an estimate of the previous end-year’s market value of the owner-occupied housing stock (from the national accounts) divided by the number of owner-occupied dwellings in the United Kingdom (from the Ministry of Housing, Communities and Local Government, MHCLG) with an estimate of the average land value per plot (also from MHCLG) deducted. The resulting average owner-occupied dwelling value excluding land is then multiplied by a rate of depreciation derived from UK national accounts data. This is currently 1.4% per annum, but it is reviewed every five years. The product is then multiplied by a factor, obtained from the LCF, representing the proportion of all households (owners and tenants) that are owner occupiers, and divided by 52 to give the notional weekly household expenditure on depreciation.
12.6.5 Insurance
In the Retail Prices Index (RPI), gross expenditure on insurance premiums is assigned to the relevant insurance heading when calculating the weights. In the Consumer Prices Index including owner occupiers’ housing costs (CPIH), only the difference between expenditure on insurance premiums and the amount paid out in claims (that is, the service charge) is allocated to the relevant insurance heading; the amount paid out in claims is allocated to other relevant headings according to the nature of the claims (for instance, expenditure on repairing a car is attributed to the heading for maintenance and repair of vehicles). This calculation is based on the average of the most recent three years’ data.
This difference in approach means that the weight of insurance in the RPI is significantly higher than in the CPIH, and so the impact of changes in the cost of insurance at the all-items index level is correspondingly larger. Overall, the combined weight for car, health, house contents and foreign holiday insurance in the RPI is around four times that in the CPIH. This could also be because the RPI accounts for the value of insurance claims received without deducting expenditure using insurance claims received, which leads to double-counting. However, note that the insurance indices themselves are constructed with reference to gross premiums paid both in the RPI and CPIH.
12.7 Publication
RPI data are available electronically on our website in the published Consumer price inflation tables. Official indices for the RPI and its components are available monthly back to January 1947 and are based on 1987 = 100.
12.7.1 Annual and quarterly averages
The Retail Prices Index (RPI) approach to the calculation of quarterly and annual average indices differs from the Consumer Prices Index including owner occupiers’ housing costs (CPIH) (see Section 11.3: Annual and quarterly charges). The RPI quarterly and annual indices are calculated as an average of the published rounded monthly indices. The resulting indices are then published rounded to one decimal place, with changes over 12 months in the quarterly and annual average indices being calculated from these rounded quarterly and annual average indices.
12.7.2 Rounding policy and the effects of rounding
Section 11.4: Rounding policy and the effects of rounding described how unlike the Consumer Prices Index including owner occupiers’ housing costs (CPIH), the Retail Prices Index (RPI) calculations are based on the published rounded indices, which can lead to some extreme rounding effects when publishing rounded indices to 1 decimal place, and then calculating percentage changes from these rounded indices, which are then themselves rounded to 1 decimal place.
The following example illustrates this. It appears from published, rounded figures that the inflation rates for the RPI excluding mortgage interest payments (MIPs) and RPI excluding housing have both fallen by 0.1 percentage points (from 2.0 to 1.9 and 1.1 to 1.0 respectively). However, the picture based on unrounded figures shows the RPI excluding MIPs to have increased by 0.1 percentage points (from 1.9 to 2.0) and the RPI excluding housing to have fallen by 0.3 percentage points (from 1.2 to 0.9).
| Date | Unrounded index | Rounded index (1dp) | % change (based on unrounded index) | % change (based on rounded index) | |
|---|---|---|---|---|---|
| RPI excluding MIPs | July 2002 | 174.75 | 174.8 | 1.931=1.9 | 1.984=2.0 |
| July 2001 | 171.44 | 171.4 | |||
| RPI excluding MIPs | August 2002 | 175.34 | 175.3 | 1.966=2.0 | 1.919=1.9 |
| August 2001 | 171.96 | 172 | |||
| RPI excluding housing | July 2002 | 165.44 | 165.4 | 1.156=1.2 | 1.100=1.1 |
| July 2001 | 163.55 | 163.6 | |||
| RPI excluding housing | August 2002 | 165.65 | 165.7 | 0.920=0.9 | 0.975=1.0 |
| August 2001 | 164.14 | 164.1 |
Download this table Table 11: Illustrative example of the effects of rounding
.xls .csv12.7.3 How to construct aggregates
As with the Consumer Prices Index including owner occupiers’ housing costs (CPIH), the indices for the Retail Prices Index (RPI) groups and sections can be combined to suit users’ particular requirements where the standard aggregates are not appropriate. The aggregate indices are calculated in a similar way to the CPIH (as described in Section 11.5: How to use the CPIH, CPI and RPI), with the exception of part a., where it is not necessary to divide the January index for each year by the previous year’s December’s index, since the RPI series is only chained-linked once a year.
12.7.4 Contribution to changes in the all-items RPI
Like the Consumer Prices Index including owner occupiers’ housing costs (CPIH), it is often of interest to estimate the effect of a group or section on the change in the Retail Prices Index (RPI). The contribution of a component to a change in the all-items RPI over a given period of time is defined as the change that would have occurred in the all-items index if that component had undergone its observed change but all other component indices had remained frozen at their values at the start of the period (and all weights are kept the same). The effect of each component depends on both the size of its change and its weight.
The following formula for calculating the contribution of a component to the monthly change in the RPI, which differs from that used for the CPIH, is:
The formula for calculating the contributions of components to the all-items RPI 12 month rate is:
where:
I = component i
a = all-items RPI
Iit = index for component i (base previous January = 100) in month t
ILi = index for component i in “Link” month (that is, the index for current January based on previous January = 100)
wti = weight (parts per 1000) of component i in all items RPI in month t
As the definition of the variables makes clear, it is important that these calculations are performed using unchained (that is, base period January = 100) indices. The following example illustrates this point.
12.7.4.1 Example calculation
Using the previous formula, the contribution of housing to the Retail Prices Index (RPI) all-items annual rate for October 2003 can be calculated using the following steps.
The published (chained) index values, based on January 1987 = 100, for housing and the all-items RPI are as follows:
| Jan 2002 | Oct 2002 | Jan 2003 | Oct 2003 | |
|---|---|---|---|---|
| Housing | 218.4 | 232.8 | 236.7 | 248.3 |
| All items | 173.3 | 177.9 | 178.4 | 182.6 |
Download this table Table 12: Published (chained) index
.xls .csvIn order to work out the contribution of housing to the all-items RPI 12-month rate for September 2003, it is necessary to unchain the indices so that they are based on the most recent January. This is done by dividing the current month’s index by the previous January’s figure. For instance, the housing index for January 2003 (the link month) is calculated as:
Performing this calculation for each of the dates gives the following set of unchained index values:
| Jan 2002 | Oct 2002 | Jan 2003 | Oct 2003 | |
|---|---|---|---|---|
| Housing | 100.00 | 106.59 | 108.38 | 104.90 |
| All items | 100.00 | 102.65 | 102.94 | 102.35 |
Download this table Table 13: Unchained index based on previous January
.xls .csvThe contribution of housing to the 12-month rate for October 2003 can then be calculated as follows, given that the weights for housing in 2002 and 2003 are 199 and 203 parts per thousand respectively:
Thus, housing contributed 1.34 percentage points to the all-items RPI 12-month rate in October 2003. The way that these contributions to the annual rate are usually used is as follows: for any given month (for example, October 2003) the contribution of each group to the 12-month rate is calculated. This is also done for the previous month (September 2003 in this case). The October contribution less the September one is described as the contribution to the change in the all-items 12-month rate between the two months. Thus, housing contributed 1.40 points to the 12-month change to September and 1.34 points to the change to October, so it contributed 1.34 – 1.40 = –0.06 points to the change in the 12-month rate between September and October which was 2.6 – 2.8 = –0.2 percentage points.
Contributions are derived with maximum precision at every stage of the calculation. But they are based on rounded indices, and in order to provide meaningful analysis, are published to two decimal places. The RPI is given as a unique official figure that is published rounded to the nearest single decimal place.
12.7.5 Reconciliation of RPI and CPIH or CPI annual rates
There is often interest in understanding the factors contributing to differences between the 12-month rates of change for the Retail Prices Index (RPI) and the Consumer Prices Index including owner occupiers’ housing costs (CPIH) and Consumer Prices Index (CPI). Each month, we publish a reconciliation of these differences. The reconciliation between the headline rates is performed using contributions (see Section 11.7 and 12.7.5), based on the following elements:
- housing components included in the RPI but excluded from the CPIH and CPI
This shows by how much the annual rate for the RPI would be different if it did not include the following housing elements that are excluded from the CPIH and CPI: mortgage interest payments (MIPs); council tax; housing depreciation; buildings insurance and ground rent; surveyors’ fees; estate agents’ fees; and conveyancing costs. Within this category, the contributions from MIPs and the other housing components are shown separately.
- housing components included in the CPIH but excluded from the RPI
This shows how much the annual rate for the RPI would be different if it included a measure of imputed rents. This could therefore be considered an offsetting term that taken together with the impact from the RPI housing components not in the CPIH or CPI, shows the impact on the RPI annual rate owing to differences in housing. This covers the owner occupiers’ housing component of the CPIH and therefore does not impact on the reconciliation of the differences between the RPI and the CPI.
- other differences in coverage of goods and services
This shows the effect of other differences between the RPI and the CPIH or CPI in the coverage of goods and services (see Section 12.2: Index coverage and classification). This includes items such as unit trust and stockbroker charges, overseas students’ university fees and accommodation costs in university halls of residence, which are included in the CPIH and CPI but are excluded from the RPI. Prior to 2012, vehicle excise duty, trade unions’ subscriptions and TV licences would have also contributed to the difference in coverage, since these were previously not included in the CPIH or CPI but were (and are) included in the RPI.
- formula effect
This shows the effect on the CPIH annual rate of using the geometric mean for elementary aggregation, rather than arithmetic means as used in the RPI. This is derived by recalculating the CPIH using arithmetic means and subtracting the result from the actual CPIH. In general, the geometric mean of a given set of values is lower than the corresponding arithmetic mean. This means that, for a given set of price relatives, the geometric mean formula used in the CPIH will produce a lower estimate of price change for an elementary index than one based on an arithmetic mean. For this reason, the formula effect is consistently negative.
- other differences, including weights
This is then calculated as the residual of the additive components in this list. Some of the main contributors to the component tend to be differences in weights for insurance, petrol and oil, air fares, food, and clothing and footwear.
Further detail of this method (on a CPI basis) can be found in Consumer Prices Index and Retail Prices Index – analysing differences (PDF, 111KB).
We also publish a direct estimate of the formula effect on RPI, following the discontinuation of the RPIJ in 2016. The estimate is the change in the RPI if the Jevons index were used in place of the Carli throughout the RPI. It does not form part of the family of price indices.
Prior to June 2010, a different method was used to reconcile the difference between the RPI and CPI annual rates of inflation. This is detailed in the 2010 version of the Consumer Prices Technical Manual.
Back to table of contents13. Alternative inflation measures
13.1 Introduction
The Consumer Prices Index including owner occupiers’ housing costs (CPIH) is the most comprehensive measure of inflation. It extends the Consumer Prices Index (CPI) to include a measure of the costs associated with owning, maintaining and living in one’s own home, known as owner occupiers’ housing costs (OOH), along with council tax. Both of these are significant expenses for many households and are not included in the CPI. In March 2013, the CPIH was added to the existing suite of indices, alongside the CPI and the Retail Prices Index (RPI). The CPI is currently used for macroeconomic purposes and for international comparisons, as well as its other uses by government, businesses and society in general (see Section 2.4: Uses of consumer price inflation measures), and the RPI is a legacy measure, which continues to be produced for use in pre-existing long-term contracts.
Each of these indices provides an average measure of the change in the prices of goods and services bought for the purpose of consumption in the UK. However, it is well recognised that particular types of household, and indeed each individual person, may experience different rates of inflation, and that summary inflation measures like these cannot meet all users’ needs. We therefore produce other inflation measures that may be more suitable for particular purposes. These include the following indices, based on the CPIH:
CPIHY, which excludes the effect of indirect taxes (for example, tobacco duty); this series was discontinued in December 2021; however, historic data are still available
special aggregates, which relate to areas of the CPIH where price movements are typically more volatile or are influenced by specific factors such as changes in commodity prices, including oil (for example, fuels and seasonal food) or government policy changes (for example, alcohol and tobacco that are subject to duty)
CPIH-consistent inflation rate estimates for UK household groups, including different tenure types, namely renters, owner occupiers and subsidised renters; these series were discontinued in December 2022; however, historic data are still available
These also include the following based on the CPI:
CPIY, which excludes the effect of indirect taxes (for example, tobacco duty); this series was discontinued in December 2021; however, historic data are still available
CPI-CT, which holds tax rates constant at the rate prevailing in the base period and is used to show the effect of changes in indirect taxes on the inflation rate; this series was discontinued in December 2021; however, historic data are still available
special aggregates, which relate to areas of the CPI where price movements are typically more volatile or are influenced by specific factors such as changes in commodity prices, including oil (for example, fuels and seasonal food) or government policy changes (for example, alcohol and tobacco that are subject to duty)
We also publish average retail prices and a limited range of special aggregates for the RPI. Other price indicators prepared by us, including the Producer Prices Index, the Service Producer Prices Index, the Price Index of Private Rents (PIPR), the UK House Price Index (UKHPI) and the GDP deflator, measure inflation as it affects various parts of, or the whole, economy. For some specialist purposes, measures produced by other bodies may be appropriate.
Even if the CPIH or CPI is the best measure for a particular purpose, they are, like most statistical indicators, only estimates, subject to sampling and non-sampling errors.
13.2 CPIH, CPI and RPI special aggregates
Each month, we publish detailed indices for the Consumer Prices Index including owner occupiers’ housing costs (CPIH), Consumer Prices Index (CPI) and Retail Prices Index (RPI). In addition to these, several special aggregates are published in the Consumer price inflation statistical bulletin.
For the CPIH and CPI, these additional indices include more detailed analysis of goods and services inflation, together with indices calculated by excluding various components from the all-items CPIH or CPI. These indices have been constructed by aggregating together relevant CPIH or CPI classes and use the same principles underpinning the compilation of all other published CPIH or CPI aggregates (as explained in Section 3.5: Aggregation).
A range of special aggregates are also published for the RPI. In 2016, the RPI special aggregates were scaled back to publish only the minimum of RPI-related data necessary to ensure the critical and essential needs of existing users are met. This includes a breakdown by various categories of goods and services and a selection of indices derived by excluding certain components from the all-items RPI. The latter includes RPIX – the all-items RPI excluding mortgage interest payments (MIPs) – which was the basis for the government's inflation target until December 2003.
13.3 CPIHY and CPIY
CPIHY and CPIY (see Section 13.1: Introduction) are indices designed to measure movements in “underlying” prices excluding price changes that are a direct result of changes in indirect taxation. The only difference between the two is the inclusion of owner occupiers’ housing costs (OOH) in CPIHY (since council tax is an indirect tax and is therefore excluded from CPIHY). Therefore, all other considerations that follow are identical – save for the differences in weights that reflect the inclusion of OOH. The rest of this section refers to CPIHY, but it also applies to CPIY. The purpose of these indices is to get a better indication of inflationary pressures at times when other price indices are directly influenced by government-driven changes. For example, a change in Value Added Tax (VAT) may increase prices, but the change is not a movement in the underlying price of an item.
Taxes and duties that directly affect retail prices are excluded, namely excise duties (on tobacco, alcohol and petrol), VAT, Insurance Premium Tax, Air Passenger Duty, Vehicle Excise Duty and Stamp Duty on share transactions. Council tax is also excluded from CPIHY because it is an indirect tax. For simplicity, all of these are referred to in the following as taxes.
The all-items CPIHY index is published monthly, currently based on 2015 = 100.
13.3.1 Methodology
CPIHY does not model the actions of retailers in phasing in changes to tax rates. At all times, the prices used for CPIHY are the residual prices after excluding the relevant level of applicable taxation in that month. If, for example, the duty on a pint of beer is increased by two pence per pint in the Budget (with immediate effect), CPIHY assumes that the prices collected from that moment onwards will include the increased duty. Whereas in reality, retailers may hold their current prices for a period (especially while they continue to sell pre-Budget stocks still held in shops) and may even absorb a taxation increase completely. This feature is unavoidable as it would be very hard to distinguish between a genuine price change and a change resulting from tax changes. In consequence, CPIHY is not completely unaffected by tax changes; delays in passing on a tax increase can mean that CPIHY can fall following a tax rise.
13.3.2 Weights
CPIHY does not use a model of economic behaviour, so it does not predict what prices or demand would be in the absence of taxes. This is important for deriving the weights. The approach adopted is to remove that part of expenditure from the weights that is due to tax, then to pro-rate up to 100%. Consequently, a commodity like tobacco, which has high levels of tax, has a much-reduced weight compared to the Consumer Prices Index including owner occupiers’ housing costs (CPIH).
Like the CPIH, the CPIHY Classification of Individual Consumption According to Purpose (COICOP) subclass-level weights change with effect from the January index each year, while the CPIHY item weights change in February to take account of changes in the basket and updating of the CPIH item weights on which the CPIHY weights are based.
13.3.3 CPIHY item indices
The Consumer Prices Index including owner occupiers’ housing costs (CPIH) compares prices in a given month with January base prices; CPIHY compares prices excluding indirect taxes in a given month with prices excluding indirect taxes in the January base month.
CPIHY is calculated from individual price quotes from which taxes are deducted. The calculation proceeds in the same way as for the CPIH. Stratum-level indices are computed, which are then arithmetically weighted to give CPIHY item indices (each item has one or more strata – items are stratified by region, shop type, both or neither). The stratum weights are the same as those used in compiling the CPIH.
Taxes deducted are an average for the item in question. This means that the same average tax rate is deducted from each price quote within an item, regardless of the product specification of the individual quote. For most items, this is not an issue because the actual tax paid is the same as the average rate. However, for alcohol, the duty payable depends on the volume of pure alcohol being purchased. Although the alcohol content and volume of drink are recorded, this information is not held in a way that is readily usable in calculations. Instead, average alcohol content and volume are estimated for each item and an average duty payable is calculated.
13.3.4 Aggregation
Aggregation of CPIHY item indices and higher-aggregate indices proceeds in a similar way to the Consumer Prices Index including owner occupiers’ housing costs (CPIH) and Consumer Prices Index (CPI). As for the CPIH and CPI, item indices are calculated with reference to the previous January. They are then aggregated to class- and higher-level indices, which are then chained to provide indices based on 2015 = 100.
13.3.5 Comparing CPIH with CPIHY
As the weights are different, Consumer Prices Index including owner occupiers’ housing costs (CPIH) can move differently to CPIHY, even if taxes are unchanged. For example, fruit has a higher weight in the CPIHY (because there is no Value Added Tax (VAT) on unprocessed food), so if fruit prices rise more than other prices, CPIHY will grow faster than CPIH. For those items subject to duty, retailers sometimes temporarily delay implementing a duty rise. The calculation of CPIHY assumes that duty changes are passed on immediately and in full. If the increase in duty has not been applied by the retailer, stripping out the new rate of duty may mean that the CPIHY will fall initially, and then recover. Thus, CPIHY can be more volatile than CPIH after a tax change.
For items not subject to taxes, the CPIHY item indices are the same as the CPIH item indices. This is also the case for items subject only to proportional taxes, such as VAT, as long as there are no changes in tax rates. For items subject to flat-rate taxes, such as alcohol or tobacco duty, the CPIH and CPIHY item indices can differ even when there are no changes in taxes. This is because price changes represent a greater proportion of the price excluding taxes used in the CPIHY calculation than the price including taxes used for the CPIH. However, this effect does not distort CPIHY to the same extent, since any item with high tax levels will also have a reduced weight.
When the prices excluding average taxes are calculated, a very small number of price quotes (typically, one or two out of more than 712,000 including the quotes from the Valuation Office Agency (VOA) and 140,000 excluding these data per month) are found to have negative prices, that is, the price including taxes is less than the average tax applied. These negative prices are excluded from the CPIHY calculations. They can occur if the product is a loss leader, or if the product is on sale where the actual tax payable on the product is less than the average for the item.
Some of the prices excluding taxes are also very low. These have the effect of reducing the geometric mean price, and hence the CPIHY item index, relative to the CPIH index. This is illustrated in Table 14, where the CPIH and CPIHY item indices are calculated for an item comprising two equally-weighted products, where the average tax for the item is £2.30 in both the current and base periods.
| CPIH: Including taxes | CPIHY: Excluding taxes | |||||
|---|---|---|---|---|---|---|
| Base price | Current price | Price relative | Base price | Current price | Price relative | |
| Product 1 | £4.00 | £4.50 | 1.13 | £1.70 | £2.20 | 1.29 |
| Product 2 | £3.00 | £2.50 | 0.83 | £0.70 | £0.20 | 0.29 |
| Geometric mean price | £3.46 | £3.35 | £1.09 | £0.66 | ||
| Item index | 96.8 | 60.8 | ||||
Download this table Table 14: Worked example of CPIHY calculation
.xls .csv13.4 Consumer Prices Index with constant tax (CPI-CT)
Consumer Prices Index with constant tax (CPI-CT) is defined as an index where tax rates are kept constant at the rates that prevail in the base period. This measure is constructed in line with Eurostat regulations and is used to provide an indication of changes in indirect taxes on the overall inflation rate. The index is chain-linked annually, and the base tax rates are updated accordingly. The CPI-CT uses the same weights as the Consumer Prices Index (CPI). The analytical value of the CPI-CT arises when it is compared against the CPI. Differences in the rates of change of the two indices show the contribution of tax changes to the overall CPI inflation figures.
Like the CPIHY and CPIY, the CPI-CT calculation assumes that tax changes are passed on immediately and in full. It works backwards from the observed average price in the period following the tax change, stripping out the new taxes and adding on the base period taxes. To the extent that increases in taxes are not passed on immediately to customers (for example, until existing stocks are run down), CPI-CT will overestimate the effect of tax changes in the first month. This is because it will strip out too much tax, leading to a lower monthly change in CPI-CT than would otherwise apply. The difference in monthly rates between the CPI and CPI-CT from the tax change would therefore be higher in the first month (that is, over-estimated).
The all-items CPI-CT is published monthly, along with the following sub-indices: all goods, all services and energy. All indices are based on 2015 = 100. Comparable measures of the CPI-CT are constructed in other countries of the European Union, and Eurostat publish EU and Eurozone averages.
Note that CPIH is not currently produced on a constant taxes basis.
13.4.1 Calculation and interpretation of the CPI-CT
The Consumer Prices Index with constant tax (CPI-CT) class and item weights are the same as those used for the Consumer Prices Index (CPI) and aggregation of the CPI-CT item indices proceeds in an identical way to the CPI.
The CPI-CT item indices are obtained by deducting current period taxes, using average tax rates for the item, and then adding back in the average tax rates prevailing in the previous base month. This is then compared against the corresponding geometric mean price in the base period. This is illustrated in the following worked example, where the base month is December and flat-rate taxes increase in February.
As noted earlier, the analytical value of the CPI-CT arises when it is compared against the CPI. As the same weights are used in each index, differences in their inflation rates can, in the main, be attributed to the effect of tax changes. In the following table, the final column compares the one-month changes in the CPI and CPI-CT. It shows that in February, for example, 2.67 percentage points of the total change of 6.67% is attributable to the change in tax rates.
| Basic price (£) | Flat rate tax (£) | Observed price (£) | Price at constant tax amount (£) | Index of observed prices | Index with constant tax amount | Observed price monthly rate (CPI) | Constant tax amount monthly rate (CPI-CT) | Difference (CPI - CPI-CT) | |
|---|---|---|---|---|---|---|---|---|---|
| Reference | a | b | c | d | e | f | g | h | i |
| Calculation¹ | a(t)+b(t) | a(t)+b(Dec) | c(t)/c(Dec) | d(t)/d(Dec) | e(t)/e(t-1) | f(t)/f(t-1) | g(t)-h(t) | ||
| Dec | 3.00 | 0.60 | 3.60 | 3.60 | 100.00 | 100.00 | |||
| Jan | 3.15 | 0.60 | 3.75 | 3.75 | 104.20 | 104.20 | 0.04 | 0.04 | 0.00 |
| Feb | 3.30 | 0.70 | 4.00 | 3.90 | 111.10 | 108.30 | 0.07 | 0.04 | 0.03 |
| Mar | 3.45 | 0.70 | 4.15 | 4.05 | 115.30 | 112.50 | 0.04 | 0.04 | 0.00 |
| Apr | 3.60 | 0.70 | 4.30 | 4.20 | 119.40 | 116.70 | 0.04 | 0.04 | 0.00 |
Download this table Table 15: Worked example of CPI-CT calculation
.xls .csvThe table also illustrates two other features of the CPI-CT:
when there are no changes in tax rates during the course of the year, the CPI-CT monthly rates are the same as those of the CPI
small differences in the CPI and CPI-CT monthly rates can arise in the months following a change in flat-rate taxes, such as fuel duty (in the example, the CPI-CT rises slightly faster than the CPI, although the gap narrows over time); the discrepancies do not arise if it is proportional taxes that are changing
The CPI and CPI-CT 12-month rates can also be compared to show the impact of tax changes on the annual inflation rate. As with the monthly rates, small changes in the differences in the CPI and CPI-CT annual rates can arise in months following tax rate changes, even when there are no further changes in the tax rate.
13.5 Average prices
Averages of prices collected for selected items (mostly food) can be found on our website as part of the latest release as a downloadable Excel file. Data for the preceding 13 months is available in the main release, if a longer series is required for a particular item the series code can be entered into our time series explorer and downloaded from there. The items are those that are likely to be reasonably homogenous across all outlets and over time, so that an average price is reasonably meaningful. For each January, the number of valid prices for each item, the average, and the 10th and 90th percentiles of the distribution of prices are calculated (these are weighted averages and percentiles, using stratum weights: Section 8.4).
For subsequent months up to and including the following January, the figures are the January average price updated by the price index for that item. Thus, if the January average price is 94p and the May index (based on January = 100) is 103.0, the average price published is 94 x 103.0 / 100 = 97p. This method is used to avoid spurious changes in the published average price owing to an inability to get all the necessary matching prices in months subsequent to the base month. However, it means that there may be discontinuities between the prices published for each January (updated from the previous January) and those published for each February.
The Retail Prices Index (RPI) item indices are used to uprate average prices. This is because the RPI uses the Dutot formula for most of these items (some items, such as cigarettes, are grouped further to form weighted averages). The Dutot formula is the most appropriate to use in this instance because we are not concerned with price change (which is the purpose of a price index) so much as tracking price levels. Given a constant product mix, using the Dutot formula to uprate average prices will return the average price in any given period since. For example:
where:
̅piJan = the average price of item i in January
̅piMar = the average price of item i in March (for example)
Ii,DutotJan:Mar = the March Dutot index for item i based in January
The use of the Jevons index in this case would return the geometric average price, which is less appropriate for the purposes for which these average prices are used.
Historical average prices, with some series going back to 1914, are available from the Consumer Prices tables held in the time series section of our website.
13.6 CPIH-consistent inflation rates for different household groups
We calculate experimental inflation rates for different UK household groups that are consistent with the Consumer Prices Index including owner occupiers’ housing costs (CPIH). Because the consumption baskets of specific households differ, and because prices do not all change at the same rate, the price experience of different groups of households may differ from the average figure for all households. An index could be constructed for each household group, which would be an average measure of change in the prices of goods and services bought for the purpose of consumption by the vast majority of households in the household group under consideration. There are currently published experimental indices for six groups:
retired households and non-retired households
households grouped by equivalised disposable income deciles
households grouped by equivalised expenditure deciles
households grouped by income quintiles
households grouped by tenure type
households with children and without children
As price data are collected from retailers rather than by asking households the prices they have paid for each item, separate price indices are not available for different types of households. A limitation of the analysis is that the methodology used to calculate CPIH-consistent inflation rates for different UK household groups assumes that households all experience the same changes in price.
The expenditure data used to calculate CPIH-consistent inflation rates for UK household groups come from several sources. First, household-level expenditure data are taken from the Living Costs and Food Survey (LCF). The LCF is a continuous survey of the expenditure patterns of UK private households based on a sample of around 6,000 responding households per year. Demographic information about each household is also collected, along with the components required to calculate expenditure for each of the 87 class-level categories. The LCF contains the most detailed household-level expenditure data that is currently available to us.
In addition to micro-level data from the LCF, this method makes use of the aggregate household spending data that underpin the class-level weights and above used in the construction of the CPIH, which are largely derived from System of National Accounts (SNA) 2008 estimates of household final consumption expenditure (HHFCE).
The analysis is published on a quarterly basis in the Consumer price inflation, UK bulletin tables, and an accompanying article is produced annually. These data are currently experimental statistics.
13.7 Household Costs Indices (HCIs)
In December 2017, we released the first preliminary estimates for the Household Costs indices (HCIs) on an experimental basis. In April 2019, we released the second preliminary estimates for the HCIs. In June 2019, the then National Statistician published a statement on the future development of the HCIs. Estimates were presented for the following UK household groups: income and expenditure deciles; retired and non-retired households; and households with and without children.
The HCIs are a set of experimental measures, currently in development, that aim to reflect UK households’ experience of changing prices and costs. More specifically, they aim to measure how much the nominal disposable income of different household groups would need to change, in response to changing prices and costs, to enable households to purchase the same quantities of goods and services at a fixed quality. Put simply, the broad approach of the HCIs is to measure the change in monthly outgoings of households.
Currently, the HCIs differ from the Consumer Prices Index including owner occupiers’ housing costs (CPIH) in five ways. These are:
the use of democratic weighting, which gives each household’s expenditure equal weight
the use of a direct measure of housing payments rather than the rental equivalence approach used in the CPIH
the inclusion of a measure of interest costs on credit card debt
the use of gross expenditure to calculate the weight for insurance premiums, rather than netting out the part of expenditure that is used to pay out household claims
the use of a payments approach to calculate further education costs, as opposed to the acquisition approach used in the CPIH
There are several other proposed differences in methodology and scope between the HCIs and the CPIH that will be considered for future development. In no particular order, suggestions to date have included but are not limited to:
measuring changing prices and costs as experienced by the national population (including expenditure by residents abroad and excluding foreign visitors’ expenditure in the UK) as opposed to within the domestic territory (including foreign visitors’ expenditure in the UK and excluding residents’ expenditure abroad)
using a measure of direct payments to calculate items that are paid for in advance (for example, package holidays, airfares and cultural events)
including the cost of interest on all debt (for example, mortgage interest and interest on credit cards and loans)
including the cost of goods bought second-hand without taking into account goods sold (such that household-to-household transactions are included as a cost)
including items that are seen as saving in traditional Consumer Prices Index (CPI) methodology (such as capital housing costs, savings and pension contributions)
The HCIs are still in development and as such future estimates are expected to extend the scope to include different, or additional, items. Furthermore, some of the methodology used in the preliminary estimates may be further improved.
13.8 Regional price indices
There are two types of regional price indices that could be produced: one would measure change in prices over time within a region (a temporal index), the other would measure differences in price levels across regions (a spatial index). An index could be constructed for each region, which would be an average measure of change in the prices of goods and services bought for the purpose of consumption by the vast majority of households in the region under consideration. Such indices would measure the change over time of the cost of local goods and services to local people. They would not provide a good basis for comparing differences in price level between regions. To produce regional prices indices that could be compared across regions, we would have to ensure that identical items are costed in all parts of the country.
In 1968, the Retail Prices Index Advisory Committee (RPIAC) considered the issue of regional price indices and recommended that there should be a study of the technical problems that would be involved in comparing price levels in different regions or areas. The technical committee that was appointed as a result of this recommendation reported back to the RPIAC in 1971. Its conclusion was that the production of regional price indices was possible but costly. Not all the members of the RPIAC agreed that the publication of regional price indices was desirable and as a result the Department of Employment did not take the matter further.
More recently, there has been a growing demand for information on regional data. We publish a range of data, covering the nine previously termed “government office regions” of England, Northern Ireland, Scotland and Wales.
13.8.1 Regional inflation figures
At present, we do not calculate regional inflation figures. However, this is something that is being investigated, and experimental statistics for a regional Consumer Prices Index including owner occupiers’ housing costs (rCPIH) have been produced as part of a feasibility study carried out by the University of Southampton and published by us, for each of the 12 regions of the UK in 2017. There are limitations to calculating regional price indices because the data currently available are not suitable for the compilation of reliable figures. To produce reliable estimates would require increasing the sample size for the locally collected prices dramatically. In addition, many of the centrally compiled indices (for example, housing, cars and personal computers) are designed as national indices. It would be a difficult task to decompose such data into appropriate regions.
The data used for the weights (such as the Living Costs and Food Survey, LCF) would also have to be significantly enhanced to ensure that detailed regional expenditure categories (by type of good or service, and by type of outlet) were being weighted appropriately and represented in the sample of prices being collected.
Although it is possible to construct an rCPIH series from the available data sources, the reliability of specific components of the data and procedures is generally low. Considerable further development would be needed to ensure that the rCPIH can reliably represent inflation within each of the regions. Work is underway to develop reliable regional inflation estimates; in 2019, we published an article assessing small area estimation for regional expenditure weights.
13.8.2 Regional price-level comparisons
During 2016, work was undertaken to calculate regional relative consumer price levels (RRCPLs). This work was published in March 2018 in the article Relative regional consumer price levels of goods and services, UK: 2016. RRCPLs provide a comparison of a region’s price level relative to the national price level where the UK equals 100. Those regions with an RRCPL above 100 are relatively more expensive than the UK average, while the converse is true for those regions with an RRCPL of less than 100.
The main difference compared with the Consumer Prices Index (CPI) is that regional price-level comparisons are designed to compare prices of a common basket of goods and services at one particular point in time, that is, a spatial comparison, in different regions in the UK; whereas, the CPI measures the difference in prices of the same basket of goods and services throughout the UK over a period of time, that is, temporal comparison. This is a significant difference that is important to understand. RRCPLs cannot be compared over time as they are a spatial comparison and not a temporal one.
The methodology adopted by the Office for National Statistics (ONS) is consistent with the approach used by Eurostat in the calculation of purchasing power parities (PPPs) for the Eurostat–OECD PPP Programme. While RRCPLs compare regions within the UK with each other, the Programme produces PPPs that compare participating countries with each other.
The basic approach to calculating RRCPLs is to measure the cost of purchasing a common basket of goods and services in each region and express that cost relative to buying the same basket nationally (where the UK equals 100). That is, how much more (or less), relatively speaking, it costs to buy the basket in one particular region, compared with a UK-average cost for the same basket.
Similar to the CPI, it is not feasible to collect prices for every type of good and service that consumers spend their money on. Nor is it possible to collect prices from every single outlet or service provider that consumers make purchases from. Therefore, it is necessary to sample for items, locations, outlets and service providers.
To be able to compare prices at a particular point in time, it is important to ensure that an identical basket of goods and services is priced for all of the regions. This is critical in developing comparable outputs and ensures that observed price differences in the regions are because of price alone and not influenced by variability in the quality of items priced across regions. For example, a comparison of an observed price of a branded item in one region with the observed price of an unbranded item in another region will reflect in part that the items are not comparable and that unbranded items are typically cheaper.
Having collected observed prices for the goods and services included in the basket, an average price is calculated in each region for each item. Two stages were employed to calculate and aggregate the RRCPLs.
The first stage was below the elementary aggregate level, referred to here as the “basic heading”. Basic headings are the building blocks for the RRCPLs and are the lowest level for which expenditure weights can be obtained. A basic heading comprises a group of similar, well-defined goods or services. In total, 168 basic headings have been defined for this process. A few examples of basic headings are: ladies’ coats and jackets; jewellery; wine; wardrobes; and chocolate. Above the basic heading level, RRCPLs were calculated and aggregated using the Classification of Individual Consumption According to Purpose (COICOP) used in the CPI. Regional expenditure was obtained from the ONS’s Living Costs and Food Survey (LCF) and adapted to create regional weights for the 168 basic headings.
As there are no data available for the expenditure on the individual items below a basic heading, a basic heading RRCPL has to be calculated from price data only. Below the basic heading, price relatives for each pair of regions were first calculated; with five regions (London, England (excluding London), Wales, Scotland and Northern Ireland), this resulted in 25 unique price relatives. To combine the price relatives of the items at the basic-heading level, an equally weighted geometric mean of these relatives was calculated for each pair of regions.
Once the RRCPLs had been calculated at the basic-heading level, regional weights were used to aggregate the basic headings to successive COICOP levels. For each pair of regions, the basic heading RRCPLs are weighted, summed and averaged using first the expenditures on the basic headings of the first region as weights and second the expenditures on the basic headings of the second region as weights. This gave two weighted RRCPLs: a Laspeyres-like RRCPL and a Paasche-like RRCPL. The geometric mean of these two RRCPLs was then calculated, which produced a single Fisher-like RRCPL between the two regions.
Once each level of aggregation is provided with a matrix of Fisher-like RRCPLs, it was necessary to apply a method to impose transitivity on the Fisher-like RRCPLs. Transitivity is a desirable property for spatial price indices as the same result is obtained when comparing RRCPLs directly between two regions and when comparing the RRCPLs indirectly through the introduction of a third region.
The method used by Eurostat and adopted by the ONS to impose transitivity is the EKS (Èltetö–Köves–Szulc) method. The RRCPL that results from application of the EKS method (the EKS RRCPL) is defined as the geometric mean of the direct RRCPL and all the indirect RRCPLs between a pair of regions, with the direct RRCPL having twice the weight of each indirect RRCPL.
In addition to being transitive, the resulting EKS RRCPLs differ as little as possible from the original Fisher-like RRCPLs. After applying EKS, we are left with a 5x5 matrix of the bilateral EKS RRCPLs. Standardisation of the EKS RRCPLs is required in order to obtain a set of RRCPLs that has the UK as its base. This is done by dividing each RRCPL by the geometric mean of the RRCPL in its column of the matrix. This results in five EKS RRCPLs, one for each region (all the entries in each row have the same value after standardisation), with the UK as the base, where UK equals 100.
The 2018 article followed an earlier exercise in calculating RRCPLs, which was conducted in 2010 and published in July 2011. The main differences between the 2016 RRPCLs and the 2010 RRCPLs are as follows:
a different set of goods and services included in the RRCPL basket; between the six years, the basket of goods and services has evolved to ensure that it is representative of UK consumer spending
a change in the COICOP between the two outputs resulting in an additional 48 basic headings being used in the 2016 calculations; there were 120 basic headings in 2010 compared with 168 in 2016; in 2016, a number of basic headings might have been included under one basic heading for 2010, which impacts on the calculations as each basic heading has its own weight
updating of the weights and population estimates that underpin the calculations
updating of the location sample
Prior to the 2011 article, there was an exercise from 2000 that was partially updated in 2003. The earlier exercise involved a specially commissioned survey to obtain prices in a variety of locations across London and in two or three towns in the other regions of the UK. This was supplemented by a special analysis of data from the Retail Prices Index (RPI). For PPP purposes, it was not necessary to collect price-level differences for some categories of expenditure, which were either omitted from the calculation entirely or, where appropriate, assumed to have uniform national pricing. For the latter exercise, the special analysis of data from the RPI was repeated and prices were collected for those categories of expenditure where price-level comparisons were not produced in 2000.
13.9 Seasonal adjustment
Consumer expenditure on seasonal items (for example, foods and clothing) can vary significantly over the year. This type of behaviour would normally advocate the production of a seasonally adjusted series, corrected for this pattern. However, separate measures for the Consumer Prices Index including owner occupiers’ housing costs (CPIH), Consumer Prices Index (CPI) and the Retail Prices Index (RPI) are not produced for two principal reasons. Firstly, in seasonal adjustment the entry of a new month’s data can change the levels of previous months’, as the seasonal pattern is re-estimated. This violates the strict rule of never revising the CPI and RPI. Secondly, not all of the changes are due to true seasonal patterns. Many are due to the annual changes in Value Added Tax (VAT) and excise duty, as determined by government, which are not regarded as seasonal effects.
For most uses of the CPIH, CPI and RPI, which involve the annual change in the indices, this pattern has little effect, as changes over twelve months are unaffected. However, any shorter-term comparisons can be distorted by the seasonality.
13.10 The household final consumption expenditure deflator
The implied deflator for household final consumption expenditure (HHFCE) is sometimes used as a measure of inflation as it affects households. It is different from the Consumer Prices Index including owner occupiers’ housing costs (CPIH), Consumer Prices Index (CPI) and the Retail Prices Index (RPI) in both coverage and construction. The goods and services covered in total HHFCE are as defined by the European System of Accounts (ESA) 2010 and close to that used by the CPIH and CPI. Like the CPIH and CPI, they are classified via Classification of Individual Consumption According to Purpose (COICOP) and like the CPI do not include expenditure on council tax. Unlike the CPI, which does not use imputed measures, they include the estimated rent imputed to owner occupiers, which is also a component of the CPIH. Expenditure by all UK resident households is included whether within the UK or abroad. This contrasts with the CPIH and CPI, which cover spending within the UK, whether by UK or foreign nationals.
The HHFCE deflator, unlike the CPIH, CPI and RPI, is not a pure price index. It is derived (at the end of the estimation process) as the value at current prices divided by the value of the volume measure for the same products, expressed in index number form. In practice, a large number of the indices used to deflate components of HHFCE are compiled from component indices of the CPIH, weighted together to reflect the COICOP. The HHFCE deflator is thus implicitly a current weighted (that is, Paasche) index whose components are in large part CPIH component indices.
The HHFCE deflator is produced quarterly (unlike the CPIH, CPI and RPI, which are published monthly) and is available on our website.
13.11 The cost of living
The measures of consumer price inflation are specifically not intended to measure what people often refer to as “the cost of living”. In popular usage, what this means is ill defined. Some use it to mean a measure of the cost of buying sufficient quantities of various items to maintain some minimal standard of living. However, defining this standard is very subjective. Also, if the minimal acceptable standard rises over time, such an index would rise more rapidly than consumer price inflation statistics.
Another definition is an index calculated as at present but restricted to basic essentials. However, it would be difficult to reach a consensus on what constitutes “basic essentials”. For example, items such as tobacco could be included or excluded because tobacco may or may not be considered an essential item. Also, many former luxuries such as telephones are now usually considered essential.
The economic definition of the cost of living is the answer to the question “What is the minimum cost, at this month’s prices, of achieving the level of utility actually attained in the base period?” Due to the stress on the minimum cost, a cost of living index will usually give a lower rate of inflation than the consumer price inflation indices.
The Office for National Statistics (ONS) has calculated an approximate superlative index for the UK (PDF, 2.88 MB) using the Törnqvist formula for the years 2007 to 2009. Three types of substitution behaviour were set out:
upper-level substitution (between items): consumers switch between goods and services, towards those that are becoming relatively cheaper. This can be to a similar product (between apples and pears), or something very different (apples to tablet computers)
lower-level substitution (within items): consumers switch between varieties of the same item, for example, between Royal Gala and Golden Delicious apples
substitution between outlets: consumers switch between shops or type of shop – for example, corner shop to supermarket, or high street to internet
The ONS (2014) found that the difference between its superlative index and the Consumer Prices Index (CPI) was larger than that found by other countries that have produced superlative indices. This arises because we have applied the superlative index number formula down to the item level. The approximate COLI measures produced by other countries have typically applied the superlative index formula only at the higher stages of aggregation. This limits the extent to which changes in spending patterns are captured by the indices produced by other countries.
Back to table of contents14. Glossary: Terms and concepts
| Term | Concept |
|---|---|
| All-items index | An index that is constructed using price indices that represent every type of expenditure within the scope of the consumer price statistic. It is an average measure of the change in the prices of goods and services bought for the purpose of consumption in the UK. |
| Annual Business Survey | The Annual Business Survey (ABS) is the main structural business survey conducted by ONS. The ABS supplies data on sales by retailer broken down into commodity and service groups. |
| Annual Retailing Inquiry | Produced by the ONS, the Annual Retailing Inquiry supplied data on sales by shop-type broken down into commodity and service groups and then outlet type, as in, whether they are independents or multiples. |
| Back check | Where quality auditors visit outlets no later than three days after a price collection to check that the price collector has recorded the correct prices. |
| Central shops | Central shops are major chains of shops with national pricing policies. Branches of these chains are excluded from local collection as their prices are sent directly to the Office for National Statistics (ONS) by their headquarters. |
| Class | In the Consumer Prices Index including owner occupiers’ housing costs (CPIH) and the Consumer Prices Index (CPI), all categories of expenditure on which significant amounts of money are spent are arranged into 12 divisions, which are subdivided into groups and then into classes. Examples of classes are bread and cereals, water supply, and transport insurance. Price indices are published for each class. |
| Coverage | Those transactions that can be identified and measured in practice. This is determined by the expenditure categories for which weights are compiled. |
| Democratic weights | If each household had equal weight in the calculations, then the weights would be democratic. |
| Division | In the CPIH and CPI, all categories of expenditure on which significant amounts of money are spent are arranged into 12 divisions, such as clothing and footwear, transport, and recreation and culture. Price indices are published for each division. |
| Enumeration | Detailed listing of all outlets in a location, giving address, size, outlet type and range of products sold. |
| Group | In the CPIH and CPI, all categories of expenditure on which significant amounts of money are spent are arranged into 12 divisions, which are subdivided into groups. Examples of groups are food, postal services and insurance. Price indices are published for each group. In the Retail Prices Index (RPI), all categories of expenditure on which significant amounts of money are spent are arranged into 14 groups, such as food, housing and motoring costs. Price indices are published for each group. |
| Index day | Prices in the RPI are intended to reflect prices on one chosen Tuesday of the month (either the second or third Tuesday), which is known as Index Day. Index Day is therefore the day on which most prices are collected. |
| Index households | Index households are all households that are included in the scope of the RPI; these are all private households in the UK, except pensioner households that derive at least three-quarters of their income from state pensions and benefits and high-income households whose total household income lies in the top 4%, as measured by the Living Costs and Food Survey (LCF). |
| Indicator codes | Codes entered into the handheld computer by price collectors if there are any special features in the prices recorded. For example, collectors enter an S if the item is on sale or special offer. |
| Inflation rate | The percentage change on a year earlier of a price index. It is usually used to mean the all-items inflation rate. |
| Inter-Departmental Business Register | The Inter-Departmental Business Register (IDBR) is a comprehensive list of UK businesses used by government for statistical purposes. The IDBR provides retailer outlet counts which are used to determine their outlet type, as in, whether they are independents or multiples. |
| Items | An item is any type of consumer good or service that can be purchased, for example, women’s jeans. Several different brands of that item may be available, for example, women’s Levi 501s. |
| Laspeyres | A base weighted index, as in, one where the prices are combined using weights derived from data from the base period. |
| Laspeyres-type | An index such as the CPIH, CPI or RPI that has the basic characteristics of a Laspeyres index. In other words, it is a fixed base weight index, being the price of the basket at a given time as a percentage of its price on the base date. The CPIH, CPI and RPI are not true Laspeyres as the base period does not coincide with time 0 but is the most recent available 12 months. |
| Locations | Locations are clusters of enumeration districts, broadly representing a central shopping area. Since 1995, out-of-town shopping centres have been included. |
| Outlets | An outlet is anywhere from which goods or services can be purchased. For most items, it is usually a shop or market stall. However, for some items, outlets include restaurants, pubs, solicitors’ offices or a sole trader operating from home. |
| Pensioner households | Households where the head of the household is retired and economically inactive and where the household derives at least three quarters of its income from state pensions and benefits. |
| Percentiles | The nth percentile of a distribution is the number such that n% of items in the distribution is less than that figure. |
| Products or varieties | These are the varieties of goods or services available within an item specification. For example, there are several different firms producing automatic washing machines, each firm produces a number of models each with different specifications, but they are all automatic washing machines. |
| Regional central shops | Regional central shops are chains of shops without a national pricing policy but for which it can be assumed that prices collected in a branch in one region apply to all the branches in that region. |
| Representative items | Representative items are those items that are in the basket of goods and services. |
| Sampling frame | A complete list of the objects to be sampled, together with sufficient information on each object to stratify if required. |
| Scope | All those transactions that one would ideally want to measure. |
| Section | In the RPI, all categories of expenditure on which significant amounts of money are spent are arranged into 14 groups, subdivided into about 85 sections. Examples of sections are bread, cigarettes, postage, footwear and rail fares. Price indices are published for each section. |
| Strata (stratum) | Strata are classifications that the raw data can be separated into. In the case of the CPIH, CPI and RPI, the strata used are region and shop type within item. The data within each stratum are combined, and the resulting indices for each of the strata are then combined using stratum weights. |
| Subventions to income | These are when transfer payments that are given to consumers (for example, housing benefit) appear to reduce the price of an item for the consumer but are in fact an increase in income. |
| Tukey algorithm | The Tukey algorithm identifies and invalidates price movements that differ significantly from the norm. |
| Weight | A factor by which a component is multiplied to reflect the level of consumers’ expenditure on that component. |
Download this table Terms and concepts
.xls .csv15. Appendix 1: Historical background to the development of consumer price indices in the UK
Cost of living index
Although there were occasional official comparisons of prices for food in the late 19th century and early 20th century, the government first began a systematic, continuous check on the increase in the cost of living in 1914. From July of that year, the Board of Trade instituted a regular monthly inquiry into the retail prices of the principal items of working-class family expenditure, publishing the percentage change each month in its Gazette. The published figures initially related only to food prices but after June 1916, the index was expanded and calculated retrospectively to cover clothing, fuel and some other items.
The new index was accepted as a valuable aid towards protecting ordinary workers from what were initially expected to be temporary economic consequences of the First World War. The information used for weighting together the components of the index was crude in the extreme, based on data obtained from a 1904 survey of urban working-class household expenditure. Moreover, it was influenced by highly subjective assessments of what constituted legitimate expenditure for a working-class family; beer was completely excluded, and the weight used for tobacco was much less than the actual proportion of expenditure on tobacco.
Between the World Wars
This cost of living index, with unchanged weights, was produced throughout the 1920s and 1930s. Criticism mounted, especially in relation to its out-of-date weights (by the 1930s, candles and lamp oil were grossly over-weighted, while electricity was completely excluded, and readymade clothing was under-weighted). In 1936, the Ministry of Labour announced the introduction of a large-scale household expenditure inquiry to update the weights; this was carried out in 1937 to 1938. However, by the time the results became available, war had broken out and further action on the revisions was deferred until the war had finished.
After World War 2
In 1946, the Cost of Living Advisory Committee was set up. An interim report in 1947 advised that as a short-term measure, the results of the 1937 to 1938 expenditure inquiry should be used to update the weights until a new inquiry, reflecting vastly different post-war spending patterns, could be carried out. The report also recommended fundamental changes in the selection and number of representative items for which prices should be collected, as well as the removal of the name “cost of living index” and the associations it implied. This new index, the Interim Index of Retail Prices, started in June 1947 and continued (with some minor modifications and a re-basing in January 1952) to January 1956. The new index laid many of the foundations for the way the modern Retail Prices Index (RPI) is compiled.
By early 1955, sufficient information from the Household Budget Inquiry became available to allow the Committee to formulate a new index. This became the first official RPI and began in January 1956. Among the changes brought in at this stage were:
expansion of scope of households included in the RPI from working-class households to all wage earners, but it excluded very high- and low-earning households
a firm definition of the RPI for the first time
a definition of the scope of the index in terms of which goods and services should be included
a new structure for spending categories that, by and large, continued to 1987
the first serious attempt to measure owner occupiers’ housing costs
The Committee also recommended that the Household Budget Inquiry should become a continuous survey. This led to the creation of the regular Family Expenditure Survey (FES), from 1957. Once the survey was established, the weights could be revised annually. This process, which continues to the present day, began with a re-basing of the RPI in January 1962. A new Expenditure and Food Survey (EFS) was launched in April 2001 to replace the FES and the National Food Survey. This is now known as the Living Costs and Food Survey (LCF).
The 1960s and 1970s
Various minor changes were made to the Retail Prices Index (RPI) through the 1960s and 1970s, including:
introduction of a “meals out” group (now called “catering”) from 1968
construction of separate “pensioner” indices from 1969
several changes to the methods of calculating owner occupiers’ housing costs, including the introduction of a new method for calculating mortgage interest payments from 1975
introduction of “seasonal” weights for fresh fruit and vegetable items from 1975
introduction of the Tax and Price Index (TPI) in 1979
The 1980s
A new advisory committee was convened in the early 1980s to review the Retail Prices Index (RPI). It produced a wide-ranging report in 1986, which led to many changes to the RPI from January 1987, when it was again rebased. Their recommendations largely form the basis of today’s RPI, including the definition, scope and coverage, treatment of subsidies and discounts, and treatment of owner-occupiers’ housing costs. In 1989, the responsibility to produce the RPI moved from the Employment Department to the newly re-organised Central Statistical Office (CSO).
The 1990s
Two further advisory committees met during the 1990s, leading to the introduction of a component for foreign holidays from 1993 and UK holidays from 1994. The latter committee produced a report in 1994 that led to the introduction of a new element of owner occupiers’ housing costs, the “depreciation costs” component, from January 1995. At the same time, the collection of prices was contracted out to a market research company (previously, it had been carried out by civil servants from the Employment Service). In 1996, the Central Statistical Office (CSO) became part of the new Office for National Statistics (ONS).
Two new indices based on the same data that are collected for the RPI were also introduced. These were RPIY (RPI excluding mortgage interest payments and indirect taxes) and the Harmonised Index of Consumer Prices (HICP), which were first published in 1995 and 1997 respectively. The HICP was developed as a comparable measure of inflation across EU member states and is specified in a series of legally binding European regulations.
2000 onwards
The Harmonised Index of Consumer Prices’ (HICP’s) coverage of goods and services was extended in stages in the areas of health, education, childcare and insurance, with effect from the January 2000, 2001 and 2002 indices, respectively. In 2000, there was also a change to the population base for the weights, which was broadened from private households to include expenditure by foreign visitors and residents of institutional households.
In 2003, the HICP was renamed the Consumer Prices Index (CPI) to reflect its new role as the main UK domestic measure of inflation.
In 2006, CPIY was introduced together with CPI-CT (CPI at constant tax rates).
The Statistics and Registration Service Act 2007 established new arrangements for the governance of the Retail Prices Index (RPI). Proposed changes now require the approval of the Chancellor of the Exchequer if deemed materially detrimental by the Bank of England.
In 2009, the Consumer Prices Advisory Committee (CPAC) was established to provide advice to the UK Statistics Authority on methodological issues and improvements relating to the CPI and RPI.
Between 2010 and the latest publication of this manual, the following changes have been introduced:
2010:
the use of an average effective rate instead of the standard variable rate in the measurement of mortgage interest payments (MIPs) in the RPI
the way in which prices of seasonal items are measured within the CPI and RPI changed
2012:
the measurement method for new car prices, which changed from an approach that used “list” prices to an approach based on using transaction prices from car dealer websites
coverage of the CPI was extended to include TV licence fees, vehicle excise duty and trade union subscriptions
2013:
the CPIH, a measure of UK consumer price inflation that includes owner occupiers’ housing costs, was added to the suite of indices
RPIJ, an improved variant of the RPI that is calculated using formulae that meet international standards, was also added to the suite of indices, but it was subsequently discontinued in 2017
data from the Valuation Office Agency plus comparable data from the Welsh and Scottish governments replaced data collected by the Office for National Statistics’s (ONS’s) price collectors in measuring private rental prices
2014:
- the Smith review on the governance of price statistics recommended the creation of two advisory panels on consumer prices (APCPs): a stakeholder panel to advise the National Statistician on the uses and application of price indices, and a technical panel to provide advice on the technical aspects of the statistics.
2015:
private rents and owner occupiers’ housing costs estimates were improved (and recalculated back to 2005 within the CPIH)
improved technology was introduced to assist the local collection process
the stakeholder and technical APCPs began meeting
UK Consumer Price Statistics: A Review, led by Paul Johnson, was published giving several recommendations regarding the future of consumer price statistics in the UK
2016:
a pilot study was initiated to improve to the sampling frame used to define the location boundaries for the suite of consumer price statistics
new location boundaries are rolled out under the new method annually
2017:
housing components in the RPI were moved to being calculated using an arithmetic mean counterpart of the new UK House Price Index (HPI)
the double chain-link method used in the CPI and CPIH was improved to ensure it would be mathematically equivalent to a single chain-link; this involved utilising two sets of weights each year, price updated to different periods
a lower level of classification was introduced to the Classification of Individual Consumption According to Purpose (COICOP) hierarchy (COICOP5), sitting between the class level (COICOP4) and item level (a bespoke ONS level); this enabled comparisons across Europe at a more detailed level
council tax was introduced into the CPIH and the series was revised back to 2005 to incorporate this as well as improve the weights for owner occupiers’ housing costs
several RPI-related indices ceased to be produced as they no longer met user needs
2018:
- temporal sampling was introduced for certain volatile items (namely, fruit and vegetables) in the CPIH and CPI; this increased the number of days within the month that prices could be collected on
2019:
- the mobile phone charges methodology was improved to account for in-year increases by contract providers who annually uprate prices by a measure of inflation
2020:
annual updating of shop-type weights was reintroduced as part of the annual basket update, which historically used data from the Annual Retailing Inquiry; these weights are now based on Annual Business Survey data matched against store counts in the Inter-Departmental Business Register to allow stratification between multiple and independent retailers
temporary processes were introduced to maintain the continued production and quality of consumer price statistics during the coronavirus (COVID-19) pandemic, as detailed in our Coronavirus and the effects on UK prices article
2021:
- we made changes to the way annual weights are constructed, better reflecting the ongoing effects of the pandemic on consumer expenditure patterns
2022:
- we introduced stratum weights for the calculation of domestic and short-haul air fares, to align with the methodology used for long-haul fares
2023:
- rail fare price indices were transformed to include new data and methods, and details of this transformation are provided in Section 10.2: Rail fares
2024:
- we introduced private rents and second-hand cars transformations simultaneously, to include new data and methods; details of these transformations are provided in Section 10.3: Rental prices and second-hand cars within Section 10: Introducing new data sources
2025:
we made changes to our aggregation structure, in particular the introduction of consumption segments to allow combined aggregation of alternative and traditional data
improvements to the way that base prices are imputed, including reducing the imputation lag from two months to one month and using a more appropriate index to impute for CPI and CPIH
improvements to the way that missing base prices for out of season items are imputed (described in more detail in section 9.5)
we have expanded the private rents transformation introduced in 2024 to also include transformed indices for Northern Ireland. This also affects the rental equivalence measure used in CPIH
we have expanded the coverage of gas and electricity items to include fixed-rate tariffs in addition to variable-rate tariffs
Price indices in the UK continue to evolve and to face the challenges of products that are more complex, both in their attributes and in the ways in which they are sold and priced. The ONS conducts a continuous programme of research designed to maintain the relevance of the CPI and other price indices in relation to changing consumer spending patterns and product market developments, and to ensure that price changes across the range of goods and services represented in the indices are estimated according to best statistical practices.
Back to table of contents16. Appendix 2: Abridged characteristics of the different measures of consumer price inflation
| Characteristic | Description | Key considerations in relation to use | CPI | CPIH | RPI |
|---|---|---|---|---|---|
| Population base | Population covered by the indices | CPIH and CPI, compared to RPI, have a different population base. This difference may be considered more or less desirable depending on use. Some users have informed us that they prefer a measure of price inflation that excludes the highest earners and pensioner households mainly on state benefit to use for wage negotiations. Conversely, other users prefer the wider coverage provided by the CPIH and CPI. | Includes expenditure by private and institutional households in the UK and includes expenditure by foreign visitors to the UK. | Includes expenditure by private households but excludes households whose income lies within the top 4% of the income distribution and pensioner households with at least three-quarters of their income coming from state pensions and benefits. | |
| Expenditure data (or weights) | Source of the expenditure data used to calculate the weights | The CPIH and the CPI, compared to the RPI, have a different source of expenditure data. | Expenditure data (or weights) used to represent the population are derived in the main from the HHFCE component of the UK national accounts. The weights are based on expenditure within the domestic territory by all private households, foreign visitors to the UK and residents of institutions (such as nursing homes, retirement homes and university halls of residence). | Expenditure data (or weights) used to represent the population are derived in the main from our LCF. The RPI weights relate to expenditure by private households only, excluding the highest-income households and pensioner households mainly dependent on state benefits. | |
| Commodity coverage | The goods and services included in the indices | The RPI and CPIH both include a component for owner occupiers’ housing costs. As well as housing components, the CPIH and RPI both include council tax. Both components may be considered more or less desirable depending on the use. | Covers several items excluded from the RPI, including university accommodation fees and foreign students’ tuition fees. However, the CPI excludes owner occupiers’ housing costs and council tax, which are included in CPIH and RPI. | Covers several items excluded from the RPI, including university accommodation fees and foreign students’ tuition fees. | Covers several items, including: - mortgage interest payments - house depreciation - buildings insurance - ground rent - other house purchasing costs such as estate agents’ and conveyancing fees |
| Historical time series | Available time series | The RPI has a longer series of data than the other two inflation measures. The length of the available back series may be an important consideration in regard to use. | Launched in 1996. A historical time series is available from 1988. | Launched in March 2013. A historical time series is available from 2005 and a long-run back series is being developed. | Launched in 1947 with the first official estimates being produced in January 1956. |
| National Statistics status | Status of the statistics in accordance with the Code of Practice for Statistics | The National Statistics status of the statistics, which indicates whether a statistic is compiled in accordance with the Code of Practice for Statistics, should be an important consideration for users. | National Statistics. The CPI was reassessed against the Code of Practice for Official Statistics in 2013 and the UK Statistics Authority confirmed its designation as a National Statistic subject to us implementing a number of enhancements. | National Statistics. The CPIH was reassessed against the Code of Practice for Official Statistics in 2016, and the UK Statistics Authority re-designated CPIH as a National Statistic in July 2017. | Official Statistics. The RPI was assessed against the Code of Practice for Official Statistics in 2013, and the UK Statistics Authority cancelled its designation as a National Statistic because of the findings that: - the methods used to produce the RPI are not consistent with internationally recognised best practices - the decision to freeze the methods used to produce the RPI and only to contemplate routine changes |
| Governing legislation | Legislation regulating the production of the indices | Legislation may be an important consideration for some users. | Governed by a series of legally binding regulations drafted by the European Commission (Eurostat) in conjunction with EU Member States. The UK can only make certain changes to the CPI within the bounds of the European regulation. | No governing legislation at present as in common with many Official Statistics. This allows us to produce the index in line with UK needs and statistical considerations. | Governed by the Statistics and Registration Services Act 2007. Any methodological changes to the RPI requires the approval of the UK Statistics Authority Board before being referred to the Bank of England. If the Bank of England considers the change fundamental and materially detrimental to the interests of the holders of certain index-linked gilts, then the consent of the Chancellor of the Exchequer is also required. |
| Elementary aggregate formulae | Formulae used to combine prices at the first stage of aggregation called the "elementary aggregate". In the UK there are 3 main formulae used; 2 of these use arithmetic averages (means) known as the Dutot (or ratio of average prices) and the Carli (or average price relatives). The third formula is a geometric average called the Jevons. | In constructing consumer price indices most statistical institutes choose between 2 formulae, the Dutot or Jevons. The RPI also uses the Carli formula. The Carli formula used to produce the RPI does not meet international standards and in early 2013 the RPI status as a National Statistic was cancelled because of this. This should be an important consideration for users of these statistics. | Jevons – roughly two-thirds of the index Dutot – around 5% of the index Other or weighted formula – roughly one-third of the index | Carli – roughly one-third of the index Dutot – roughly one-third of the index Other or weighted formula - roughly one-third of the index | |
| Price collection | The timing of the price collection | The approach to the collection of prices may be a consideration for the indices’ users. | Intended to reflect prices over at least 1 working week at or near the middle of the reference month. In practice the collection is the same as the RPI collection except for petrol and oil, and fruit and vegetables. Prices for petrol and oil can exhibit particularly volatile price movements and for the CPIH and CPI are averaged over the month, based on the prices prevailing on each Monday during the month. Fruit and vegetables also exhibit volatile price movements so additional price quotes are collected over more than one working week. | Intended to reflect prices on a particular day of each month (Index Day). In practice the collection is the same as the CPIH and CPI except for petrol and oil, and fruit and vegetables, which are also collected on Index Day in the RPI. | |
| Revisions | The process of revising inflation figures once published. | The CPIH and CPI can, in theory, be revised over time. However, this almost never happens in practice. The RPI is not revised once published. The revisions approach may make the indices more or less desirable. | CPI indices are revisable although the only time the CPI all items index has been revised was when the index was re-referenced; first in 2005, which took place with the publication of the January 2006 indices, and again in 2015, which took place with the publication of the January 2016 indices. | The revisions policy for the CPIH is the same as that used for the CPI. In 2015 the OOH component in CPIH was revised to align with historical national accounts estimates, and to reflect planned changes to the measurement of imputed rents in the Blue Book 2016. In 2017 CPIH was revised to incorporate council tax and revised weights for owner occupiers’ housing costs. In both cases, the full back series was revised. From this point we do not expect to make further revisions. | Once the RPI indices are published they are never revised. |
| Rounding | How and where rounding is used in the indices | The approach to rounding may be a consideration for the indices' users. | Monthly and 12-month rates of change are calculated using unrounded indices. | Monthly and 12-month rates of change are calculated using published indices, and so are based on estimates to 1 decimal place. | |
| Product coding | Classification system used for the aggregation and publication of results | The number of categories published or how products are grouped together may be considered as part of the indices’ use. | Based on an internationally recognised system classifying household expenditures, known as the Classification of Individual Consumption According to Purpose (COICOP). | Based on a long- standing classification system unique to the UK, specified and developed by the RPI Advisory Committee. | |
| Insurance | The treatment of insurance | The approach to how insurance is calculated may be a consideration for the indices’ users. | The amount of expenditure on insurance premiums is distributed amongst other expenditure categories according to the nature of the claim. Only the service charge is allocated to the relevant insurance heading. | All expenditure on insurance is considered to belong to the relevant insurance heading (such as housing or motor insurance premiums). | |
| Owner occupiers’ housing costs (OOH) | The treatment of costs of housing services associated with owning, maintaining and living in one’s own home. OOH does not include costs such as utility bills, minor repairs and maintenance which are already included in the consumer price inflation statistics. | The CPIH and the RPI use a different method to measure OOH costs. The approach used to measure OOH may be important for some users. | OOH is excluded from the CPI | Measured using the rental equivalence approach, which uses the rent paid for an equivalent house as a proxy for the costs faced by an owner occupier. The data used to compile the series are available from 2005 onwards for England. For Wales and Scotland, data is available from 2009 and September 2010 onwards respectively. Before this, the CPI/RPI unfurnished private rent series for Wales and Scotland have been used to calculate OOH. The CPI/RPI unfurnished private rent series for Northern Ireland is used in all years. | Measured using a variant of payments approach which includes mortgage interest payments (MIPs), house depreciation, buildings insurance and other house purchasing costs, such as estate agents and conveyancing fees. Both the weight and price changes for MIPs are modelled to estimate the interest payment on a standard dwelling for an average household. |