1. Overview
Alternative data sources, and methods to use these data sources, are being introduced from 2023, as detailed in our Transformation of consumer price statistics: April 2022 article.
In 2021, we obtained access to daily vehicle listings data from the largest digital automotive marketplace in the UK, Auto Trader, dating back to January 2018.
This article details our proposed methodology for these second-hand cars data to be implemented in the Consumer Prices Index including owners occupiers’ housing costs (CPIH) and the headline Consumer Prices Index (CPI); details on existing methods can be found in our Consumer Prices Indices Technical Manual, 2019.
The research indices presented in this article are broadly in line with the trends seen in our published data, highlighting the quality of our historic measurement of overall second-hand car inflation; however, with these new data, we can produce more granular statistics, which offer additional insights into the components driving second-hand car inflation in the UK.
This work also ensures that any future changes in pricing policies in the second-hand car market are more appropriately captured, and that the methods and systems that have been developed can be used to onboard further data sources in future (such as electronic point of sale scanner data), as part of our programme of continuous improvement.
If we had used these data and methods between February 2018 and February 2022, there would have been minimal impact on the headline rate for CPIH and CPI, but our understanding of what was driving price changes in this category would have been substantially improved.
We plan to introduce these changes in our CPIH and CPI calculations in February 2023, published in March 2023.
2. Background to using second-hand car prices in consumer price statistics
Accurate measurement of price changes in the second-hand car market is challenging because cars depreciate as they are used. The same car in January 2021 and December 2021 are not comparable. As an older car has typically travelled more miles, there is usually a decline in quality.
Our current method involves pricing a sample of 35 models of cars aged one, two and three years, using retail prices from a trade guide. January prices are taken straight from the guide, but in subsequent months, prices are interpolated for cars aged two and three years to ensure that cars of the same age and mileage are priced each month. More information on our current method can be found in the Purchase of motor vehicles section of our Consumer Prices Indices Technical Manual, 2019.
The transformation discussed in this article regards the price index for second-hand cars only. The calculation of weights for the second-hand cars category remains unchanged. These weights are subject to the annual updating of the inflation basket and are calculated based on net sales to exclude household to household transactions.
In 2022, second-hand cars have a weight of 20 parts per thousand (2%) in Consumer Prices Index including owner-occupiers' housing costs (CPIH), and 25 parts per thousand in Consumer Prices Index (CPI) (2.5%).
Back to table of contents3. Aims of new data and methods
The proposed methodology will offer key improvements, including:
an increased product coverage, improving the representativity of our second-hand cars index and allowing for the calculation of more granular indices
the daily delivery of data will provide the most up to date price movements possible, and therefore be responsive to fluctuating economic activity, seasonal patterns, and consumer behaviour, such as the increasing ownership of electric cars
more precise information on two of the key variables related to the price of a second-hand car (mileage and age)
The methodology proposed in this article relates to our current research indices, which may be subject to minor alterations. Our final methodology and impacts will be published in November 2022.
Back to table of contents4. New second-hand car listings data
In 2021, we obtained access to data for second-hand cars, dating back to January 2018, from Auto Trader, the UK's largest digital automotive marketplace. These data are web-provided, so no explicit data on sales or revenues are available.
While the business is primarily an advertising business, with retailing today occurring offline between forecourts and car buyers, it is currently the number one vehicle website in the UK. Comscore has calculated they have a 75% market share for online automotive web traffic.
The data are received daily, and encompass both trade and private sales. Auto Trader partners with approximately 14,000 car dealerships in the UK.
The data include variables such as the:
date and advertised price
type of vehicle (such as car, van, or motorbike)
condition (new, nearly new, and used)
mileage
year of registration
make of vehicle
model of vehicle
mark
trim
engine size
fuel type
body type
number of doors
5. Proposed methodology
Data classification and filtering
The data are inclusive of products that are not directly relevant for producing a second-hand cars price index, such as vans and motorbikes. These have therefore been filtered from the data.
We have also omitted outliers with regards to price or characteristics; for example, we are excluding any cars that have a mileage of "99999999" and excluding any non-car body types such as "minibus".
The filtering process leaves us with 65% of the data remaining when only considering unique listings (see Figure 1). Further details regarding the data cleaning carried out prior to producing the analysis in this article were discussed with the Technical Advisory Panel on Consumer Prices in January 2022.
Figure 1: Proportion of data excluded through each filtering step
Data removed at each stage of the data filtering process, using car listings data for the UK, January 2018 to February 2022
Source: Office for National Statistics – Using Auto Trader car listings data to transform consumer price statistics, UK
Notes:
- Each bar in Figure 1 relates to the data remaining, the data removed at the specified filtering step, and the data that have already been removed in previous filtering steps, expressed as a percentage of the total. For example, when filtering for second-hand cars , 9% of the data had already been removed as they were not cars, and a further 5% are now removed because they are not second-hand cars. This leaves us with 86% of the data remaining.
- “Non-outliers” includes filtering on price, mileage and age of car.
Download this chart Figure 1: Proportion of data excluded through each filtering step
Image .csv .xlsUnique Listings
As the data are received daily, and a vehicle is listed for an average of 40 days, this still leaves multiple listings for each unique vehicle within the dataset. As the listing price can increase or decrease over time, despite no sale being made, we filter the data to the latest listing price available, as this will be the closest approximation to the final sale price of the car.
The difference between monthly listings for all the data and unique monthly listings, when all filters are applied, can be seen in Figures 2 and 3. There is a seasonal increase in the number of car listings in December months, and an increase in listings during the first months of the coronavirus (COVID-19) pandemic. However, there are less cars leaving the market, so it is likely that less cars are being sold in these periods. By dropping the dataset to the latest unique listing, we are approximating the final sale price.
Figure 2: Monthly row count for all second-hand car listings
Number of monthly second-hand cars listings received by the Office for National Statistics, UK, January 2018 to February 2022
Source: Office for National Statistics – Using Auto Trader car listings data to transform consumer price statistics, UK
Download this chart Figure 2: Monthly row count for all second-hand car listings
Image .csv .xls
Figure 3: Monthly row count for all unique second-hand car listings
Number of monthly unique second-hand cars listings received by the Office for National Statistics, UK, January 2018 to February 2022
Source: Office for National Statistics – Using Auto Trader car listings data to transform consumer price statistics, UK
Notes:
- The filtering described in Figure 1 has been applied to produce these row counts.
Download this chart Figure 3: Monthly row count for all unique second-hand car listings
Image .csv .xlsListings can leave the data and quickly return for several reasons, for example, if an intended car sale was not completed. If we were to take the price as soon as the car leaves the market, we may inadvertently capture price changes for cars that have not been sold. We therefore introduce a short window where cars can be reintroduced before we consider them as "sold".
Our analysis shows that a four-day window after a listing has left the data provides a sufficient gap for capturing reintroductions. Any cars that return to the market within a four-day window of leaving are treated as unsold and not used in the index calculation. Therefore, our indices are produced on a total of a five-day lag; we receive the data daily with a day lag, and then we use a four-day gap before considering a listing "sold" to produce our index.
Defining a product
Unlike scanner data, these second-hand cars data do not have a barcode or similar product identifier that we can use to track price change over time. Also, because cars are typically only sold once within our measurement window, we cannot compare the price of the car being sold to the price of the same car previously sold.
We therefore define a product using several variables within the data, but this results in a challenging trade-off. If our product definition is too narrow, for example by using a unique car, our price index will suffer from a lack of available matching products to compare the price with. If our product definition is too broad, for example not accounting for the age of car, we may allow compositional effects to affect the resulting indices; in one month, there may be an increase in newer cars compared with the previous month, and this could result in a disingenuous price increase. This challenge is discussed in the context of clothing in our Product grouping: measuring inflation in dynamic clothing markets article.
We assessed different combinations of variables in defining a unique product for second-hand cars and discussed the suitability of these with the Technical Advisory Panel on Consumer Prices in January 2022. To determine the most appropriate product definition, we used the match adjusted R squared (MARS) method, as described by Chessa (2019; PDF, 860KB). The MARS method identifies the product definition that balances having products that are narrowly enough defined that compositional biases are minimised, but broadly enough defined that products can be matched like-for-like with comparable products through time.
As a result of the MARS analyses, as well as an internal agreement that the chosen variables are intuitive, we propose that we use a product definition that combines variables:
age (for example, aged 1 to 2 years)
fuel type (for example, diesel)
make (for example, Ford)
model (for example, Fiesta)
mark (for example, Mk 8)
engine size (for example, 1.4 litres)
mileage (for example, 20,000 to 30,000 miles)
transmission (for example, manual)
body type (for example, hatchback)
The average price is calculated each month for each product definition, and is then tracked over time to produce a price index.
Index methods
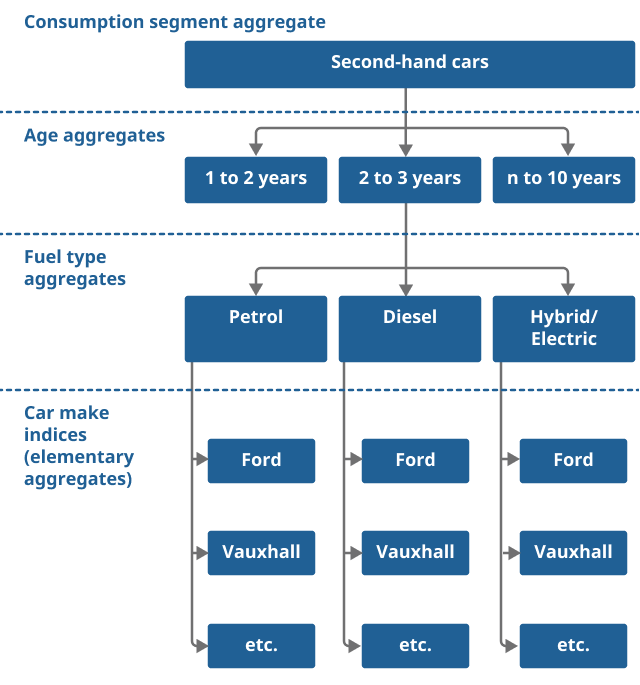
To aid interpretation of the second-hand cars price index, we produce elementary aggregate indices, stratifying by age, fuel type and make, as shown in Figure 4.
Figure 4: New, detailed hierarchy for second-hand cars
Source: Office for National Statistics – Using Auto Trader car listings data to transform consumer price statistics, UK
Notes:
Currently consumer price indices are published for 2- and 3-year-old cars. We will now calculate indices for more ages of cars but aggregate these into a single index for publication. At the stratification stage we use 1–10-year-old cars to produce the new indices.
Download this image Figure 4: New, detailed hierarchy for second-hand cars
.png (33.4 kB)
Our New index number methods in consumer price statistics article, and corresponding international guidance, has pointed towards multilateral methods being most appropriate for producing elementary aggregate price indices using large, dynamic datasets.
A GEKS-Törnqvist index using a mean splice on the published series with a 25-month window is used for calculation of car make (elementary aggregate) indices. The process for choosing this method is discussed further in our Research and developments in the transformation of UK consumer price statistics: June 2022 article. For second-hand cars, product level weights are calculated based on the number of unique cars that satisfy each product definition, so more popular cars will receive a greater weight within the index.
Consistent with our traditional practices of construction, above the elementary aggregate level, we use a Lowe formula to aggregate to higher levels. Aggregated indices for second-hand cars are weighted together using the previous year (y minus 1) quantity shares from within the data (as no expenditure shares are available). For the first year of this impact analysis, where no historic data are available, they are based on the first year (y).
As each unique car registration is only sold once, we are considering whether we can use the sum of prices to determine expenditure shares and use those in place of quantity shares. If we find this method to be suitable, this will be updated in our next publication in November 2022.
Back to table of contents6. Results: price indices using new data and methods
Comparing new and published indices for second-hand cars
Figure 5 shows the annual growth rates for our currently published second-hand cars index, compared with the annual growth rate for the index produced using new data and methods between January 2019 and February 2022. Broadly, the growth rates have a similar trend throughout this period, though the new index shows less volatility.
Figure 5: Comparison of annual growth rates using new methods and data with the published second-hand cars series
UK, January 2019 to February 2022
Source: Office for National Statistics – Using Auto Trader car listings data to transform consumer price statistics, UK
Download this chart Figure 5: Comparison of annual growth rates using new methods and data with the published second-hand cars series
Image .csv .xlsFigure 6 shows the cumulative effect of these differences on the indices between January 2018 and February 2022. As we saw with the growth rates in Figure 4, broadly, the indices show similar trends throughout this time period. Cumulatively though, the index based on new data and methods shows marginally lower inflation across the full window.
Figure 6: Comparison of second-hand cars index using new methods and data to the published series, Jan 2018 = 100
Index produced using the new data and methods compared with the published index for the UK, January 2018 to February 2022
Source: Office for National Statistics – Using Auto Trader car listings data to transform consumer price statistics, UK
Download this chart Figure 6: Comparison of second-hand cars index using new methods and data to the published series, Jan 2018 = 100
Image .csv .xlsAge aggregates for second-hand cars
The new indices are inclusive of a huge variety of different ages and models of cars, fuel types and mileages. These differences in the data and methods naturally lend themselves to different results.
Of particular interest here is the age of the car as, while our current sample captures a range of makes and models, it is restricted to only cars that are two or three years old. Figure 7 shows indices for each age group of cars used in the new data.
Figure 7: Stratum indices for different ages (in years) of car
Indices for all age groups used to produce the new index, UK, January 2018 to February 2022
Source: Office for National Statistics – Using Auto Trader car listings data to transform consumer price statistics, UK
Download this chart Figure 7: Stratum indices for different ages (in years) of car
Image .csv .xlsFigure 7 shows lower inflation for cars aged 6 to 10 years over this period. Our current published index is produced based on prices of cars aged two and three years, whereas our new index incorporates a broader range of car ages. This may explain some of the difference between the new and current indices seen in Figure 5. However, these older age brackets are not weighted as highly as newer age brackets when producing our new index.
Fuel-type aggregates for second-hand cars
Figure 8 shows that second-hand, diesel cars aged two to three years have a marginally lower rate of inflation between January 2018 and February 2022 compared with second-hand petrol cars of the same age. Second-hand electric and hybrid vehicles aged two to three years have experienced a substantially lower rate of inflation over the period.
Figure 8: Fuel type aggregate indices, within strata aged two to three years
Aggregate indices for all fuel-types, UK, January 2018 to February 2022
Source: Office for National Statistics – Using Auto Trader car listings data to transform consumer price statistics, UK
Download this chart Figure 8: Fuel type aggregate indices, within strata aged two to three years
Image .csv .xlsThese categories for age, fuel type and car make give us more insight into the underlying drivers of inflation; this is harder to achieve with our current method. It will allow us to understand in more detail what is affecting the aggregate indices for second-hand cars.
Impact of new data and methods for second-hand cars on headline consumer price statistics
To show the impact of these new data and methods had we introduced them sooner, we have produced a revised Consumer Price Index including owners occupiers’ housing costs (CPIH) index using the updated index values. This is indicative, and the CPIH and Consumer Price Index (CPI) will not be revised as we introduce these new data and methods into our published figures from 2023.
The aggregate index for CPIH (Figure 9) was produced between January 2017 and February 2022, including the new second-hand cars index from February 2018 onwards. This means growth rates in the year of introduction can be seen as well as annual growth in the years following introduction. The new index is aggregated together with the published series using the existing annual weights and chain-linking methodology. More information is available is available in our Consumer Prices Technical Manual, 2019.
Figure 9: Impact of new data and methods for second-hand cars on CPIH annual growth rate (%)
Impact of new data and methods on CPIH annual growth rate, UK, January 2017 to February 2022
Source: Office for National Statistics – Using Auto Trader car listings data to transform consumer price statistics, UK
Download this chart Figure 9: Impact of new data and methods for second-hand cars on CPIH annual growth rate (%)
Image .csv .xlsWhile our new index for second-hand cars shows a slightly lower rate of inflation than our currently published index, the impact on our headline CPIH indices because of this change would be marginal, even in the year of introduction. The maximum difference is 0.1 percentage points, and this is also the maximum impact on CPI.
Since March 2020, there have been several unavailable items that have been imputed in some periods based on price movements of the headline index. For this impact analysis, we haven't recalculated these imputations because of the complexity of their calculations. However, we would expect the impact of recalculating imputations to be negligible. This is based on the minimal impact of these new data and methods on the headline indices, and because imputations were designed to have a negligible impact on the headline rate. Our Coronavirus and the effects on UK prices article provides further detail.
Back to table of contents7. Future developments
Following our publication of the final impacts in November 2022, a decision will be made as to whether we move these new data and methods into use in live production of Consumer Price Index including owners occupiers’ housing costs (CPIH) and Consumer Price Index (CPI). If we are satisfied that our data, methods and systems are ready for live monthly production of these indices, the first time they will be introduced is in the figures for February 2023, published in March 2023. The CPIH and CPI will not be revised.
Our broader plans to transform UK consumer price statistics by including new improved data sources and developing our methods and systems for production from 2023 are discussed in our Transformation of consumer price statistics: April 2022 article.
Back to table of contents