1. Foreword by the National Statistician
The issue of measuring inflation is hugely important and, either directly or indirectly, affects individuals and businesses throughout the UK. It is the role of the Office for National Statistics (ONS) to develop good measures of changing prices and costs that are suitable for a wide variety of uses.
This document summarises the analysis that has been done to offer a clear view on our current understanding of the drawbacks of the Retail Prices Index (RPI). Overall, RPI is a very poor measure of general inflation, at times greatly overestimating and at other times underestimating changes in prices and how these changes are experienced.
In 2013, the RPI lost its status as a National Statistic. Our position on the RPI is clear: we do not think it is a good measure of inflation and discourage its use. There are other, better measures available and any use of RPI over these far superior alternatives should be closely scrutinised.
It has often been asked why the ONS does not change the RPI to address its weaknesses?
Firstly, it is important to recognise that the problems with RPI are many: it is not just the use of the Carli formula that is a concern. The main body of this document explains these challenges.
A second reason stems from a consultation undertaken by the then National Statistician in 2012, when the option of changing the RPI was raised. That consultation concluded “there is significant value to users in maintaining the continuity of the existing RPI’s long time series without major change, so that it may continue to be used for long-term indexation and for index-linked gilts and bonds in accordance with user expectations”. This statement is important, reflecting that some users valued the continuity of the index, despite its flaws.
Ongoing work by the ONS and others has strengthened the case against the RPI, and the evidence suggests it is likely to overstate inflation. It is not possible to be precise about the extent of any upward bias as there is no single perfect measure to benchmark it against. When we compare it to other measures, however, we find the RPI inflation rate is currently around 1 percentage point higher than the CPIH and the experimental Household Costs Indices.
The course on which ONS has embarked has therefore been two-fold:
developing a set of measures that better captures the changing prices and costs faced by consumers and households; that approach, encompassing measures such as the Consumer Prices Index including owner occupiers’ housing costs (CPIH) and the Household Costs Indices, is set out in a separate article
discouraging the use of RPI, while recognising the legacy needs
For the reasons set out in this document, RPI does not have the potential to become a good measure of inflation.
John Pullinger
National Statistician
Back to table of contents2. Background
In recent years, the Retail Prices Index (RPI) inflation rate has been around 1 percentage point higher than the Consumer Prices Index including owner occupiers’ housing costs (CPIH) rate, although the difference between the two measures has varied considerably (see Figure 1). For example, in the period immediately before and during the economic downturn, the RPI rate dropped sharply in comparison with CPIH.
Figure 1 shows the factors contributing to the difference between the two measures, highlighting important methodological and conceptual issues that can have a profound impact on the measured inflation rate. There are a number of reasons why RPI differs from CPIH:
the “formula effect” is the most well-known of these; the mathematical properties of the Carli formula used in the RPI increase the 12-month growth rate by around 0.7 percentage points when compared with the Jevons formula used in CPIH
the treatment of housing costs for home-owners, technically known as owner occupiers’ housing costs (OOH); the RPI uses a combination of mortgage interest payments and also house prices as a proxy for housing depreciation, this means that the RPI is heavily influenced by house prices and interest rates, as shown in Figure 1
other important issues related to the coverage of RPI, including the goods and households included and the way in which these are weighted together
This article expands on these points, explaining where there are weaknesses with the methods used in the RPI.
Figure 1: Causes of the difference between the RPI and CPIH inflation rates, 2006 to 2018
Source: Office for National Statistics
Notes:
- When publishing this article we stated that the estimates “may be subject to small revisions”. In September 2018, having reviewed and improved the differences between the unrounded inflation rates, we published revised component series. The minor revisions affected the “Housing depreciation and other housing costs (RPI)" and the "Other differences in coverage" series and are as a result of reclassifying a single item. The headline difference was unaffected by the change.
Download this chart Figure 1: Causes of the difference between the RPI and CPIH inflation rates, 2006 to 2018
Image .csv .xls3. The formula effect
Consumer price indices in the UK typically make use of three different formulae to combine individual price quotes. The Retail Prices Index (RPI) uses the Carli and Dutot formulae, whereas the Consumer Prices Index including owner occupiers’ housing costs (CPIH) and Consumer Prices Index (CPI) use the Jevons formula in place of the Carli.
The mathematical properties of the Carli mean that price inflation calculated using it cannot be lower than inflation using the Jevons on the same basket of goods and services. There is evidence that the choice of formula has a large impact on the inflation rate. In the recent past, this “formula effect” has on average added 0.7 percentage points to the annual RPI measure of inflation compared with the CPIH.
There is no straightforward test for identifying the best formula to use. It is possible to produce hypothetical scenarios in which any of the formulae can be shown to produce reasonable or unreasonable results. A judgement therefore needs to be taken in the round on the basis of a wide range of evidence and analysis.
In January 2013, the Consumer Prices Advisory Committee concluded that “the statistical properties of the Carli meant it was unsuitable” for use in combining individual price quotes.
In 2015, the independent Review of UK Consumer Price Statistics by Paul Johnson explored the Carli and alternatives including the Jevons. Chapter 10 of that report provides a detailed exploration of the evidence around the Carli, including a number of different approaches for examining the appropriateness of different formulae. Taking into account all the evidence, the Review concludes that:
“Carli should not be used in any index aiming to achieve a good estimate of changes in consumer prices” and further that it “is not suitable for use”.
Both the Consumer Prices Advisory Committee and the Independent Review looked at international practice, noting that other countries had moved away from the use of Carli. For example, Canada had stopped using the Carli in 1978 and of 30 countries surveyed by Office for National Statistics (ONS) in 2012 (PDF, 152KB), none used the Carli. The United Nations Practical Guide to Producing Consumer Price Indices says:
“A key result is that the Carli formula for the arithmetic average of price relatives has an upward bias relative to the trend in average item prices. In particular the Carli suffers from lack of transitivity i.e. when prices return to an earlier level the chained index doesn’t. Consequently, it is a formula to be avoided and some judge that it should be prohibited.”
The issue of transitivity or “price bounce” is described in Annex A.
The Carli formula is no longer international best practice. This is the main reason why the RPI had its National Statistics status removed in 2013 following an assessment by the UK Statistics Authority (PDF, 99KB).
There have been some subsequent arguments in favour of Carli. The ONS’s Technical Advisory Panel on Consumer Prices reviewed some of the issues in January 2016, when a paper by Dr Mark Courtney was considered, but again concluded that, in the context of price collection in practice, the Carli formula is less suitable than the Jevons and Dutot formulae.
In light of this evidence the ONS view is that the Carli is not a suitable method and using it is likely to result in an upward bias to measures of inflation.
The impact of the formula effect was brought into focus in 2010, when ONS introduced a number of changes to the collection of clothing prices, mainly to increase the sample size and better reflect consumer spending patterns. These changes nearly doubled the formula effect and have acted to illustrate the weaknesses of the Carli. Some clothing items showed implausible levels of inflation over this period.
Figure 2 shows the change in the typical price of items of clothing between January 2010 and January 2018, compared with the increase in the price index using the Carli and Jevons methods. Each marker is for a particular clothing item within the wider clothing category. The expected result would be for the typical prices and the indices to grow at the same rate (the “expected” line in the figure). We would expect some variation, however, due to chain-linking and the formula used. In addition, changes to the sample would also show up as deviations from the expected line.
For the Jevons index, the different items are fairly close to the expected line. On the other hand, when using Carli the price index rise tends to be much higher than the rise in the typical price. We see around 20 clothing items where the Carli index suggests prices have doubled (increased by over 100%), despite the typical price of an item increasing by no more than 50% or so. The same price data are providing very different results due to the formula used.
In our view, it is clear that the changing clothing price collection has exposed serious shortcomings in the Carli formula.
Figure 2: A comparison of price index and average price change for items of clothing, using the Carli and Jevons formulae, January 2010 to January 2018

Source: Office for National Statistics
Notes:
- For clarity, the chart excludes a small number of items that have shown price reductions over the period and also items that have seen price increases of over 60%.
Download this image Figure 2: A comparison of price index and average price change for items of clothing, using the Carli and Jevons formulae, January 2010 to January 2018
.png (31.2 kB) .xlsx (13.2 kB)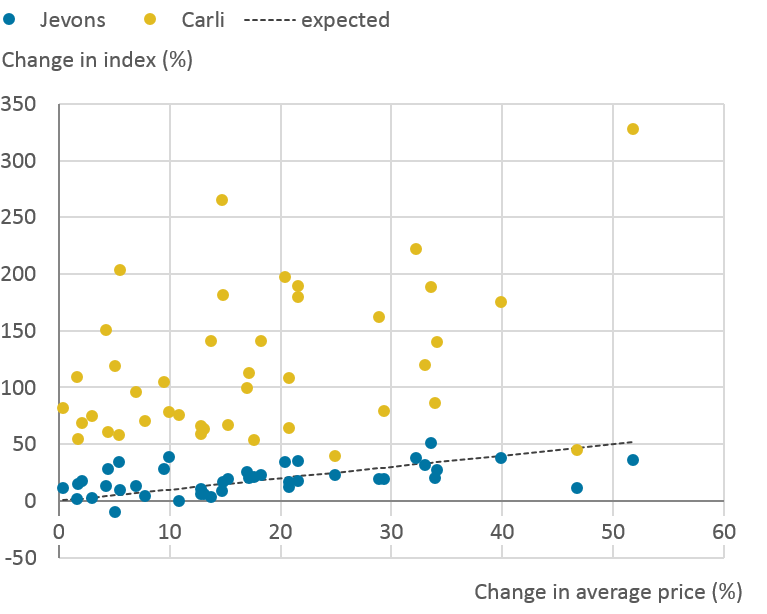
4. Measurement of owner occupiers’ housing costs
Measuring housing costs for homeowners is challenging when compiling measures of inflation. There are several approaches that are commonly used and each method, to a greater or lesser degree, attempts to remove the asset price element of housing. From a conceptual point of view, the price of assets is quite different from the prices of goods and services. This is because, in part, an increase in the price of an asset makes the owner better off, whereas for all other items in the basket of goods and services an increase in price makes the consumer worse off. Assets also produce a flow of services over a number of years.
The Office for National Statistics (ONS) has published data using three approaches to housing.
Net acquisitions
This approach looks at the net acquisition of the consumer element of housing. This means in theory it should only take into account the net purchase of housing from the non-household sector of the economy (for example, purchases from developers) and should separate the value of the property from the value of the land, which is treated as an asset. In practice, a number of simplifying assumptions have been made to apply the method in the UK, which means that land and property prices are not treated separately.
Payments
The payments approach aims to measure the payments related to the ownership of owner occupiers’ housing. This means that payments that households make as owner occupiers when consuming housing should be included, such as mortgage interest payments, transaction costs and running costs.
Rental equivalence
This uses the rent paid for an equivalent property as an estimate of the costs of housing services. Essentially, this answers the question “how much would I have to pay in rent to live in a home like mine?”. This approach does not capture changes in asset value, instead focusing on the cost of housing services.
Conceptually, there is a fourth approach known as “user cost”, which looks at the economic cost of using the housing asset. Developing and implementing the user cost approach has proved difficult in practice and therefore ONS does not calculate an index based on this approach. In theory, user cost and rental equivalence both measure the cost of using housing, and we would expect landlords to face similar user costs – or at least similar changes in costs – when compared with those of home-owners.
In the Retail Prices Index (RPI), the approach to housing costs incorporates elements of the user cost approach, but does not fully adopt that method. Instead, there are two main elements: a measure of “housing depreciation”, along with mortgage interest payments.
Housing depreciation is intended to represent the notional or actual spending needed to cover large renovations that are required to address deterioration. While this makes sense conceptually, there is no data source that can specifically track consumer spending on it. It is also difficult to distinguish between repairs and renovations that bring the property back to its original state and those that add value to the property.
Currently house prices are used as an approximation for depreciation. This assumes that changes in house prices reflect changes in the costs of the renovations needed to maintain the value of the property; there is no evidence to suggest this is the case. Conceptually this is also problematic: house prices include land, which does not depreciate and we are implicitly including assets in our measure of inflation.
This issue is far from trivial as depreciation, and therefore house prices, represent around 8% of the RPI basket, which in turn has a large impact on the inflation rate. In Figure 1, the effect can be seen in 2008 to 2009 when, due to falling house prices, the housing depreciation component contributed to a steep fall in the RPI, relative to the Consumer Prices Index including owner occupiers’ housing costs (CPIH).
While mortgage interest payments are an important component of expenditure for many households, they capture the cost of borrowing money, rather than directly measuring the cost of housing services. Including interest means we are not necessarily measuring the cost of consumption, rather how the consumption of goods and services is financed. More broadly, the household sector will benefit from interest received (for example, through savings) as well as paying out interest.
In summary, the RPI uses a partial user cost approach. Importantly, using house prices as a proxy for depreciation appears to be a serious weakness, especially as depreciation and house prices account for around one-twelfth of the basket. While house prices are an important economic indicator, they are best captured in a separate measure, with the monthly UK House Price Index meeting this need.
Back to table of contents5. Weights and population coverage
The components of consumer price indices are weighted according to the amount consumers spend on each of the items in the representative basket of goods and services. This ensures that the indices reflect the relative importance of the various items.
Much of the consumer expenditure data required for deriving the weights used in the Retail Prices Index (RPI) comes from the Living Costs and Food Survey (LCF). Although the LCF is an established and widely-used source, the sample sizes tend to be small at the fine level of detail required for a consumer price index, which contributes to the volatility in the weights seen for some goods and services. In addition, LCF only collects data on private households, so the expenditure of anyone living in institutions (such as student halls of residence and care homes) is excluded from the calculation.
A more accurate and comprehensive source for expenditure data can be obtained from national accounts estimates using the Household Final Consumption Expenditure (HHFCE). This draws on a wide range of survey and administrative sources, including the LCF, thereby providing a better estimate of expenditure and more complete coverage of the range of goods and services. These data are used for weighting the components of Consumer Prices Index including owner occupiers’ housing costs (CPIH) and Consumer Prices Index (CPI).
The differences in weights are not trivial. For example, over the period 2005 to 2016, the HHFCE had housing-related costs as 30% of overall expenditure, when an equivalent approach using the LCF would suggest spending on housing was only 24%.
With regards to coverage, the RPI excludes the top 4% of households by income and some of the poorest pensioner households, namely those that are mainly dependent on state benefits. This means that the spending patterns of around 12% of households are excluded from the calculation of the index in total.
It could be argued that excluding these households provides a better reflection of inflation experienced by the average household. For example, as higher-income households spend more, they are more heavily weighted in expenditure-weighted measures of inflation. ONS has recently investigated this further and found that ”trimming” the population in this way does not make it more representative of the average household. Incomplete coverage can also be considered a disadvantage if the intention is to provide a measure representing the whole population.
Back to table of contents6. Data collection and classification of goods and services
The Retail Prices Index (RPI) uses a bespoke classification system that was developed by the RPI Advisory Committee some years ago. The fact that the system is only used in the UK limits the ability to draw international comparisons.
The COICOP (classification of individual consumption by purpose) approach is an internationally accepted system that provides a comprehensive approach to classifying goods and services. As well as facilitating international comparisons, COICOP has the scope to evolve to best reflect consumer spending patterns, drawing on a wide range of expertise internationally. For example, an additional level of COICOP (COICOP5) has recently been introduced, which provides comparable data at a very detailed level, covering around 200 categories within Consumer Prices Index including owner occupiers’ housing costs (CPIH). The RPI classification system is therefore inferior to its alternatives.
There are two accepted concepts to determine the geographical coverage of a consumer price index. The first is the “domestic” approach, which means that weights are produced for the index using the expenditure within the UK of both residents and foreign visitors. The second is the “national” approach, which covers the expenditure of UK residents at home and abroad. The RPI is often referred to as having “national coverage” although, while it excludes the expenditure of foreign visitors in the UK, it does not include UK residents’ spending abroad. This means that it is not consistent with either concept.
The RPI aims to reflect prices on a particular day of each month, known as “index day”. Recent advances in technology allow for more dynamic pricing strategies, where prices change more frequently in response to supply and consumer demand. The use of a single index day may therefore be outdated when considering how to capture price movements in this environment.
Back to table of contents7. Conclusions
While no measure of inflation will have desirable properties for all its possible uses, the Retail Prices Index (RPI) has a number of significant weaknesses. While the formula issue has been at the centre of the debate, and indeed is a concern, there are a number of other problems. Housing costs are produced using a partial implementation of the user cost approach, with a poor proxy for depreciation used. There are even problems with more technical issues such as weighting, where RPI weights are not based on the most comprehensive data available and exclude certain pensioner and high-income households.
Overall, we do not view the RPI as a good measure of inflation. For the previous reasons, it is likely to overstate inflation. It is not possible to be precise about the extent of any upward bias as there is no single perfect measure to benchmark it against. When we compare it with other measures, however, we find the RPI inflation rate is currently around 1 percentage point higher than the Consumer Prices Index including owner occupiers’ housing costs (CPIH) and the experimental Household Costs Indices.
Back to table of contents8. Annex A: Chain drift and price bounce example
Table A1 gives a hypothetical example of chain drift and price bounce, or what the United Nations Practical Guide to Producing Consumer Price Indices describes as the problem of transitivity.
The prices of two products (A and B), shown in panel (a), change between periods 1 and 2, before returning to their original values in period 3. Product A rises from £10 to £12.50 before returning to £10; product B falls from £20 to £10 before returning to £20.
The first step in constructing a price index using the Carli and Jevons methods is to calculate “price relatives” as shown in panel (b). Price relatives are the ratio of prices in one period compared with the previous period. So the price relative for product A in period 2 compared with period 1 is 1.25, that is, the price has risen 25% between periods.
The next stage is to take these price relatives and construct an index of overall prices, as shown in panel (c). The Carli index is calculated using the arithmetic mean of the two products’ price relatives for a particular time period, while the Jevons uses the geometric mean1.
The final step is to create a “chain-linked” series so we can compare a price index in period 3 with period 1. This is done by multiplying together the price indices in each period, so the price index for the Carli is 0.88 ×1.40=1.23. This means the Carli index implies prices have risen by 23% between period 1 and period 3 despite both product A and B having the same price in both periods. On the other hand, the Jevons index shows no change in price levels.
Table A1: Hypothetical example of chain drift and price bounce (calculations rounded to 2 decimal places)
| (a) Prices (£) | Period 1 | Period 2 | Period 3 | |
|---|---|---|---|---|
| Product A | 10.00 | 12.50 | 10.00 | |
| Product B | 20.00 | 10.00 | 20.00 | |
| (b) Price relative | Period 2 / | Period 3 / | ||
| Period 1 | Period 2 | |||
| Product A | 1.25 | 0.80 | ||
| Product B | 0.50 | 2.00 | ||
| (c) Index of overall prices | Period 2 / | Period 3 / | Period 3/ | |
| Period 1 | Period 2 | Period 1 | ||
| Carli | 0.88 | 1.40 | 1.23 | |
| Jevons | 0.79 | 1.26 | 1.00 | |
| Source: Office for National Statistics | ||||
Download this table Table A1: Hypothetical example of chain drift and price bounce (calculations rounded to 2 decimal places)
.xls (33.3 kB)Notes for: Annex A: Chain drift and price bounce example
The Carli uses the arithmetic mean, so for period 2 compared with period 1, this is:
The Jevons uses the geometric mean, so for the same period it is:
Similar calculations apply for the other time period.