Table of contents
- Executive summary
- Introduction
- Section S1: The rationale for rental equivalence
- Section S2: Constructing the rental equivalence measure of OOH
- Section S3: Maintaining the quality of the OOH component of CPIH
- Section S4: Future work
- Annex A: Development of owner occupiers’ housing costs in the UK
- Annex B: Mapping exercise of requirements for a private rental series
- Annex C: CPAC papers on the development of owner occupiers’ housing costs
- Annex D: CPIH Publications
- Annex E: Equations used in the calculation of owner occupiers’ housing costs
1. Executive summary
This compendium aims to provide users with a comprehensive and accessible source of information on the Consumer Prices Index, including owner-occupiers’ Housing costs (CPIH). This compendium will focus chiefly on the measurement of owner occupiers’ housing costs (OOH). For more information on other items in CPIH, please see the Consumer Price Indices - Technical Manual.
The CPIH is the UK's lead measure of inflation, and is identical to the former lead inflation measure, the Consumer Prices Index (CPI), save for the treatment of OOH costs, which are excluded from the CPI. The CPI came into existence in the late 1990s, and is identical to the Harmonised Index of Consumer Prices (HICP) which is produced for Eurostat according to European regulations. It replaced the Retail Price Index (RPI) as the headline measure of inflation in 2003. The RPI was de-designated as a National Statistic in 2013 due to the use of an unsuitable formula in the construction of the index. The CPIH, which compensated for the lack of a measure of OOH in CPI, was introduced in 2013. OOH are a major part of household budgets and, as such, are an important aspect of consumer price inflation. As the more complete measure, then, CPIH is the lead measure of of inflation in our Consumer Price Statistics bulletin.
This view is supported by UK Consumer Price Statistics: A Review (Paul Johnson, 2015; commonly referred to as the Johnson Review) and, following an open consultation, the National Statistician’s statement of 10 November 2016 announced our intention for CPIH to become our preferred measure of inflation. It subsequently became the lead measure of inflation in our March 2017 Consumer Price Statistics bulletin. The CPIH was de-designated as a National Statistic in 2014 after required improvements to the methodology were identified. We submitted our evidence to the UK Statistics Authority on 26 September 2016. The evidence contains a suite of new and updated publications, which will be used over a period of time to monitor the behaviour of the index, and increase awareness and confidence in CPIH. CPIH was subsequently re-designated as a National Statistic on 31st July 2017.
Measuring owner occupiers’ housing costs
Owner occupiers’ housing costs (OOH) costs are the costs associated with owning, maintaining and living in one’s own home. This is distinct from the cost of purchasing a house. A consumer price index aims to measure consumption, whereas the purchase of a house is the purchase of an asset that is not consumed in the same way as other items. Moreover, OOH costs can be measured when they are paid for, when they are acquired, or when they are used. This means that we have to identify an appropriate target. OOH costs are therefore challenging to measure. There are several ways in which this might be done. These methods are all subject to practical and theoretical limitations and, as such, there is unlikely to be a consensus on the best approach.
CPIH uses an approach called rental equivalence to measure OOH. Put simply, rental equivalence uses the rent paid for an equivalent house as an estimate of the cost of housing services. This answers the question “how much would I have to pay in rent to live in a home like mine?” for an owner-occupier. In other words, we value housing services by looking at the cost of the next best alternative to home ownership, namely renting a property: “if I did not own a home, I would need to rent one”. Rents are therefore a proxy for the cost of home ownership. Importantly, the rental equivalence approach does not capture changes in asset value; rather it measures the change in price of housing services provided.
The other approaches of measuring OOH are:
- The payments approach, which measures what households pay directly when consuming housing; this includes mortgage interest payments, transaction costs and running costs such as major repairs.
- The narrow user costs approach, which estimates each of the individual elements of the costs of the services; these include mortgage interest payments and the cost to the owner occupier of having money tied up in their dwelling rather than being used for some other purpose, plus depreciation and recurring costs such as maintenance.
- The net acquisitions approach, which measures only price changes for houses which are new to the household sector; the house price is disaggregated into land (asset) and dwelling (consumable) costs, and the land is then excluded from the measure – There is also some measure of the maintenance of the property included.
We prefer the rental equivalence method because it has the strong advantage of not including asset prices. This means that it is suitable as a measure of consumption. The measure is also underpinned by a good quality source of data that allows it to be reliably estimated. It is consistent with the methodology used in the national accounts and, for those countries we have researched, rental equivalence is the most common method among those who include a measure of OOH in their headline CPIs. Some users have argued that this method is not easily understood, and that OOH costs should be measured directly.
The payments approach, however, is not suitable because of the inclusion of interest. This is essentially the cost of borrowing money, and is not consumption. Further, the narrow user costs approach can give very different results depending on subjective choices made in its construction.
The choice between net acquisitions and rental equivalence is less clear. Whilst net acquisitions is consistent with Eurostat’s methodology and the principles on which the CPI is built, and seems to tally better with some user’s expectations of housing costs, data limitations mean that the price of land cannot be stripped out. This means that the net acquisitions measure contains some element of asset prices. On balance, therefore, the rental equivalence approach is the best approach to incorporate OOH costs into CPIH.
Because of the difficulties inherent in measuring OOH by any method, it is unlikely there will be agreement among all users on the best approach. Nevertheless, the potential of the rental equivalence measure to more accurately reflect the consumption costs of owner occupiers is greater and, as such, is our preferred method of measuring this item. The National Statistician’s Consumer Prices Advisory Panel (CPAC) recommended this approach in 2012, and this view is supported by the Johnson Review (2015). We will continue to address user’s concerns through this Compendium, as well as supplementary articles such as Understanding the different approaches of measuring owner occupiers’ housing costs.
Constructing the rental equivalence measure
The rental equivalence measure is constructed using data on private rents collected by the Valuation Office Agency (VOA) in England, by Rent Officers Wales in Wales and by Rent Service Scotland in Scotland, for the purposes of administering Housing Benefit and Universal Credit functions. Northern Ireland rent prices are currently collected as part of the wider Consumer Prices Index including owner occupiers housing costs (CPIH) price collection, but we are currently investigating the potential of data from the Northern Ireland Housing Executive to improve the sample.
A random sample is selected from the data for different property types in each of Wales, Scotland and the nine regions of England1. The unsampled data are used as a substitution pool to identify comparable replacement prices when properties drop out of the sample. We use the Wales, Scotland and Northern Ireland microdata to compile private rental price indices for these regions, and VOA provide us with the indices for England directly using the same methodology. We have worked with VOA to ensure that methods and systems are robust, and have put appropriate service level agreements (SLAs) in place.
The private rental price indices are then rescaled according to expenditure in the owner occupiers’ housing costs (OOH) market (that is, stratum weights are applied), and combined to form the OOH component of CPIH. The expenditure data are derived from counts of owner occupied housing provided by the Department for Communities and Local Government (DCLG). These counts (or dwelling stock data) are only available nationally, so each property type is given equal weight in all regions. Dwelling stock data are multiplied by average prices to derive expenditure.
National Accounts OOH data are used to create OOH expenditure weights. These weights are then used to combine the OOH component with other items to form the headline index. This is consistent with the treatment of other items in the CPI basket of goods and services2.
Quality of the OOH measure
The rental equivalence measure of owner occupiers’ housing costs (OOH) costs is underpinned by large, good quality sources of rental data in England, Scotland and Wales, which are collected by rent officers for the purposes of administering housing benefit functions. Northern Ireland data are based on the normal Consumer Prices Index including owner occupiers housing costs (CPIH) collection and, as such, the sample is rather small; however, We are currently exploring a new source of data for private rents that will be comparable to those used in Britain. Moreover, we do not have access to the microdata for England. To maintain the integrity of the index, we have worked closely with the supplier to develop systems, and ensure that a consistent methodology is applied. Service level agreements (SLAs) have been put in place to ensure the continued supply of data.
The data provide a large representative sample of the UK rental market. Whilst the sample is not random (rent officers are given a target number of rental prices to collect, however the data are provided on a voluntary basis, and the sampling frame of the market is unknown), rent officers use their market knowledge to ensure that the prices collected are representative of the rental market in that area. This is similar to the procedure used by price collectors for the CPIH. To ensure that the rental data are representative of the OOH market stratum weights are used, as described above. Difficulties with following rental properties over time are mitigated by only sampling half the properties in January, and using the remaining properties as a substitution pool, again described above.
There are other issues that, should they occur, would introduce a potential bias into the rental equivalence measure. For example, should the government introduce rental controls, rental equivalence may no longer be an appropriate measure for OOH costs, although it is thought that this is unlikely to happen. Government policy to increase home ownership may cause the rental sample to fall, although this would be balanced against the fall in home ownership seen since the economic downturn in 2008. Finally, should the administrative requirements for housing benefit change, the data may no longer need to be collected. SLAs are in place to ensure that we will be notified in advance of any such changes, allowing us to plan accordingly.
Future work
As the lead measure of consumer price inflation, CPIH is an important and potentially influential statistic. We are committed to maintaining the quality of the index, as well as continuing its ongoing programme of development for the index, and monitoring the index’s behaviour over time. This will include:
- a comparison of the rental equivalence measure with other measures of OOH, which will be published in the quarterly article Understanding the different approaches of measuring owner occupiers’ housing costs, and will allow us to assess the performance of the measure over time
- monitoring the sources of rental data used to construct the rental equivalence measure against other potential sources of rental data, to ensure that the current source continues to be the best measure of rental prices (to be published alongside the Index of Private House Rental Prices (IPHRP) on a monthly basis)
- reviewing Quality Assurance of Administrative Data (QAAD) documentation on an annual basis, and other important documentation, such as the Users and Uses paper, and this Compendium, will be updated as required
- development of the OOH index, through improving the source of rental data for Northern Ireland and the regional breakdown for dwelling stock data
This work is important to ensure the future success of CPIH, and to help establish it as the leading measure of consumer price inflation in the UK. We welcome feedback on the development of CPIH from users, who can get in touch with us through the following channels:
Email: cpi@ons.gov.uk
Address: Christopher Payne, Prices Division, Office for National Statistics, Cardiff Road, Newport, NP10 8XG
Notes for Executive summary
- East Midlands, East of England, London, North East, North West, South East, South West, West Midlands, and Yorkshire and the Humber.
- For more information see the Consumer Price Indices – Technical Manual.
2. Introduction
This compendium aims to provide users with a comprehensive and accessible source of information on the Consumer Prices Index, including owner occupiers’ housing costs (CPIH). In particular, the compendium will focus on the measurement of owner occupiers’ housing costs (OOH), and its inclusion within CPIH. For more information on other elements of CPIH, please see the Consumer Price Indices - Technical Manual. The compendium will cover three main areas. Section S1 sets out the rationale for our choice of method, compared against other measures of OOH. Section S2 details how the OOH measure is constructed, and Section S3 considers potential areas of concern with the measure. The paper Users and Uses, which gives more information on what CPIH and other measures of inflation in the UK are used for and who are they are used by, may also be a useful accompaniment to the compendium.
The purpose of our consumer price indices is to measure the change in price of consumption goods and services within the target population (in the case of CPIH, this is the UK’s economic territory). The CPIH is one of a suite of measures of UK consumer price inflation that we currently produce, and is the lead measure in our Consumer Price Statistics bulletin. The CPI is the same as the UK’s Harmonised Index of Consumer Prices (HICP), which is produced for Eurostat, and is designed as a consistent measure of inflation across members of the European Statistical System (ESS). Thus the CPI follows international best practice. CPI is currently used for inflation targeting as well as uprating pensions and benefits.
The CPIH is identical to CPI with the additional inclusion of a measure of owner occupiers’ housing costs (OOH). OOH costs are the costs of housing services associated with owning, maintaining and living in one’s own home. These costs represent a large proportion of consumption expenditure and, as such, are an important addition to the basket of goods and services. OOH measures do not seek to capture increases in house prices. Although this may be inconsistent with some users’ expectations of measures of OOH, the inclusion of an asset price and therefore capital gains are generally defined as being out of scope of any kind of consumer price index. This is because they are an investment in an asset, and so add to household wealth, rather than spending on consumption. In conjunction with the Land Registry, Land and Property Services Northern Ireland, and Registers of Scotland, we also produce a House Price Index, which measures the change in cost of housing directly.
OOH costs in CPIH are measured using the rental equivalence method, which uses the rent of a similar property as a proxy for the cost of owning, maintaining and living in one’s own home. This method was recommended by the National Statistician’s Consumer Prices Advisory Committee (CPAC) in 2012. The CPIH was de-designated as a National Statistic in 2013 after required improvements to the comparable replacement of properties were identified. These improvements have now been made, and protocols put in place to ensure the continued supply of accurate data. CPIH was re-designated as a National Statistic on 31 July 2017.
With the March 2017 Consumer Price Statistics bulletin, CPIH replaced CPI as the lead measure of inflation. It is a drawback of the CPI that it does not include OOH. Therefore, following the recommendations of the Johnson Review (2015) and the subsequent consultation, the National Statistician, in his statement of 10 November 2016, announced his intention for CPIH to become our preferred measure of inflation.
Other consumer price statistics include the Retail Prices Index (RPI) which, due mostly to the use of a formula which does not meet international standards, is no longer a National Statistic. It continues to be produced as it is tied to long-term contracts, including the indexation of index-linked gilts.
As the lead inflation measure, CPIH is an important and influential statistic. This document sets out valuable information to users on the rationale behind and construction of the OOH component of CPIH.
Back to table of contents3. Section S1: The rationale for rental equivalence
As the lead measure of inflation, CPIH differs from Consumer Prices Index (CPI) (the former lead measure of inflation) chiefly in its inclusion of owner occupiers’ housing costs (OOH), which typically has a large weight in the fixed basket of goods and services used to measure consumer price inflation. In all other respects the CPIH is identical to CPI and, for more information on non-OOH items; the Consumer Price Indices – Technical Manual should be consulted. This first section introduces the concept of OOH costs, describing what they are and how they can be measured. The rationale behind the choice of the rental equivalence approach is then described, with a focus on the limitations of each of the measures, and how they are constructed in practice.
S1.1 Overview of owner occupiers’ housing costs
S1.1.1 What are owner occupiers’ housing costs?
OOH are the costs of housing services associated with owning, maintaining and living in one’s own home. This encompasses the shelter and security the home provides. This is distinct from the value of a home as an asset, and the associated capital gains. While some believe that the change in asset value holds a place in the measurement of consumer price inflation, this view is not accepted in the international community.
S1.1.2 Why is measuring owner occupiers’ housing costs so difficult?
Determining how best to measure OOH is one of the most contentious issues in the field of inflation measurement. The reasons for this stem from both methodological and practical considerations. There are a number of different ways in which OOH might be measured, each with methodological strengths and weaknesses.
In constructing a measure of inflation a decision must be made on the point at which to observe price change. There are three choices: the point at which a good or service is acquired, the point at which it is used, or the point at which it is paid for. Whilst an apple, for example, would generally be acquired, paid for and used (eaten) in the same period (month), owner-occupied housing is acquired at a single point in time, used for many years and can be paid for (for example, through a mortgage) over much of a lifetime. This means that, for OOH costs, depending on when we choose to observe price change, we will be measuring a different target.
As noted in the introduction, the purpose of consumer price indices is to measure the change in price of consumption goods and services within the target population (in the case of CPIH, this is the UK’s economic territory). The use approach measures the consumption of a good or service directly (as opposed to the acquisition approach, which measures the cost of acquiring goods and services for the purpose of consumption). For most goods and services – an apple, for example – the approach used makes little to no difference. For a number of goods and services, however, it could make some difference. These differences are at their largest when considering OOH. Indeed, OOH is almost unique amongst durables in the number of years over which it is consumed. Hence the importance of capturing the cost of consuming OOH services is most pertinent here.
Prices for airfares are also captured when the service is consumed (which, unlike housing, is consumed in one period); however, for the most part, prices in CPI and CPIH are collected on an acquisitions basis. This is consistent with a resolution passed by the 17th International Conference of Labour Statisticians (ICLS, 2003), which recognised that “because of the practical difficulties in uniformly defining consumption and estimating the flow of services provided by other durable goods in terms of “use”, it may be necessary to adopt a mixed approach – for example “use” for owner-occupied housing and “acquisition” or “payments” basis for other consumer durables.” We would certainly not expect the impact for other consumer durables to be as large as for OOH.
S1.1.3 What are the approaches to measuring owner-occupiers’ housing costs?
Statisticians and economists have developed theoretical methods to measure OOH from each of these perspectives. Thus, each of these approaches is measuring a different target. Each method is summarised in Table 1 below.
| Method | Target | Approach | Description |
|---|---|---|---|
| Payments | The payments relating to the ownership of OOH | Payments |
|
| Net acquisitions | The cost of acquiring and maintaining OOH | Acquisitions |
|
| Rental equivalence (user costs) | The ongoing consumption of OOH services | Use |
|
| Narrow user costs | The ongoing consumption of OOH services | Use |
|
The Johnson Review (2015) provides a comprehensive summary of each of the four approaches to measuring OOH. The relevant sections have been reproduced below.
Net acquisitions
Measuring cost at the point a house is acquired gives rise to the net acquisitions approach. This treats a house as a purchase of a good that is part asset, part consumable. The “net” part refers to the fact that only properties that are bought from outside the household sector are included, with sales to other sectors netted off. This is because sales between households are transfers and leave the household sector no better or worse off.
The distinction between asset and consumable is represented by considering the building itself (and spending on the property, such as maintenance) as the good being consumed, and the land it stands on as the asset. As the asset element is excluded from a consumer price index, this ideally requires separate information about land and house building prices. In total, the net acquisitions approach therefore includes:
- net purchases of dwellings by the household sector (excluding land prices)
- self-built housing
- alterations and additions
- transaction costs (such as taxes and legal fees)
- running costs (such as repairs and maintenance, insurance)
We currently produce an experimental net acquisitions index for Eurostat. Eurostat has developed the net acquisitions methodology for potential inclusion in the Harmonised Index of Consumer Prices (HICP), an inflation measure that EU member states must produce in line with European regulations. This ensures that the inflation measure is consistent across the economic area. We have worked with Eurostat to ensure that the UK’s net acquisitions method is in line with its methodology.
Payments approach
The second approach is the payments approach. It is defined by looking at what households pay out as owner occupiers (excluding … capital payments). This includes:
- mortgage interest payments (MIPS)
- transaction costs
- running costs (such as repairs and maintenance and insurance)
Mortgage interest payments are usually regarded as within the scope of the payments approach. This in itself makes the payments approach unsuitable for many purposes, such as inflation rate targeting and, arguably, the uprating of benefits.
Transaction costs include estate agency fees and conveyancing. Stamp duty is also arguably a transaction cost, although it is excluded from the Retail Price Index (RPI), which is sometimes said to follow a payments approach.
Running costs include spending on repairs and maintenance, house insurance and ground rent. Accounting for major repairs – those that go beyond restoring a house to its initial state – poses another problem for the payments approach. These are a significant but irregular part of the costs of owning a home. They are difficult to obtain prices for on a consistent basis, and one needs to disentangle upkeep from alterations which improve the property (and are hence are a form of investment).
It is generally accepted … that houses are a combination of an asset and a consumable good. The various methods of measuring the costs of owner occupiers that exist all acknowledge this distinction in some way and try to disentangle the two, with the goal of excluding the asset element. In the context of the payments approach, this is achieved by excluding payments that create an asset (or reduce a liability) on household balance sheets. These include down payments, the capital element of mortgage repayments, and alterations and additions to the property.
Narrow user cost approach
The user cost approach is a use-based approach; that is, it aims to measure the cost of using housing. It treats housing as a capital good that provides services that the owner occupier consumes. The user cost approach measures the costs of owning the house, which are a combination of the actual expenses incurred (for example, repairs and maintenance) and the costs of financing the purchase of the property.
The full user cost model is:
Full user cost = Mortgage interest paid
+ Interest forgone on capital used (opportunity cost)
+ Depreciation
+ Running costs (repairs and maintenance, taxes, insurance etc.)
- Capital gain (difference between price at beginning and end of period)
We considered a narrow user cost approach in 2010. The model that we developed was:
Narrow user cost = (Average house price × real rate of interest)
+ Depreciation
+ Running costs (repairs and maintenance, taxes, insurance etc.)
The first term assumes that the sum of mortgage interest and opportunity cost can be represented by the “real rate of interest”. This is intended to represent the real return (that is, excluding inflation) of a long-term investment.
Rental equivalence
The rental equivalence approach is, like the user cost approach, a use-based approach. It treats housing as a capital good that is not itself consumed; instead, it provides a service that the owner occupier consumes. The rental equivalence approach argues that people who own their home can either live in it or rent it out. Therefore, the rent the owner-occupier could have received is a measure of how much these services are worth.
The rental equivalence approach measures the forgone value of these services using private rents of comparable properties. The rent charged by landlords covers not just the property but many of the other costs borne by owner occupiers, such as repairs and maintenance and transaction costs. Therefore, under the rental equivalence approach, these are not estimated separately, as to do so would introduce double-counting.
For rental equivalence to work, the rental market needs to be large enough to function, excluding controlled rents. It also requires that privately-rented properties can represent owner-occupied properties. In other words, there need to be enough properties of each type, in each part of the country, to construct a rent price index, weighted for the composition of the owner occupied sector.
Rental equivalence also requires that the houses available for rental are representative (subject to adjustment for property mix) of those in the owner occupied sector.
The rental equivalence method, therefore, uses the rent paid for an equivalent house in the private sector as a proxy for the costs faced by an owner-occupier. It would, however, be a false comparison to try to equate rental equivalence costs with those faced by owner occupiers buying in today’s market. The net acquisitions approach, for instance, measures only the costs faced by purchasers from other sectors (principally new housing). The rental equivalence approach covers all owner-occupiers, not just those who are buying from other sectors. Rental equivalence prices are based on price changes in the private rental market, which will be influenced by movements in today’s house prices but will also reflect historic price changes. Rental equivalence is the method currently used to measure OOH costs in CPIH.
S1.2 The rationale for using the rental equivalence method in the UK
As a consumer price index, CPIH is a measure of the cost of consumption. Therefore the choice of method for measuring OOH should be based on the most statistically accurate method for measuring the changing cost of consumption goods and services in the UK. This means that asset prices should not be included, as an asset is not consumed in the way that goods and services are.
In short, our preferred method for measuring OOH costs is the rental equivalence method. Rental equivalence is the best approach because:
- the exclusion of asset prices makes it more appropriate as a measure of consumption
- the underlying data are of good quality (based on the mapping exercise presented in Annex B), and allow the measure to be reliably estimated
- rental equivalence is consistent with National Accounts methodology and is widely used internationally
This decision was arrived at by consideration of each of the measures, both in terms of their theoretical appropriateness, and how they are measured in practice. This choice does not imply that the rental equivalence method would be the appropriate way to measure all services. As discussed in section S1.1.2, the challenges with measuring OOH are unique amongst consumption items. There are more direct ways of measuring other items, which are appropriate to the particular case in question.
Given that we aim to measure the cost of consumption, we have decided against the payments approach, because of the inclusion of mortgage interest payments. Interest payments capture the cost of borrowing money, rather than the cost of services provided by owner-occupiers’ housing. Including interest payments in an index is counter to the idea that we aim to measure the cost of consumption, as they are not consumed in the same way as goods and services.
Moreover, the household sector will benefit from interest received (for example, through savings) as well as lose out through interest paid. The treatment of such items in CPIH is usually to capture the net expenditure; for example, with insurance we take insurance payments and remove the claims received to arrive at an aggregate expenditure for the household sector. Paul Johnson, in his review of consumer price statistics, suggests that a payments measure of OOH costs “is only appropriate when compared to a measure of household income”.
The narrow user cost method is also not a suitable approach, because of the subjectivity involved in selecting the methodology for determining and changing the real rate of interest, an important component in calculating the opportunity cost of home ownership. Previous research (CPAC(10)02) has shown that this method is particularly sensitive to the choice of real rate of interest. Moreover, this method can result in negative index values.
The choice therefore reduces to a decision between the net acquisitions and the rental equivalence approaches. The choice between these two measures is less clear, and the arguments for both require careful evaluation. We will therefore consider them against the following questions, which are aligned to the quality dimensions which the Government Statistical Service adhere to. CPAC used a similar argument when it advised the National Statistician in 2012 on the best approach for measuring OOH costs. For more detail on the history of OOH costs in UK price indices, please see Appendix A.
S1.2.1 Can the approach be easily understood by the public?
| Quality dimension | Accessibility and clarity |
|---|---|
| Preferred measure | Net acquisitions |
The net acquisitions method can be briefly described as “measuring the costs associated with purchasing and maintaining a house”. Most users understand the concept, though some are unclear of the rationale or rightness for attempting to remove the asset element of the house price, or only considering properties new to the household sector.
The rental equivalence method can be briefly described as “‘measuring the price owner-occupiers’ would need to pay to rent their own home”. Many users find this a harder concept to grasp than net acquisitions. Some users also question the link between the rental and owner occupiers’ housing markets.
In truth, measuring OOH is a complex problem and none of the methods are straightforward.
S1.2.2 Can the approach be produced in time to be included in the CPI?
| Quality dimension | Timeliness |
|---|---|
| Preferred measure | Net acquisitions Rental equivalence |
All components of the net acquisitions approach are timely except the house price and stamp duty components which are lagged by one month. All components of the rental equivalence approach are timely except the English rental data. The English rental data is lagged by at least one month.
S1.2.3 Is the method consistent with the European Union method for measuring OOH, and international best practice for measuring OOH?
| Quality dimension | Comparability |
|---|---|
| Preferred measure | Rental equivalence |
Whilst Eurostat consider that rental equivalence is not suitable for inclusion in the Harmonised Index of Consumer Prices (HICP), the main reasons for this are that HICP principles exclude the use of imputation (which rental equivalence and user costs approaches both make use of), and that rental equivalence is invalid where countries do not have a sufficiently large rental market to produce an accurate measure of rental equivalence. However, CPIH does not need to be consistent with HICP principles, as it is being developed for UK purposes and, as such, the primary consideration should be best meeting the needs of UK users of consumer price statistics. The UK has a well-established rental market, and a rich source of rental data. The Valuation Office Agency (VOA) collects around 500,000 rental prices annually for England, for the purposes of administering housing benefit functions. Similar data are collected in Wales and Scotland by the devolved authorities. The data are described in more detail in Section S2.
The OOH method developed by the European Statistical System for potential future inclusion in the Harmonised Index of Consumer Prices follows a net acquisitions approach. We have worked with Eurostat to ensure that the UK’s net acquisitions measure is in line with this method. Due to the fact that many member states are unable to separate the land and building costs for dwellings which are newly acquired, or new to the OOH sector, Eurostat instead requires house prices to be measured, using the national House Price Index (HPI). It is necessary to ensure comparability across countries that may or may not be able to price the land and buildings elements separately (such as the UK).
Table 2: International approaches to OOH in headline measure of inflation
| Country | Exclusion | Rental equivalence | Net acquisitions | User cost | Payments | Mixed |
|---|---|---|---|---|---|---|
| Australia | X | |||||
| Austria | X | |||||
| Belgium | X | |||||
| Bulgaria | X | |||||
| Canada | X | |||||
| Croatia | X | |||||
| Czech Republic |
X | |||||
| Denmark | X | |||||
| Estonia | X | |||||
| Finland | X | |||||
| France | X | |||||
| Germany | X | |||||
| Greece | X | |||||
| Hungary | X | |||||
| Iceland | X | |||||
| Ireland | X | |||||
| Italy | X | |||||
| Japan | X | |||||
| Latvia | X | |||||
| Lithuania | X | |||||
| Luxembourg | X | |||||
| Mexico | X | |||||
| Netherlands | X | |||||
| New Zealand |
X | |||||
| Norway | X | |||||
| Poland | X | |||||
| Portugal | X | |||||
| Slovakia | X | |||||
| Slovenia | X | |||||
| South Korea |
X | |||||
| Spain | X | |||||
| Sweden | X | |||||
| Switzerland | X | |||||
| Turkey | X | |||||
| United States |
X | |||||
| HICP | X |
Without a complete inventory, it is hard to say which is the most commonly used approach to measuring OOH costs internationally; however, based on our research, the rental equivalence measure (or a similar use-based approach) is the most common among countries currently operating an inflation targeting regime. In fact, exclusion is the most common approach; however, by definition, CPIH aims to include OOH costs. For example, the USA’s Consumer Price Index includes rent of the primary residence and owners’ equivalent rent of the primary residence as the two main components classified under Shelter. Other notable examples include Switzerland, the Netherlands, Germany and Norway. Where countries operate an inflation-targeting regime with a net acquisitions measure of OOH in their target index, the asset element of the price is not included. Australia and New Zealand, for example, use the net acquisitions approach but they are able to price a dwelling structure independently from the plot of land. Table 2 lists the measures of OOH used in the headline measure of inflation for various countries.
S1.2.4 To what extent does this approach meet the range of different user needs?2
| Quality dimension | Relevance |
|---|---|
| Preferred measure | Rental equivalence |
Many users expect a measure of OOH to move in line with house prices. The impact of increasing house prices on the net acquisitions approach tallies with many users expectations. However, in the UK, it is impossible to disentangle the asset element from the consumption element. This is because it is not possible to separate the land and building costs for dwellings which are newly acquired, or new to the OOH sector. Instead, the House Price Index is used to measure house prices. Hence this measure includes asset prices which, as discussed, are at odds with a measure of the cost of consumption. This would make the measure less suitable for some uses such as inflation targeting to determine monetary policy. Indeed, whilst house price bubbles may be a concern for users, house prices do not need to be included in the measure of inflation for monetary policy to address the issue. The Monetary Policy Committee considers a wide range of indicators when setting monetary policy. The House Price Index (HPI) can be used to assess and monitor house price inflation.
On the other hand, the rental equivalence measure reflects just the consumption cost of OOH, making it suitable for this purpose. Further, as the rental equivalence method belongs to the family of use-based methods, which are conceptually closer to the cost of living concept than net acquisitions, this would be more appropriate for compensation uprating. Some users, however, have expressed a concern about the lack of an obvious link between the rental equivalence measure and changes in house prices3.
Table 3: Criteria for assessing the accuracy of OOH measures
| Criterion | Standard | Net Acquisitions | Rental Equivalence | |
|---|---|---|---|---|
| Definition and aim of the index | Measure price changes through monetary transactions of consumption goods and services | ✓ Measure price changes through monetary transactions of consumption goods and services |
✗ Measure price changes through non-monetary transactions of consumption goods and services | |
| Geographical coverage |
All owner occupied housing in the United Kingdom |
✓ All owner-occupied housing in the United Kingdom |
✓ All owner-occupied housing in the United Kingdom |
|
| Conceptual basis of expenditure weights |
Household Final Monetary Consumption Expenditure |
✓ Part of Gross Fixed Capital Formation and Household Final Monetary Consumption Expenditure |
✗ Function of owner-occupied dwelling stock and average level of private rent |
|
Prices |
Price concept | Full transaction price | ✓ Full transaction price | ✗ Imputed transaction price |
| Source | Either suppliers of the good or service, purchasers of the good or service, or regulatory authority governing the good or service | ✓ Suppliers of the good andregulatory authority | ✓ Price movementtaken from average of movements for equivalent dwellings in rental stock.Rental stock data supplied by regulatory authority | |
| Timing | When financial liability is first incurred | ✓ When financial liability is firstincurred | ✓ (Imputed) when financial liability isincurred | |
| Treatment of land prices |
Excluded |
✗ Included as part of the HPI only |
✓ Excluded |
|
| Treatment of non-monetary expenditure |
Excluded |
✓ Excluded |
✗ Included |
|
| Treatment of non-consumption expenditure |
Excluded | ✗ Included | ✓ Excluded | |
| Adjustment for quality change |
Account for changes in mix of dwellings, age of dwellings and dwelling characteristics |
✓ Account for change in mix of dwellings |
✓ Account for change in mix of dwellings |
|
| ✓ indicates that the measure meets the standard, ✗ indicates that it does not | ||||
S1.2.5 How well does the index represent changes in OOH costs?
| Quality dimension | Accuracy |
|---|---|
| Preferred measure | Rental equivalence |
With respect to accuracy, we consider each measure in relation to the key concepts we are attempting to measure (Table 3). Both measures meet most of the criteria. For net acquisitions, the criteria that have not been met relate to the inclusion of an asset price (that is, the cost of land) in the price component of the measure, whereas, for rental equivalence, the criteria that have not been met relate to the use of imputed prices. Imputation is, however, already used elsewhere in the CPI, albeit to a lesser extent; for example, to calculate the base price when a non-comparable item is introduced. Moreover, as a measure of consumption, it is important that asset prices are not captured in the index.
It is theoretically possible for the weights for existing dwellings new to the household sector (one of the component indices of the net acquisitions measure) to be negative. This can occur, for example, when the expenditure on existing dwellings sold to the household sector is less than that of existing dwellings sold by the household sector; in other words, the stock of existing dwellings owned by the household sector is falling. In practice it is not feasible to construct a consumer price index using a negative weight. Moreover, the way the index is constructed also means that we could see counter intuitive movements. For example, we might see house prices falling but the index increasing.
S1.2.6 Is the approach consistent over time and geographical area?
| Quality dimension | Consistency |
|---|---|
| Preferred measure | Net acquisitions |
The methods used to construct the rental equivalence indices are broadly consistent across geographic area, although there are some differences in the way the data are collected in the different constituent countries of the UK. By contrast, all data sources used in the construction of net acquisitions indices are consistent over geographic area and will be consistent going forward.
S1.2.7 Does the approach follow the same trends as other relevant measures? (For example, is the approach consistent with national accounts deflators?)
| Quality dimension | Coherence |
|---|---|
| Preferred measure | Rental equivalence |
The System of National Accounts (SNA) treats housing as an investment asset which provides a flow of dwelling related services. The cost of consuming those dwelling related services is measured using a rental equivalence approach (known as imputed rents). The net acquisitions approach is therefore inconsistent with the approach used in the national accounts, whereas the rental equivalence measure is similar in methodology, although it has shown less volatile movements over the last fifteen years. We have harmonised the measurement of private rental prices and imputed rents for OOH in consumer price inflation statistics and the national accounts using the new private rental data source developed for CPIH.
Until 2010, the net acquisitions measure has generally risen quicker than the national accounts deflator for imputed rentals. Both series demonstrate similarly timed peaks of inflation, although the national accounts deflator didn’t show the large drop seen in the net acquisitions approach in 2008. Therefore the net acquisitions measure demonstrates limited comparability with the national accounts. For a more detailed understanding of how the rental equivalence approach compares to the net acquisitions and payments approach over time, please see the Understanding the approaches of measuring owner occupiers’ housing costs article, which will be updated on a quarterly basis.
S1.2.8 Summary
There are clearly arguments for and against both approaches, and the choice is not a clear one. On balance, we have to place more weight on some arguments than others. We do not want a measure that includes asset prices, because this means it is not suitable as a measure of the cost of consumption, and therefore is of limited use, notably for inflation targeting. The rental equivalence approach is therefore a better match against the quality criteria specified in Table 3. Moreover, the underlying data source is of good quality, allowing us to produce a reliable measure of OOH, unlike the net acquisitions approach, where the data sources do not allow us to reliably separate out the asset cost (the land) from the consumption element. Finally, whilst not the primary concern, the rental equivalence approach also has the desirable property of being consistent with the approach taken in the national accounts.
This choice is supported by the Consumer Prices Advisory Committee (CPAC) which, in 2012, also recommended using the rental equivalence approach (see Annex A), and the Johnson Review (2015), which recommended that we should continue to use this approach to measure OOH costs.
More information on the development of OOH measures in UK consumer price indices can be found in Annex A. We also publish a quarterly article which monitors the development of the different approaches to measuring OOH costs.
Notes for Section 1: The rationale for rental equivalence:
- A cost of living index is an index which accounts for consumer substitution.
- For more information on Users and Uses of consumer price statistics, please see Users and Uses.
- The spotlight analysis presented in the article Understanding the different approaches of measuring owner occupiers’ housing costs suggests that, although there can be short term divergences, which can occur for a wide range of different factors, it is reasonable to expect there to be a relationship between house prices and private rents in the long term.
4. Section S2: Constructing the rental equivalence measure of OOH
Having established that the rental equivalence method is the preferred method for measuring owner occupiers’ housing costs (OOH) costs, we now turn to how the measure is constructed for inclusion in UK consumer price indices. We begin by describing the sources of rental data used for England, Wales, Scotland and Northern Ireland. We then discuss how these data are compiled into an index for OOH costs, and how the OOH index is then aggregated into headline CPIH. For completeness, we also describe how the net acquisitions measure of OOH is constructed for Eurostat.
S2.1 Collection of private rentals data
Private rents data are collected separately in England, Scotland and Wales by rent officers as part of their responsibilities to administer functions relating to Housing Benefit and Universal Credit. This includes the Local Housing Allowance (LHA) and Local Reference Rent (LRR) schemes1. In all administrations, rent officers collect rental prices from agents and landlords who are willing to provide data. The sample is not random but procedures are in place to ensure the collection is representative of the private rental market. Other costs associated with renting are not collected, but are likely to be a small part of the total costs. These items are typically not rental costs and their price movements will be based on the representative item in the basket used to reflect their expenditure class.
Table 4 summarises the data collection for England, Scotland, Wales and Northern Ireland, as well as their historic availability, which differs by country. Where data are not available private rents data collected as part of the ongoing CPI local price collection2 are used (for unfurnished rents only, as furnished rentals are not appropriate for rental equivalence). Further details on the collection for each country are provided below. The rental data are used to produce the OOH component of CPIH, as well as the Index of Private House Rental Prices (IPHRP), which measures the change in price of renting residential property from private landlords. Please see also the Quality Assurance of Administrative Data (QAAD) document for further information on the quality of the data sources. For further information on the data requirements and how our chosen sources match these, please see Annex B. A comparison of our sources of rental data with other sources is available, and are published on a monthly basis.
Table 4: Historical availability of data for OOH
| Year | England | Scotland | Wales | Northern Ireland |
|---|---|---|---|---|
| 2005 | VOA Approximate annual sample of 500,000 |
CPI | CPI | CPI |
| 2006 | ||||
| 2007 | ||||
| 2008 | ||||
| 2009 | Rent Officers Wales (Housing Policy Division, Welsh Government) Approximate annual sample of 25,000 |
|||
| 2010 | ||||
| 2011 | Rent Services Scotland (Community Analytical Services Division, Scottish Government) Approximate annual sample of 30,000 |
|||
| 2012 | ||||
| 2013 | ||||
| 2014 |
S2.1.1 England
The collection of private rents in England is administered by the Valuation Office Agency (VOA), using evidence of rents paid in the private rented sector. Collection results in a very large source of private rental data that is representative of the private rental market, although information is provided to rent officers on a goodwill basis.
Landlords and letting agents provide VOA rent officers with data pertaining to the properties they let. Annually around 500,000 prices are now collected. This information is captured electronically in the VOA’s lettings information database. Checks are carried out at the point of entry to ensure that any Housing Benefit funded tenancies are excluded from this database. All the lettings information is provided on a goodwill basis.
VOA instructs their rent officers to ensure that the letting information that they collect is representative of the full range of local market rents in each Broad Rental Market Area (BRMA). Prices are collected from landlords, letting agents and tenants, with the aim to collect approximately 15% of data from sources other than letting agents. To ensure a representative sample, rent officers in VOA are given targets to collect rental data in each area sufficient to represent at least 10% of the private rental market based on the 2011 census. Rent officers are expected to maintain a high standard of knowledge of the private rental market in their area and over time the collection has been refined using local market knowledge to reflect the changing rental market. This combined approach of regular and targeted collection based on market intelligence results in a representative sample across each area. For more information on ensuring the quality of the data please refer to the QAAD.
Rent officers are alerted, via a quarterly report, of properties that are about to reach a 12-month anniversary since their last update. However, there is no formal procedure for VOA rent officers to revisit previous properties and, as a result, some properties may drop out of the sample.
VOA rents data are available from 2005 onwards. However, the introduction of the LHA in 2008 resulted in changes to collection practices. As a result of these changes, the sample used to construct private housing rental indices grew from around 95,000 in 2008 to around 195,000 in 2010. The LHA is much more transparent and open to scrutiny than LRR. With its introduction there was a need for rent officers to compile and maintain a robust and representative sample of the private rental market. Dedicated teams of rent officers were formed to specialise in data collection. Guidance, training and monitoring methods were reviewed, which included introducing more effective and consistent approaches to following up data, and an effort was made to improve the awareness of the rent officers’ role. This helped create a more receptive environment to data collection.
S2.1.2 Scotland
Rental data for Scotland are currently provided by Rent Service Scotland, part of the Community Analytical Services Division (formally known as the Rent Registration Service) of the Scottish government. It is responsible for gathering rental prices and analysing local rental markets to provide Scottish Local Authorities with LHA figures. This information on the rental market is collected by market rental evidence teams, which are in regular contact with landlords and letting agents. Annually around 30,000 prices are collected. As well as setting the LHA figures, it provides advice to Local Authorities in assessing claims for Housing Benefit made before 7 April 2008 under the LRR scheme. Rent Service Scotland also undertakes Fair Rent valuations for regulated tenancies which began in Scotland prior to 2 January 1989. The service operates from three offices in Edinburgh, Glasgow and Dundee and employs 12 Scottish government staff.
Rent officers use their knowledge and experience to ensure that data collected reflect the mix of properties in the area as far as possible. Rents are gathered from a diverse range of sources, principally internet listings, but, unlike England and Wales data, are mainly based on advertised, rather than achieved, rents. All information collected is from open market sources, never from landlords who advertise to people on housing benefits, intermediate/mid-market rents and/or halls of residence. Data for Scotland are available from 2011. All the lettings information is provided on a goodwill basis.
S2.1.3 Wales
Rent Officers Wales, part of the Housing Policy Division of the Welsh Government provide rental data that are used to construct the Wales estimate. Residential accommodations in the private rented sector in Wales are valued by rent officers who provide an independent and impartial valuation service of residential properties. The market rental evidence team of Rent Officers Wales are in regular contact with landlords and letting agents who provide them with the latest up-to-date information, on a voluntary basis, to ensure all valuations are based on current open market rents.
Rent Officers Wales came in to existence in 2003 when it was amalgamated from eight separate regions in Wales and brought under the Welsh Government. Rent officers were first appointed in 1967 to administer Fair Rents but in 1989, when rents were de-regularised, additional functions were added whereby rent officers assessed rents for which housing benefit was being claimed. Evidence of market rents has been collected since then. Systems and methodology were radically updated in 2008 to take account of the commencement of LHA meaning that data for Wales are available from 2009 onwards. Annually around 25,000 prices are collected.
S2.1.4 Northern Ireland
In 2012, when the private rental indices were first developed, the Northern Ireland administrative data were deemed unsuitable because they were neither frequent nor timely enough for inclusion within a measure of consumer price inflation, and the coverage of the data only included the Belfast Metropolitan area, rather than the whole of Northern Ireland. Therefore the existing CPI private rental data collected in Northern Ireland are used when a UK aggregate is needed. For more detail on validation procedures and collection practices, please see the Consumer Price Indices – Technical Manual.
The Northern Ireland Housing Executive (NIHE), responsible for collecting private rental data, is currently undertaking a programme of development to improve the timeliness and extend the coverage to the whole of Northern Ireland. Recent work by NIHE has looked at combining data from PropertyNews.com with NIHE rent data gathered by staff in order to calculate the LHA received for the administration of private sector housing benefit. We have been working with colleagues at the NIHE to identify what data are available and NIHE has recently provided ONS with a historic dataset which will be used to investigate if the data can potentially be used to calculate comparable private rental indices. In the future these could then be used in OOH and the IPHRP.
S2.2 Sampling strategy
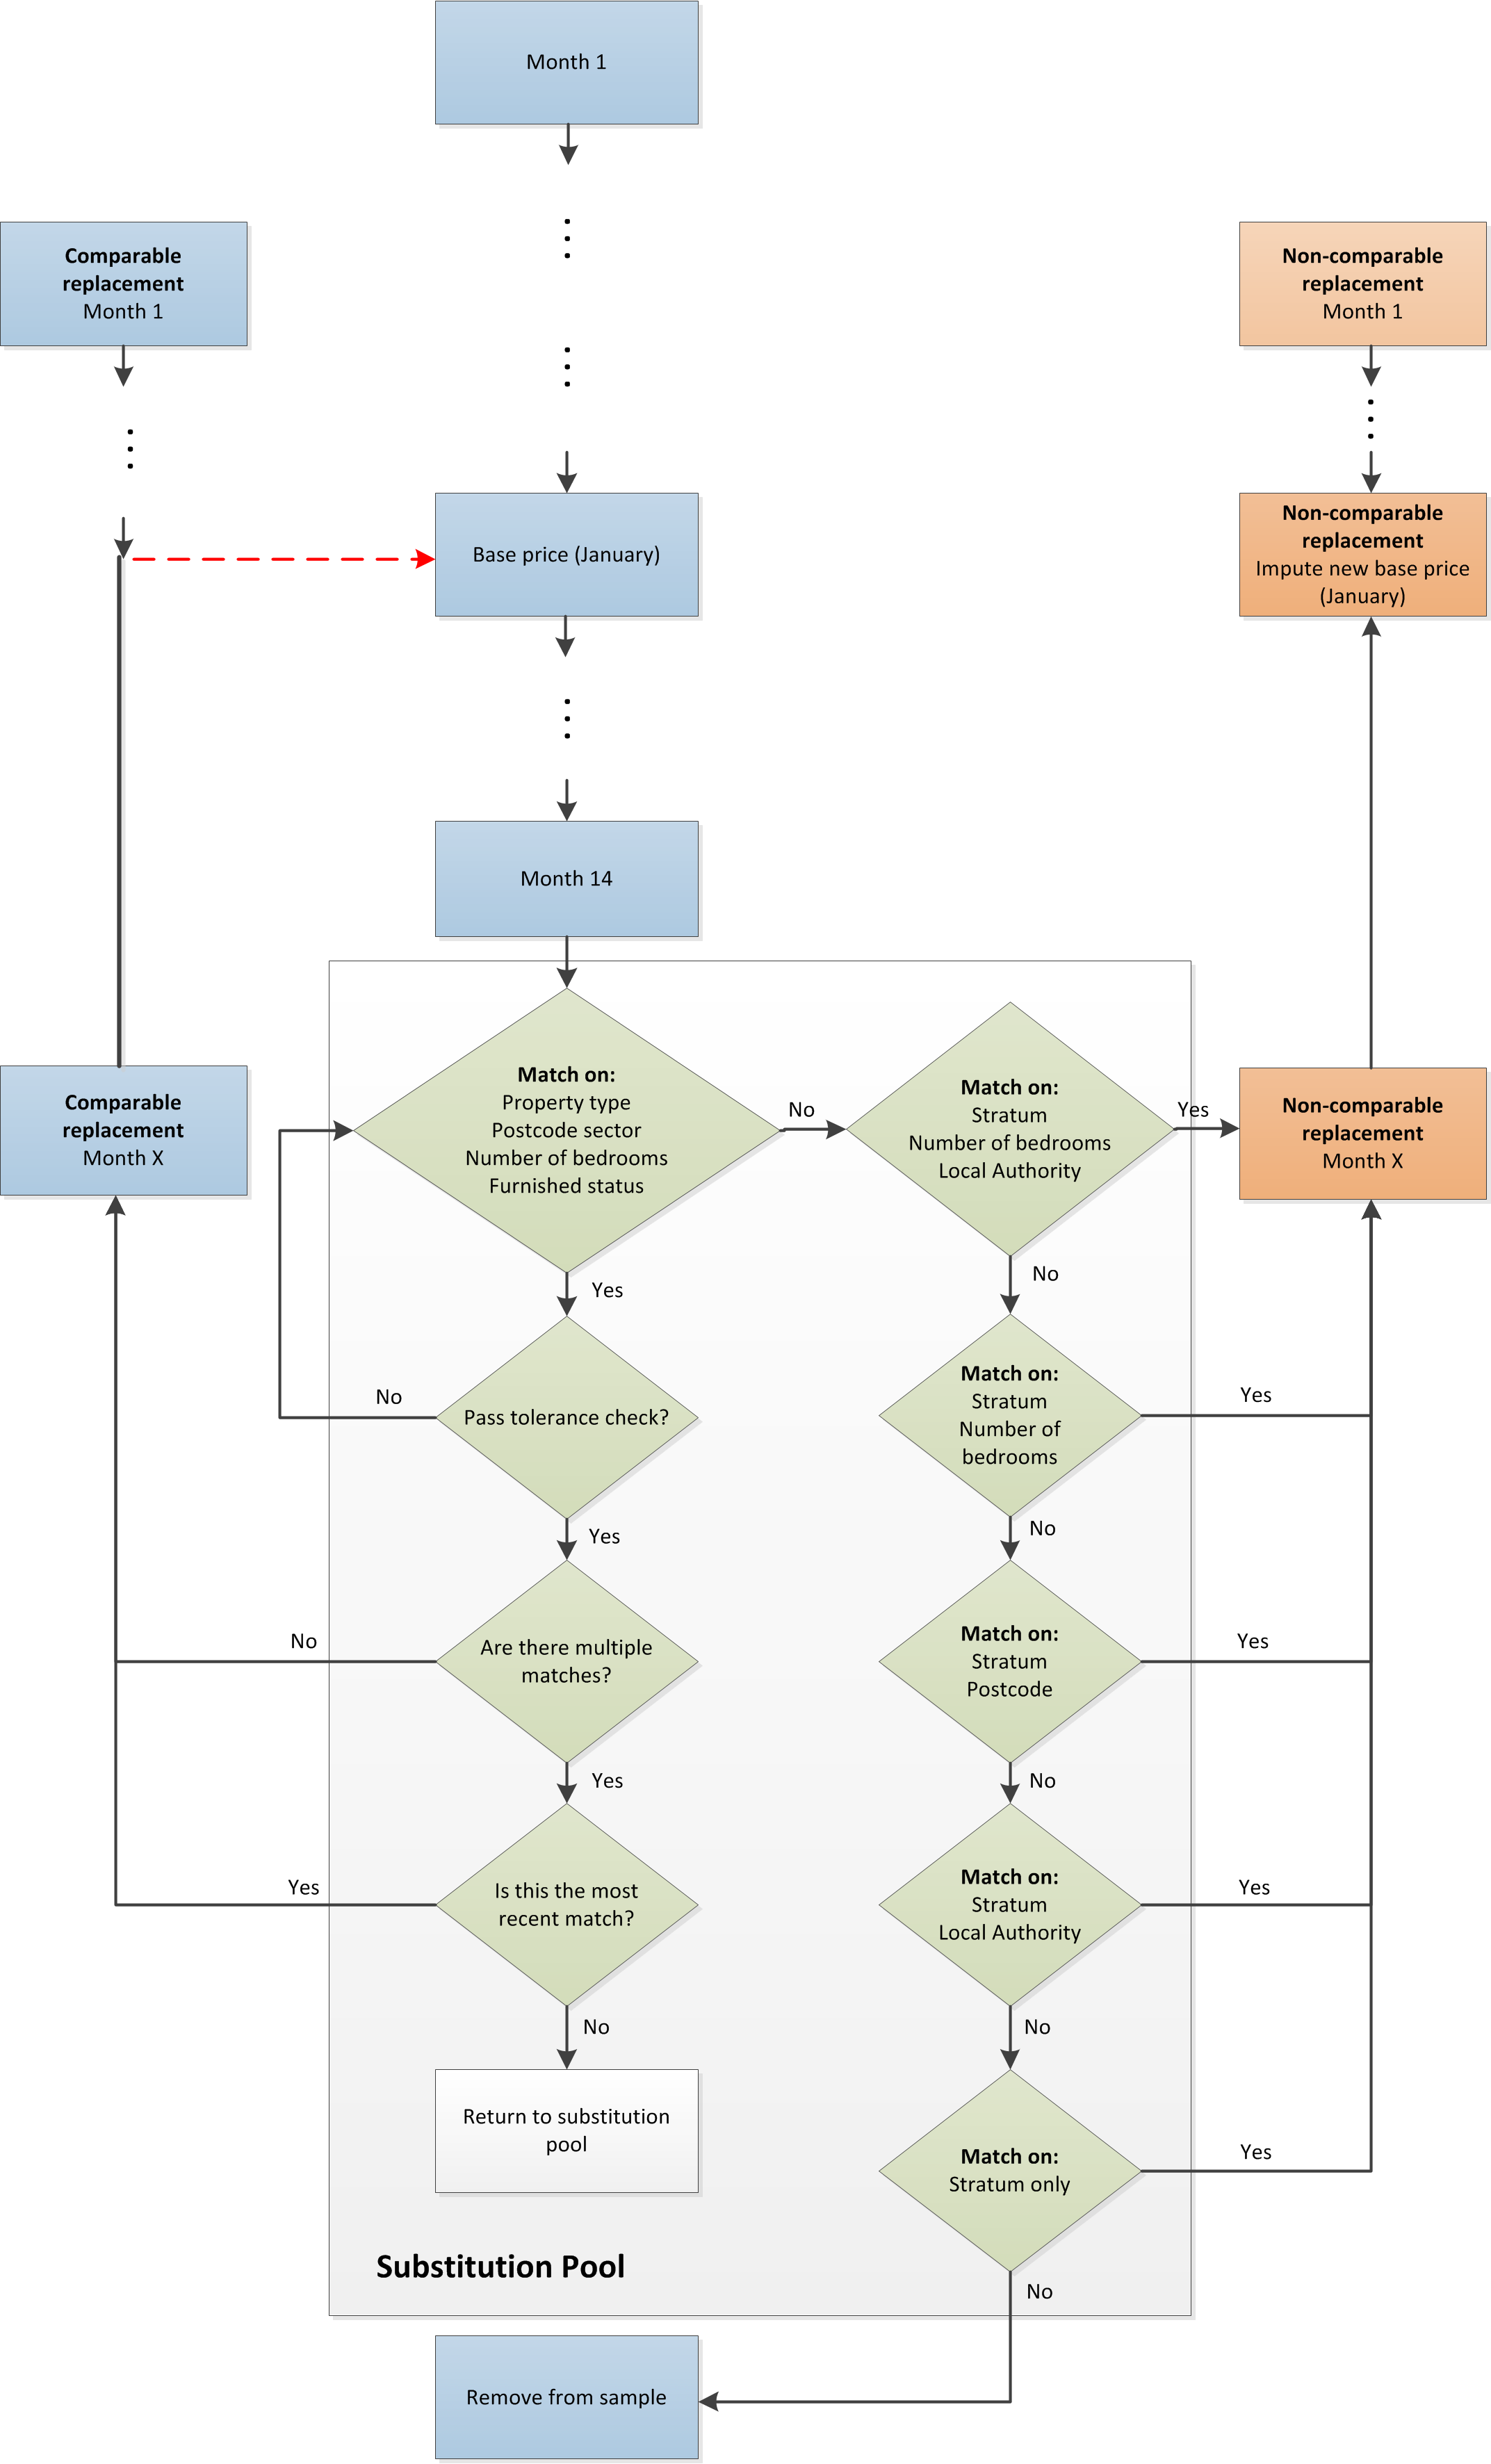
The England, Scotland, Wales and Northern Ireland data described above are then compiled into an OOH index by drawing a stratified random sample from different regions and property types. Half of the data are sampled, and the remaining half are used as a substitution pool, from which comparable replacements are drawn. Property prices remain valid for 14 months, and if no update is made during that period, a comparable replacement property is drawn from the substitution pool. If a comparable replacement property cannot be found, a non-comparable replacement is made, and a new base price is imputed. More detail on the sampling strategy is given in the following sections.
S2.2.1 Sample selection
A stratified random sample3 is selected from across the UK each January using half of all records collected over the previous 14 months. For example, the January 2016 sample includes prices for properties collected from December 2014 to January 2016. Within this process, duplicate records for the same property are removed so that the most recent record collected is used. Prices to rent a single room in a house in multiple occupancy (HMO) are also removed. The sample, therefore, will give a stock measure of rental prices; that is, both new and existing rentals are accounted for. This is in line with international best practice, although the Johnson Review (2015) points to recent research that suggests a flow measure may be worth considering; that is, only new lets.
The total sample count for the UK in 2016 was around 300,000. This sample is drawn in January and remains fixed throughout the year. Sample counts by region and property type for 2016 are presented in Tables 5 and Table 6 respectively. The remaining records form what is referred to at the substitution pool (see Section S2.6). The size of the substitution pool will fluctuate from month to month as old properties drop out of the data and new properties come in.
S2.2.2 Stratification
The process of stratification ensures that we capture any variation between strata. The data are stratified by Wales, Scotland and the nine regions of England. Each of these strata are then further stratified by property type, and then by whether the property is furnished or unfurnished. The property types used for stratification have been chosen to reflect the characteristics a consumer would consider when purchasing or renting a dwelling and are as follows:
- detached House
- semi-detached House
- terraced House
- flat or maisonette
Stratification results in 88 strata (11 regions multiplied by four property types multiplied by two furnished statuses). Whilst the sample is subdivided into many strata, the sample size in each stratum remains large, with the smallest sample size being 719, for a detached house in London.
For the purposes of calculating owner-occupiers’ housing costs, only unfurnished properties are used, as furnished properties are not representative of the OOH market. Unfurnished properties account for nearly 90 per cent of the sample.
Table 5: Rental price sample counts by region
| Region | Sample count |
|---|---|
| North East | 12,800 |
| North West | 33,300 |
| Yorkshire and The Humber | 28,600 |
| East Midlands | 28,500 |
| West Midlands | 22,000 |
| East | 25,300 |
| London | 34,800 |
| South East | 44,100 |
| South West | 46,100 |
| Wales | 13,210 |
| Scotland | 13,200 |
Table 6: Rental price sample counts by property type
| Property Type | Sample count |
|---|---|
| Flat | 131,500 |
| Terraced | 86,500 |
| Semi-detached | 49,200 |
| Detached | 34,500 |
S2.2.3 Monthly periods
For England, Wales and Scotland, a cut-off date of the 27th of the month, based on the entry date into the system, is applied to the private rental dataset to enable monthly processing. Therefore, each month the dataset covers the period from the 28th of the previous month to the 27th of the current month.
Due to current data collection practices, data will be lagged by around 1 month, as it can take rent officers up to 6 weeks to input prices into the collection database. It is unlikely that this would have any implications for the rental index, as rental values do not change much from one month to the next (see Figure E4 of the article Improvements to the measurement of owner occupiers’ housing costs and private housing rental prices). Therefore any price change will be slow.
S2.2.4 Validity period
To calculate a rental price index, the sample of properties is monitored for price change throughout the year. This is done by matching the records collected each month by rent officers to the existing sample. There is no formal procedure in place that requires rent officers to follow up the sampled properties, although around 40% of sampled properties are followed up around a year later. Therefore, when a rental price is collected, it is assumed to be valid for 14 months from its entry date into the system, or until an update is received. A 14-month validity period is used as it balances typical contract lengths (which tend to be either 6, 12, 18 or 24 months) against operational practices, in particular the time it takes rent officers to follow up the same property. There is an emphasis on following up properties between 12 and 14 months since they were last collected, and therefore there are methodological benefits (in terms of significantly improving the number of property updates) to using a 14-monthly validity period over using a 6-month period (which would only capture a very small portion of updates) or a 12-month period (which would capture around half of the updates). Moreover, the 14-month validity period has the additional advantage of mitigating for properties that were originally rented some time ago at much lower prices, as well as limiting the effect of depreciation.
Further information on the rationale for using a 14-month validity period is provided in the article Improvements to the measurement of owner-occupiers’ housing costs and private housing rental prices (see Annex D).
S2.2.5 Property price updates
The price of an existing property in the sample is updated when a match is identified in the data collected each month (referred to as the input dataset), and the price change is within the acceptable tolerance level (see Box 1). On average, around 0.1% of England updates fail the tolerance test4. If an update is made, the record entry date is amended and the rent for that record becomes valid again for up to 14 months.
Properties in the input dataset that do not match any records in the sample are added to the substitution pool to be used later in the processing. If an update fails the tolerance check then the property is deleted and not included in the sample or returned to the substitution pool.
| Box 1: Tolerance check The price update is deemed valid if it meets both of the following constraints:
New price < Previous price * 1.49995 |
S2.2.6 Comparable property replacements
If a property in the sample has reached the end of its 14-month validity period, and no price update has been made, a replacement property of comparable quality is sought from the substitution pool. A replacement is defined as comparable if it has the same:
- property type
- postcode sector5
- number of bedrooms
- furnished status (furnished or unfurnished)
and, has a price quote which meets the same tolerance checks applied to price updates (see Box 1 above).
If there is more than one potential replacement property, then the property collected most recently is chosen. When a comparable replacement is found, and it passes the tolerance test, then the property is used to replace the outgoing property in the sample. This replacement property maintains its original entry date into the system. By replacing the property that has expired with a comparable replacement, it is assumed that the replacement property is similar enough to the one that it is replacing that any difference in rent is due to price change, and not a difference in quality. If a replacement is found, but it fails the tolerance check, then the property is returned to the substitution pool and another replacement is sought. The comparable replacement procedure is summarised in Figure 1.
Figure 1: Flow chart of comparable and non-comparable replacement procedure
Source: Office for National Statistics
Download this image Figure 1: Flow chart of comparable and non-comparable replacement procedure
.png (268.6 kB)S2.2.7 Non-comparable property replacements and imputation
If a property in the sample has reached the end of its 14-month validity period, and a comparable replacement cannot be found, then the property is replaced by a non-comparable property in the substitution pool from within the same stratum. Although the replacement is non-comparable, an effort is still made to make the replacement property as comparable as possible to the property it is replacing. Therefore, the following priority order is applied to identify a non-comparable replacement:
- Match on stratum, number of bedrooms and Local Authority
- Match on stratum and number of bedrooms
- Match on stratum and postcode sector
- Match on stratum and Local Authority
- Match on stratum only
As the name suggests, the replacement property is deemed to be a different quality to the one it is replacing, and therefore the price of the new and replaced property cannot be directly compared. No explicit information is available to quantify the difference in quality; therefore an implicit approach is taken. A new January (base) price is calculated for the new property based on the movement of comparable replacements made within the same stratum in the same month; this movement is referred to as the imputation ratio. For more information about how the imputation ratio is calculated see Annex E.
Properties that have been used as non-comparable replacements are removed from the substitution pool and replace the expired property in the sample. The non-comparable replacement maintains its entry date into the system. If there is no non-comparable match available then the property is removed from the sample6. This information is summarised in the flow chart in Figure 1.
S2.3 Methodology used to aggregate private rental price indices to form the OOH component in CPIH and IPHRP
As covered in the previous section, the data are stratified by Wales, Scotland and the nine regions of England as well as by property type and whether the property is furnished or unfurnished. For each stratum, elementary aggregates are calculated which are then weighted together to create an aggregate index. Strata weights for OOH and IPHRP are updated annually. Strata weights for OOH are designed to represent the owner occupied market and strata weights for IPHRP are designed to represent the private rental market. For example, looking at the range of housing available on the market, there would be a larger proportion of lower quality rental properties (for example, one bedroom flats), and the weights calculated would reflect this mix. By comparison, the owner-occupied housing weights will reflect the larger proportion of higher quality properties (for example, three bedroom detached houses). Expenditure weights are calculated by multiplying dwelling stock counts for the owner occupied sector or private rental sector by average rental prices. The methodology for constructing the OOH index is described in more detail in the following sections.
S2.3.1 Elementary Aggregates
Elementary aggregates for England are provided by VOA, while we calculate elementary aggregates for Wales and Scotland, using the microdata, which are delivered on a monthly basis. All use the same methodology. The Jevons formula (the geometric mean of price relatives, using January as its base month) is used to aggregate private rent prices below the stratum level for OOH, IPHRP and the private rents component in CPIH, CPI and RPIJ. Using exactly the same underlying data, private rents for the RPI are aggregated below the stratum level using the Carli formula (the arithmetic mean of price relatives).
S2.3.2 Dwelling stock data
Dwelling stock data for the owner-occupied and rental sectors comes from the Department for Communities and Local Government (DCLG) for England and its regions. The data are collected via the English Housing Survey (EHS) which has a sample size of around 13,300 households. Similar dwelling stock data are also available from the Scottish Government for Scotland and the Welsh Government for Wales.
For the private rented sector, dwelling stock estimates are also split by the proportion of property types rented privately in Wales, Scotland and the nine regions of England. For the owner-occupied sector, a split by property type is only available at a national level so the same property type split is applied across all regions7.
S2.3.3 Average rental prices
Average rental prices, split by the nine English regions, property type and whether the property is furnished or unfurnished are provided annually by VOA. These averages are calculated using all of the rents data collected by VOA rent officers in the relevant year, and are therefore not directly comparable to the sample of rents followed for the private rents price indices.
We calculate the average rental prices for Wales and Scotland by using the microdata delivered on a monthly basis. Again, all the data collected in the relevant year are used to calculate these averages and therefore it does not compare directly to the sample of rents followed for the private rents price indices. The averages for a given year cover the period from February of the previous year to January of the current year. For example, the average price used for the 2014 weights is based on data from the period February 2013 to January 2014.
S2.3.4 Strata weight construction
To calculate timely expenditure strata weights, the most recently available data are used. For a given index year y, the expenditure shares are based on the time periods set out in Table 7.
Table 7: Source data for expenditure shares in index year y
| Period | |
|---|---|
| Dwelling stock data | y-3 years |
| Average prices data | y-1 years |
Total expenditure is calculated by multiplying dwelling stock counts by average rental prices for each combination of region or country, property type and furnished or unfurnished status. This is equivalent to using price-updated household expenditure data at a lag of 3 years. This is not out of keeping with the treatment of other below item level weights.
The relative expenditure weight for each stratum is then calculated using the aggregate level expenditure. For the equation used to calculate expenditure weights, please see Annex E.
As with the price sample, this weighting procedure gives 88 different expenditure weights for IPHRP, one for each of the nine English regions plus Wales and Scotland, four property types and furnished or unfurnished status. The OOH index has 48 different expenditure weights. As the index only uses unfurnished rents there is no furnished or unfurnished split, but it does include weights for Northern Ireland.
S2.4 Owner-occupiers’ housing cost weight in CPIH
The OOH component is aggregated with other items in the fixed basket of goods and services to form headline CPIH. As with other items, expenditure weights are used to aggregate the item indices (for more information see the Consumer Price Indices – Technical Manual). National accounts household final consumption expenditure (HHFCE) data are used to create the expenditure weights for many of the basket items, and the same is true of the OOH component, where HHFCE data on imputed rentals (the rental equivalence measure) are used.
National accounts data are generally preferred as the source of weights for the CPI and CPIH, and are consistent with other economic measures published in the Blue Book and Pink Book. The national accounts are compiled on a domestic basis (see Box 2), which is consistent with the HICP framework on which CPIH is based. By contrast, other measures, such as the Living Costs and Food Survey (LCF), measure expenditure on a national basis. National accounts data also cover a more complete range of goods and services, and follow the classification of individual consumption by purpose (COICOP) used in the HICP. Moreover, due to small sample sizes, the LCF data can be volatile.
| Box 2: Domestic and national expenditure Domestic expenditure is all expenditure that occurs within the economic territory. This includes spending by foreign visitors to the UK. This excludes spending by UK residents abroad. National expenditure is all expenditure by the resident population. This excludes spending by foreign visitors to the UK. This includes spending by UK residents abroad. |
S2.4.1 Calculation of the OOH weight
Imputed rentals expenditure data are taken from the latest available national accounts dataset, which is published in Quarter 3 (July to Sept), and is consistent with the most recent Blue Book release (typically published in June or September). The non-seasonally adjusted current price series for 0.4.2 Imputed rents is used. Imputed rents is aggregated from 2 component series: 0.4.2.1 Imputed rents for owner occupiers and 0.4.2.2 Other imputed rents, such as secondary residences and households paying free or reduced rent. The national accounts calculate imputed rentals expenditure by multiplying dwelling stock counts – sourced from DCLG – by average rental prices – which are sourced from the Valuation Office Agency (VOA), and the Welsh and Scottish governments as appropriate (see section S2.1). For the latest period, DCLG dwelling stock counts and average rental prices are not available, so the data are forecast using our standard forecasting principles.
National accounts estimates are produced on a volume and value (or current price) basis. For the imputed rentals component a value measure is initially produced. This is then deflated using a price index to create the volume measure. In 2014 national accounts started to use CPIH, and backdated this to 2010. From Blue Book 2016, CPIH is used for the entire time series. For more information on the calculation of imputed rentals expenditure, please see the article Changes to National Accounts: Imputed Rental.
Weights are updated annually with the January index, and there is a further update in February to coincide with the introduction of new items to the CPIH basket. For a given year y, the expenditure shares are based on the year y-2, reflecting the most up-to-date expenditure data available. This means that, in using the most recent data, the expenditure data used in the calculation of OOH weights reflect 1 period ahead forecasts. In January, expenditure weights are price updated to December of year y-1. Between February and December, expenditure weights are price updated to January of year y. This process is shown in Figure 2. The formula for this can be found in Annex E. For more information on price updating and chain linking, please see the article Assessing the impact of methodological improvements on the Consumer Prices Index, and the Consumer Price Indices – Technical Manual.
Figure 2: Process diagram for calculation of OOH weights

Source: Office for National Statistics
Download this image Figure 2: Process diagram for calculation of OOH weights
.png (18.4 kB)S2.4.2 Revisions to expenditure
Whereas national accounts estimates are typically revised, large revisions to expenditure, such as those seen in 2015, are rare. Consumer price indices are rarely revised; however, in 2016 and 2017 we made revisions to the OOH expenditure weights in CPIH. These revisions are described below.
2015 revisions
In 2015 we were made aware of substantial changes that were being made to the measurement of imputed rentals. This would introduce a large step change in the OOH weight. As improvements to the OOH index were being introduced in CPIH, we also took the opportunity to revise the OOH weights. This would mitigate a future step change, and put OOH weights on a consistent basis back to 2005. As this predated the publication of Blue Book 2016, national accounts estimated expenditure in an offline system. This was used to revise the OOH weight. Only the OOH series was revised.
2017 revisions
These unpublished estimates were, in fact, higher than the final Blue Book 2016 estimates. In March 2017 additional improvements were introduced into CPI and CPIH, and CPIH was revised to introduce Council Tax. This presented a further opportunity to revise the OOH weights and, in March 2017, the weights were revised to be consistent with final Blue Book 2016 expenditure back to 2005. This means that the step change in OOH weights has been avoided and they are as up to date as possible.
Revisions were based on expenditure from year y-2, and price updated to the appropriate month (as described in section S2.4.1). This is consistent with our usual methodology. This means that from 2017 onwards OOH expenditure weights will be based on national accounts forecasts, as usual. However, from 2005 to 2016 OOH expenditure weights are based on the actual data.
National accounts revisions
The large revisions seen in Blue Book 2016 were revisions to the methodology. In the national accounts methodological changes are revised for the whole time series. The history of methodological revisions to imputed rentals is as follows.
In 2013, there were some changes to the measurement of intermediate consumption for imputed rentals, which were relatively large
There were also some changes made for Blue Book 2014, which introduced an interim fix to make the current price and chained volume measures consistent. This had an impact in 2014 and 2015 and was revised back to 2010, in line with the Supply-Use revisions window. These changes were relatively small in comparison to the Blue Book 2016 changes.
Large scale improvements to the calculation of imputed rentals were introduced in Blue Book 2016.
There are some small refinements planned for Blue Book 2017
There are no further methodological changes planned for imputed rentals.
Revisions to the national accounts based on updated data are only revised back 2 years. Data revisions are made every year. Historically data revisions have not been large; however, given that the methodology has been improved it is difficult to say what these data revisions will look like in the future. We do not expect to revise the expenditure weights in the foreseeable future.
There are other factors that can cause the data to be revised, such as the supply-use balancing process. For more information on the national accounts revisions policy see Revisions policies for economic statistics.
S2.5 Summary
In summary, unfurnished rental price data from VOA, the Welsh and Scottish governments, and Northern Ireland data from the local price collection are compiled into price indices for each of 12 regions and 4 property types. These are weighted together using “strata weights” that reflect the OOH market to form an OOH index. Strata weights are constructed from DCLG dwelling stock counts (lagged by 3 years) and average rental prices (lagged by 1 year). This OOH item level index is then weighted into CPIH using OOH weights, based on national accounts HHFCE expenditure data. These data are lagged by 2 years, consistent with other item level CPIH weights. The structure for aggregating OOH data into CPIH is summarised in Figure 3.
Figure 3: OOH aggregation structure
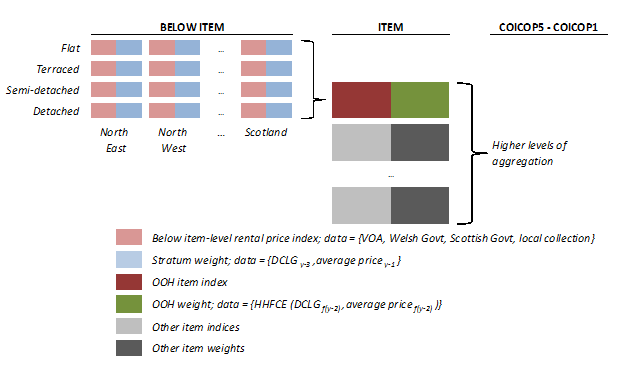
Source: Office for National Statistics
Download this image Figure 3: OOH aggregation structure
.png (14.1 kB)S2.6 Net acquisitions methodology
In the preceding sections we have discussed the construction of the rental equivalence measure of OOH, which is used in the CPIH. As discussed in Section S1, we currently also produce an OOH measure for Eurostat following the net acquisitions approach. As this experimental index contributes to the discussions on the preferred choice of OOH measure, the methodology used to construct it will be presented in this section. We follow the methodology prescribed by Eurostat. This aggregates component sub-indices measuring different aspects of OOH costs into two classes; those related to the acquisition of dwellings, and those related to the ownership of dwellings.
The ideal method for excluding the land component in OOH(NA) is the net/net approach, whereby prices and weights both exclude the land component (and therefore the asset price) from the house purchase. However, as many member states (including the UK) are unable to implement the net/net approach due to a lack of available data, Eurostat requires all member states to use the net/gross (net weight, gross price) approach. So, for example, the HPI is used to measure price changes for the “Acquisition of New Dwellings (excluding land)” component. The HPI, however, does not separate into land and dwelling components, so the total house price is used. This is the gross price approach. On the other hand the expenditure weights for the same component are for the dwelling costs and do not include the cost of land. This is the net weight approach. This means that the net acquisitions approach presented here will include some measure of asset price in the index. The sources of price and expenditure data for all of the components are presented in Table 9. With the exception of the stamp duty index, all are drawn from our existing publications, including the Producer Price Index (PPI) and Retail Prices Index (RPI).
The source of component expenditure weights used to compile OOH(NA) are derived from the National Accounts Gross Fixed Capital Formation (GFCF) and Household Final Consumption Expenditure (HHFCE). The “net” principle in net acquisitions relates to the fact that only transactions that occur between the OOH sector and other sectors (for example, construction firms and private landlords) should be included. However, we cannot currently distinguish between sectors, and therefore the weight for “Acquisition of New Dwellings” includes expenditure on all newly constructed dwellings and not those specifically destined for the OOH sector as per the methodology outlined by Eurostat. In addition, a weight for “Existing Dwellings New to the OOH Sector” does not exist; therefore, a zero weight is currently applied. The “Other services related to ownership of dwellings” is based on the national accounts series 04.4.4 Other services relating to the dwelling and has zero expenditure recorded in Blue Book 2016. It therefore has a weight of 0 in the net acquisitions approach, and is excluded from the calculation.
Table 9: Data sources for the net acquisitions measure of OOH
| Acquisition of dwellings | Ownership of dwellings | ||||||
|---|---|---|---|---|---|---|---|
| OOH(NA) Indices | Acquisitions of New Dwellings (exc. Land) | Self Builds and Renovations | Existing Dwellings new to the OOH Sector | Services Related to Acquisition | Major Repairs and Maintenance | Insurance Connected with the Dwelling | Other services related to ownership of dwellings |
| Source of Price Data (gross) | HPI | PPI and HICP | HPI | RPI and a stamp duty index | HICP | RPI | No price index |
| Source of Weights Data (net) | GFCF | GFCF | No weight currently exists | HHFCE and GFCF | HHFCE | HHFCE | HHFCE |
The net acquisitions measure of OOH can be found on our website. We also publish a quarterly article which compares the different measures of OOH against one another, and includes an analysis of the contribution of the different components of the net acquisitions measure. The latest release can be accessed on our website.
Notes for Section 2: Constructing the rental equivalence measure of OOH:
- Introduced in England, Wales and Scotland in April 2008, the LHA is a flat rate allowance paid to housing benefit claimants living in private sector accommodation. LHA rates depend on the rental prices in the surrounding Broad Rental Market Area (BRMA) that the rented property falls in, and discounts are applied for the number of bedrooms in the property. They are set as the lower of the 30th percentile on a list of rents in the BRMA, or the existing LHA. Prior to this, the LRR was used and still applies to those who have claimed Housing Benefit without a break from the same home since before the introduction of the LHA. The LRR is the mid-point between what, in the Rent Officers’ opinion, are the highest and lowest non-exceptional rents in a BRMA.
- For more information see the Consumer Price Indices - Technical Manual.
- Stratification is the process of subdividing the population into subgroups of similar units, which are sampled independently. Each unit will belong to one and only one group. A random sample is then drawn from each stratum.
- Based on data from February to June 2016.
- UK postcodes consist of an outward and inward code. The outward code comes before the single space in the middle, and the inward code come after the space. Postcode sectors are made up of the outward code and the first character of the inward code. For example, NP10 8 is the postcode sector for NP10 8XG. On average there are approximately 2,300 properties in a postcode sector.
- In practice this is very rare. For example, between January 2012 and December 2014 this only occurred in one month.
- A detailed description of the surveys and methods used to derive dwelling stock estimates for the privately rented sector is available.
5. Section S3: Maintaining the quality of the OOH component of CPIH
In Sections S1 and S2 we demonstrated how the rental equivalence approach is the most suitable measure of owner occupiers’ housing costs (OOH) costs in the UK due to the exclusion of asset prices, and how its construction is underpinned by a large, good quality source of rental data, which is representative of the rental market. For more information on the quality of data sources that feed into CPIH, please see the Quality Assurance of Administrative Data (QAAD). To ensure that the quality of the index is maintained over time, it is important to be mindful of issues that have the potential to bias or impact on the precision of the index. We therefore turn now to the sources of bias that have the potential to impact on the OOH component of CPIH. We consider this first in the context of the data sources and the method of sampling, before discussing political events that may impact on data collection or the general level of rents. Finally we reference some user concerns that have been raised regarding the OOH component of CPIH.
S3.1 Data
While we do not have direct access to the Valuation Office Agency (VOA) microdata, robust procedures have been put in place to ensure that the potential for errors is minimised. Our staff were involved in designing the methodology and systems for VOAs production of the elementary aggregate indices. Service Level Agreements (SLAs) are now in place between ourselves and VOA, and we are notified of any changes to systems. Changes are quality assured by our staff. VOA also provides us with quality assurance documentation. We do not have direct access to the microdata for Wales and Scotland, so this can be used to test new methodologies.
The data collected may not be perfectly suited to the measurement of OOH on a rental equivalence basis, as the primary purpose of the data is for the setting of Local Authority rents. However, this is true of all administrative data sources. The sample itself is large and representative of the target market, and stratum weights are used to mix adjust the sample to reflect the OOH population (Section S2.3).
The sample for the Northern Ireland stratum is very small. This is because it is still based on the local collection method used elsewhere in the Consumer Prices Index (CPI). With the improvements in the Northern Ireland Housing Executive’s private rental data, which are now available monthly (formerly bi-annually); We hope to introduce improvements in line with the methodology for England, Scotland and Wales. Data for Scotland are based on advertised rents rather than achieved rents. While this is a potential source of bias, the property services group Countrywide published evidence to suggest that achieved rents in Scotland are 99.7% of advertised rents, suggesting that it makes little difference.
S3.2 Sampling and representativity
One potential source of bias arises from the fact that rental data are collected using purposive sampling rather than a probability sample. Rent collectors aim to capture at least 10% of private rentals using census counts as a target. As with the local price collection, where price collectors use their market knowledge and retailer knowledge to select an item which is representative of consumer expenditure, rent collectors use their knowledge of the rental market to select rents that are as representative of the market as possible. Of course, the rental market may not necessarily be representative of the owner-occupiers’ housing market. We would expect, for example, that in the rental market there are a greater number of flats and smaller houses, whereas the owner-occupiers’ market may be dominated by standard and larger-sized houses. This potential source of bias is mitigated by mix adjustment (see Section S2.3). In other words, the stratum weights are used to weight the rental data so that they reflect the owner occupier population. Due to the large sample size, we retain a reasonable sample in even the smallest strata (719 for detached houses in London). Moreover, certain property types are excluded from the VOA sample, such as halls of residence, and housing benefits claimants.
The original sampling methodology meant that, in some strata, it was difficult to follow products over time, resulting in non-comparable substitutions. The substitution pool method (described in Section S2.2) with the listed priorities for matching has improved this situation.
S3.3 Methodology
On 14 August 2014, the National Statistics status of CPIH was suspended due to required improvements to the comparable replacement of properties. These improvements were identified following concerns from users over the disparity between our average private rental prices, and those derived from other sources. We have worked with our suppliers to improve processing and methodology. In particular improvements have been made to the method for identifying and matching comparable replacements and reassessing the validity period. These are described in Sections S2.2.6, S2.2.7 and S2.2.4 in more detail. We are also monitoring its sources of rental data against other potential sources. We submitted its evidence for assessment of CPIH as a National Statistic to the UK Statistics Authority on 26 September 2016. The evidence contains a suite of new and updated publications, which will be used over a period of time to monitor the behaviour of the index, and increase awareness and confidence in CPIH. We hope for CPIH to be awarded National Statistic status in the first half of 2017
S3.4 Proxy measurement
There may be some bias arising from the use of rental equivalence as a proxy to measure owner occupiers’ housing costs, as it does not measure the ongoing consumption of OOH directly. Rental equivalence is imputed from actual rentals which include some premium set by landlords to cover the costs of maintenance. To avoid double-counting, goods and services that landlords would pay for are not included separately. For example, landlords pay for buildings insurance and major repairs, so these should not be separately priced elsewhere in the index when rental equivalence is used for OOH costs. Using rents as a proxy does not counter the general economic principles of using the rental equivalence method to measure OOH.
S3.5 Continuation of data sources for CPIH
The continuation of data sources is crucial in the compilation of a long-term credible price index. The rental equivalence method in CPIH depends on the collection of private rents data by the VOA in England, and by the Scottish and Welsh Governments in Scotland and Wales respectively. There are three main issues that could impact on the collection of rental data in the future: rent controls, a falling sample of rental properties, and a change in housing benefit policy.
S3.5.1 Rent controls
Rent controls are government-mandated controls which place a maximum price on what landlords may charge tenants. To have an impact, they need to be set at a level below the market rate. Given the general economic principles that underlie the rental equivalence approach, the rental equivalence approach to measuring OOH could introduce a downward bias on the index if rent controls are introduced. It is believed that this is unlikely to happen, however.
S3.5.2 Sample size
The current government priority to increase the levels of home ownership through various policy measures may result in a small decrease in the sample of rental properties. This could impact on the collection of data because of the need to sample enough properties for a representative mix of housing. However, this is countered by the fall in home ownership that has occurred since the economic downturn in 2008, and the corresponding increase in private renting.
S3.5.3 Policy changes
Finally, government policy on housing benefit may change in a way that would mean rental prices would no longer be needed to calculate the levels of benefit awarded, removing the need for data collection by the VOA and devolved administrations. We would be notified in advance of any change in data collection through the Service Level Agreements (SLAs) with VOA.
S3.6 User concerns
As discussed in Section S1, there are several methods that may be used to measure OOH, each of which has strengths and weaknesses. Our decision to use the rental equivalence approach is based on pragmatic choices, taking all of the quality dimensions into account. In making our decision we received expert advice from CPAC, and the Johnson Review (2015) has subsequently recommended that “ONS should continue to produce CPIH using rental equivalence as the method for calculating owner occupiers housing costs’ and ‘work towards making CPIH its main measure of inflation”. We are confident in our decision to use the rental equivalence measure of OOH costs; however, a decision of this type is unlikely to find universal approval. We recognise that some users have expressed concerns. These concerns are summarised below, and references are provided to where these issues are discussed in more detail.
This section provides an index list of concerns for users to reference. The index refers to the relevant page in this compendium where these issues are discussed further.
S3.6.1 Conceptual
i. The use of a proxy to estimate OOH is inappropriate All of the methods have drawbacks and benefits. The rental equivalence measure is the only method that effectively captures the cost of consumption by excluding asset prices. Additionally, it is based on a good quality data source, and is commonly used in other national statistical institutes (NSIs). For more information see Section S1.2.5 on accuracy and Section S3.4 on proxy measurement.
ii. A stock measure inappropriately reflects depreciation Properties remain in the sample for a maximum of 14 months. This will limit the effect of depreciation. For more information see Section S2.2.4 on the validity period. Additionally, the Johnson Review (2015) recommended exploring a flow measure of rental equivalence, and this will be reflected in our Work Programme for Consumer Price Statistics.
iii. Costs to owner occupiers are different to costs faced by tenants; landlords are influenced by the rental market when setting rents
Under the economic concept of “opportunity cost”, rental equivalence captures the money forgone if the owner occupier chooses to live in their house, rather than not living in it and renting it out. Furthermore, a spotlight analysis of the relationship between rental prices and house prices, presented in the article Understanding the different approaches of measuring owner occupier’s housing costs, suggests that it is reasonable to expect there to be a relationship between rents and house prices in the long term. For more information see Section S1.1.3 on rental equivalence.
iv. Fees paid to letting agents, un/partially refunded deposits and compulsory maintenance fees are omitted With the exception of deposits these items are not rental costs and their price movements will be based on the representative item in the basket used to reflect their expenditure class. These costs are likely to be a small part of the total costs.
S3.6.2 Credibility
i. Rental equivalence is unnecessarily complex, and is not credible to the public Whilst some people may find the rental equivalence method a harder concept to grasp, none of the measures are straightforward, and it is the only measure that accurately reflects the cost of consumption to owner occupiers. It is based on a good quality source of data, is relatively widely used internationally and is consistent with National Accounts methodology. For more information see Section S1.2.1 on accessibility and clarity.
ii. The difference with average rents is implausible
Following concerns over the difference between our average rents and other sources we have made improvements to the methodology for selecting comparable replacement properties. Research has suggested that our data sources are comparable with other rental market data. For more information see Section S3.3 on methodology, Annex A.3 on IPHRP revisions, and the article Improvements to the measurement of owner occupiers’ housing costs and private housing rental price indices. We also publish a comparison of different sources of rental data alongside the IPHRP monthly release.
iii. The quality of the measure needs to be demonstrated over a period of time
We publish a quarterly OOH analysis article, in which the rental equivalence measure is compared to other measures of OOH. Different sources of rental data are also monitored on a monthly basis, and are published alongside the Index of private housing rental prices (IPHRP).
S3.6.3 House Prices
i. The measure does not follow house price booms and busts
ii. House prices should be included to allow monetary policy to address house price bubbles
Rental equivalence measures the flow of services consumed by owner occupiers. The measure is not designed to capture the change in asset prices, and so there is no a priori reason why the measure should follow house price booms and busts. We also publish a house price index which captures booms and busts in the housing market, and is used as a key economic indicator by the Monetary Policy Committee (MPC) alongside the CPI. For more information see Section 1.2.4 on relevance.
iii. A payments approach would better reflect actual inflationary pressures to the consumer The payments approach is inappropriate because of the inclusion of interest, which is not appropriate for a measure of consumption. For more information see Section S1.2 on the rationale for the rental equivalence method.
S3.6.4 International
i. Eurostat supports a net acquisitions approach
ii. Rental equivalence is inconsistent with HICP principles
Eurostat is considering the net acquisitions method for inclusion in the HICP. The rental equivalence method was ruled out because it is inconsistent with HICP principles on imputation, and because many countries do not have the necessary rental market to estimate the rental equivalence measure. Nevertheless, rental equivalence is widely used internationally. CPIH is intended to be a measure for the UK, that can be developed to suit the particular needs of the UK. Therefore it is necessary for CPIH not to be restricted by European methodology. For more information see Section S1.2.3 on comparability.
iii. CPI is based on the acquisition approach, not use
Whilst the CPI is intended to be on an acquisitions basis, this is not always the case. The ICLS resolution (2003) acknowledged that it may be necessary to adopt a mixed approach, particularly with respect to OOH. For more information see Section S1.2.4 on relevance.
S3.6.5 Statistical
i. We do not have access to VOA microdata
Our staff have worked closely with VOA staff to ensure that methodology, systems and procedures are in line with our standards. For more information see Section S3.1 on data, Annex A.3 on revisions to private rental indices, and the QAAD.
ii. The VOA sample is not random; the data are unrepresentative
Rent officers are instructed to collect rents that are representative of the rental market to ensure that the sample is as representative as possible. For more information see Section S2.1.1 on England data and Section S3.2 on sampling and representativity.
iii. Stratification of DCLG data is limited
We consider that the stratification of expenditure weights for mix adjustment is of a suitable quality. Nonetheless we intend to explore ways to create a regional split using alternative sources of data. This is reflected in the Work Programme for Consumer Price Statistics. For more information see section S3.2 on sampling and representativity (page 36).
iv. Northern Ireland prices are collected by survey
The stratum weight applied to the Northern Ireland index is very small. Therefore it has a limited impact on the overall OOH index. NIHE are currently undertaking a programme of development to improve the timeliness and extend coverage of rental data. We will be exploring the potential of this data to improve the private rental component for Northern Ireland, and this will be reflected in the Work Programme for Consumer Price Statistics. For more information see Section S2.1.4 on Northern Ireland data.
v. Quality changes in the rental sector are not accounted for
Within the year, if a property drops out of the sample, we can make a comparable or non-comparable replacement. Comparable replacements are deemed to be of similar quality and, for non-comparable replacements, a new base price is imputed. The sample is updated each January to reflect quality changes in the current rental stock. In line with the Johnson Review (2015), we are currently reviewing the monitoring procedures for non-comparable replacements and this is reflected in the Work Programme for Consumer Price Statistics. For more information see Sections S2.2.6 and S2.2.7 on comparable and non-comparable replacements, and Section S2.2.1 on sample selection.
S3.6.6 Weights
i. National Accounts OOH weights are not stable
Whereas national accounts data can be revised, the large revisions seen in 2015 are rare. By contrast, the Living Costs and Food Survey has a relatively small sample size, which means that the data can be volatile.
ii. More explanation of the derivation of weights for housing is required
More detail on the weights for the OOH component are provided in Sections S2.3 and S2.4 on Stratum weights and OOH weights respectively.
S3.6.7 Other
i. Consistency with national accounts is not relevant to a measure of price change
Coherence with other statistics is a desirable (but not essential) condition. Coherence is one of the quality dimensions which the Government Statistical Service (GSS) adheres to. In addition to being consistent with National Accounts methodology, and more importantly, the rental equivalence measure is the only measure that effectively measures the cost of consumption, and is based on good quality data sources. It is also widely used in other NSIs, where a measure of OOH costs is included in the headline measure of inflation. For more information see Section S1.2.7 on coherence and the summary in Section S1.2.8.
We acknowledge user’s concerns, and we recognise that these concerns may evolve or change over time. As such, we continue to welcome challenge and will hold structured dialogues with our users to address these concerns. We will continue to present analysis to aid understanding of the different approaches of measuring owner occupiers’ housing costs on a quarterly basis. This article includes a spotlight section, which will focus on more specific pieces of analysis on the OOH measure. We will consider using this section to provide additional analysis based on user concerns. This section of the CPIH compendium is also intended to evolve with these concerns.
Back to table of contents6. Section S4: Future work
As the lead measure of consumer price inflation, CPIH is an important and influential statistic. We are committed to maintaining the quality of the index. This includes continuing an ongoing programme of development for the index, as well as monitoring the behaviour of the index over time.
We will continue to present analysis to aid the understanding of different approaches of measuring owner occupiers’ housing costs (OOH) costs in the UK, which we will update on a quarterly basis. This will be published alongside the net acquisitions measure of OOH which is produced for Eurostat. Additionally we will continue to compare its sources of rental data against other sources. This analysis will be published alongside the Index of private housing rental prices (IPHRP). These outputs will allow us to monitor the OOH measure over time.
We will also continue to explore ways to improve the OOH measure. We will explore improving the OOH index for Northern Ireland through alternative sources of rental data, such as the emerging data source from the Northern Ireland Housing Executive (NIHE). We will also be exploring data sources that will allow us to identify a regional breakdown of the stratum weights. In line with the Johnson Review (2015), we will also consider whether a flow measure of rents would be more appropriate. These developments are all reflected in our Work Programme for Consumer Price Statistics.
Further improvements to CPIH will be introduced in March 2017, when Council Tax will be introduced into the index. In 2012 CPAC recommended that Council Tax should be in CPIH, and this advice was supported by the Johnson Review (2015), which recommended that ‘the UK Statistics Authority should consult on including council tax in CPIH’. Following the consultation, in his letter of the 9 March 2016, the National Statistician stated that we will be preparing to include Council Tax in the CPIH calculation. Council tax will be included in the February 2017 index, published in March. Although consumer price indices are rarely revised, we will take this opportunity to revise the OOH component of CPIH to bring expenditure weights into line with the latest National Accounts estimates, and also include Council Tax in the index back to 2005.
We will review the Quality Assurance of Administrative Data (QAAD) on an annual basis, and other important documentation, such as the Users and Uses paper, the Work Programme for Consumer Price Statistics and this compendium will be updated as required.
This work is important to ensure the future success of CPIH, and to help establish it as the leading measure of consumer price inflation in the UK. We welcome feedback on the development of CPIH from users, who can get in touch with us through the following channels:
Email: cpi@ons.gov.uk Address: Christopher Payne, Prices Division, Office for National Statistics, Cardiff Road, Newport, NP10 8XG.
Back to table of contents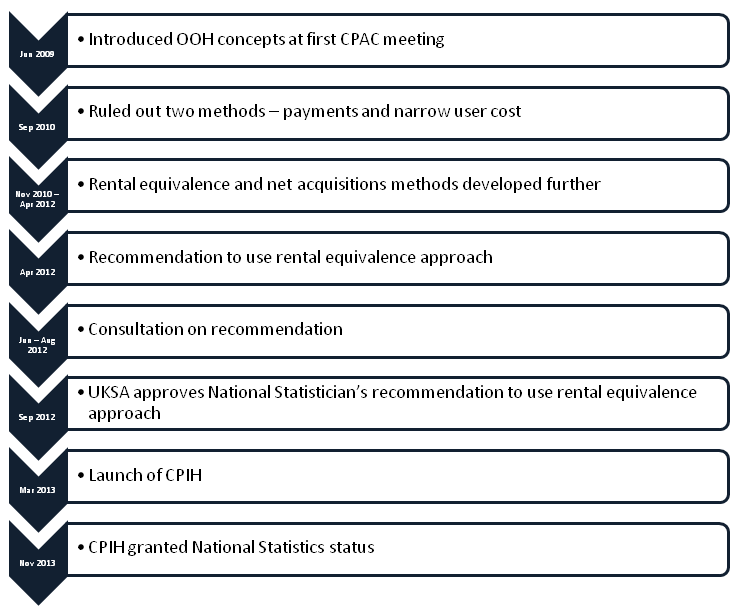
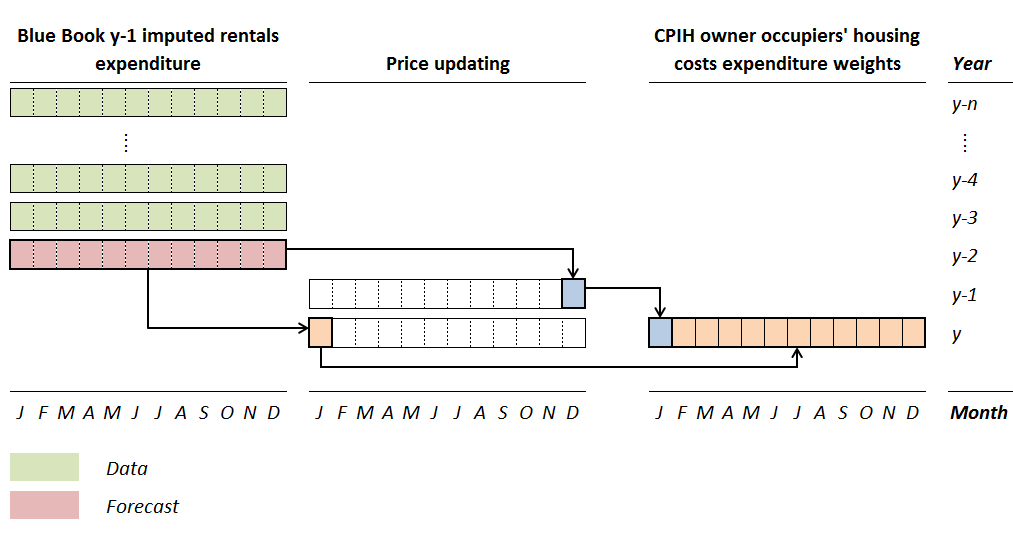