Table of contents
- Main points
- Things you need to know about this release
- Summary of results
- Retired and non-retired households’ experience of changing prices and costs
- Low-income and high-income households’ experience of changing prices and costs
- Experience of changing prices and costs for households with and without children
- Experience of changing prices and costs for households of varying tenure types
- Glossary
- Quality and methodology
- Annex A: Student loan repayments methodology
1. Main points
This bulletin presents the second preliminary estimates from the work completed to date on developing the Household Costs Indices; experimental indices are presented for UK household groups over the period January 2005 to December 2018, an all-households index is provided for reference.
The household group indices are compared with measures of nominal disposable income growth to demonstrate how these groups are faring in the economy between financial year ending (FYE) 2006 and FYE 2018.
Retired households have experienced stronger rises in their prices and costs than non-retired households over the periods explored, with price rises for retired households averaging 2.7% per year, compared with 2.3% for non-retired households; however, the disposable income received by retired households has grown considerably more than the disposable income received by non-retired households.
Low-income households observed stronger rises in their prices and costs than high-income households, with poorer households (represented by the second income decile) seeing average annual price rises of 2.6%, while richer households (represented by the ninth income decile) saw annual average price rises of 2.2%.
Households that own their own homes have seen much slower cost increases (2.3% per year on average) than either privately renting households (2.5%) or socially renting households (2.7%); when comparing with incomes, privately rented and owner-occupied households have seen slightly stronger increases in incomes relative to their costs than socially rented households.
2. Things you need to know about this release
What are the Household Costs Indices?
The Household Costs Indices (HCIs) are a set of experimental measures, currently in development, that aim to reflect UK households’ experience of changing prices and costs. More specifically, they will aim to measure how much the nominal disposable income of different household groups would need to change, in response to changing prices and costs, to enable households to purchase the same quantities of goods and services at a fixed quality. Put simply, the broad approach of the HCIs is to measure changes in the cost of outgoings of households.
The HCIs complement our other measures of price change:
the Consumer Prices Index including owner occupiers’ housing costs (CPIH), which is our most comprehensive measure of inflation and is based on economic principles (measuring changes in the cost of consumption goods and services is extremely important for measuring economic activity in the UK)
the Consumer Prices Index (CPI), which is also based on economic principles but omits certain housing costs; it is an internationally comparable measure
the Retail Prices Index (RPI) – a legacy measure that only continues to be produced for ongoing use in pre-existing gilts and long-term contracts
For more information, please refer to the article, Measuring changing prices and costs for consumers and households.
Since initiating development of the HCIs, a number of methodologies have been explored that result in the indices showing different growth rates to the UK's lead measure of inflation, the CPIH. Several of these were incorporated in the Household Costs Indices, UK: first preliminary estimates 2005 to 2017, published in December 2017. The areas that were explored, the impact that these methodologies would have if they were applied uniquely to the CPIH, and the cumulative impact of these changes are provided in the article Household Costs Indices: methodology.
For the first release, the following methodologies were applied:
the use of democratic weighting
a payments approach to owner occupiers’ housing costs (OOH)
the use of gross expenditure to calculate the weight for insurance premia
inclusion of a measure of interest on credit card debt
For this release the following new methodology has also been applied:
- measuring the repayment of student loans, rather than the price of tuition fees
A further article, Household Costs Indices, second release: methodology, will be published at a later date. This article will extend the analysis from the first methodology article to explore the impact of including student loan repayments. The article will also provide analysis from some early development work on constructing a measure of capital mortgage repayments and present drivers of the changes in HCIs from the previous December 2017 release.
Information on how the student loan repayments index has been calculated is presented in Annex A of this bulletin.
For this release we have also updated our measure of owner occupiers’ housing costs in line with the measure produced for the article Measures of owner occupiers housing costs, UK: April to June 2018. The main change is that Council Tax has been removed from owner-occupied housing, in line with our other measures of owner-occupied housing. It is instead treated as a separate item, reflecting that it is a cost for all households rather than just owner-occupiers. We continue to include owner occupiers’ housing costs on a payments basis. More information can be found in the Spotlight section of the previously mentioned article.
There have been some further methodological improvements to the mapping used to construct expenditure estimates at the household level using Living Costs and Food Survey data, in line with the methodology used for our CPIH subgroups publication. For more information, please see the Quality and Methodology Information for CPIH-consistent inflation rate estimates for UK household groups: 2005 to 2018, published in May 2018.
All other methodology remains consistent with the calculation of CPIH.
The HCIs are still in development, and as such future estimates of the HCIs are expected to have different, or additional, items in scope. Furthermore, some of the aspects of methodology presented in this bulletin may be improved. Therefore, the aim of this bulletin is to update users on progress towards development of the HCIs. For more information on other proposals that have been suggested for the HCIs, please refer to Developing the Household Costs Indices.
What household groups are presented in this bulletin?
This bulletin will cover the following household groups:
retired households and non-retired households
household groups by equivalised disposable income deciles
households with children and households without children
households categorised by tenure type: subsidised rented, rented and owner-occupied
For definitions of these terms, please refer to the Glossary in Section 7.
Expenditure for each household group is derived using a combination of data from the Living Costs and Food Survey, and Household Final Consumption Expenditure in the national accounts. For more information on how they are constructed, please see Household Costs Indices: methodology.
The indices for household groups are compared with an all-households index, constructed using the same methodology.
If you would like to provide feedback on the choice of household groups presented, please send comments by email to cpi@ons.gov.uk.
What is the structure of this release?
For each set of household groups, a similar structure is presented. The expenditure patterns for the household groups are covered first, followed by the average annual growth rates. Contributions to the change in the 12-month growth rate are presented, which highlight some of the main drivers of the growth rate for each household group.
The index for each household group is then compared with the growth in nominal mean equivalised disposable income for the respective household group. For more information on these terms, please refer to the Glossary in Section 7.
What income measures are presented in this bulletin?
Changes in prices and costs for household groups are presented in this bulletin alongside measures of mean equivalised disposable income, as produced within the Average household income1 publication.
The interpretation of these results should be treated with caution, as there are elements within the two measures that mean they are not coherent. For example, the HCIs include changes in the cost of Council Tax, while the disposable income measure provided in this bulletin deducts direct taxes (including Council Tax). This means that any changes in the cost of Council Tax will be counted in both measures. The measurement of real income in the UK: options for a coherent approach provides details of how measures of income and measures of changing prices and costs should be produced so that they are coherent.
Mean equivalised disposable household income is presented for each financial year between financial year ending (FYE) 2006 and FYE 2018. The annual figures presented are nominal, meaning that they do not make adjustments for changes in prices and costs. When comparing the HCIs with income, the indices have been re-referenced to the FYE 2006, and an annual average of each index value is used. It should be remembered when making income comparisons that income and costs growth may not give the whole picture. How well off a household group is will depend on the levels of average income and costs in the base period FYE 2006.
Quality and methodology information
For more information on the quality and methodology used to calculate these indices, please see the “Quality and methodology” section at the end of this bulletin. We welcome feedback on these statistics by email to cpi@ons.gov.uk.
Related publications
We have also produced CPIH-consistent inflation rate estimates for UK household groups. The CPIH is our most comprehensive measure of consumer price inflation. It measures the change in the prices of the goods and services consumed by households. However, because the consumption baskets of specific households differ and because prices do not all change at the same rate, the price experience of different groups of households may differ from the average figure for all households. Producing CPIH-consistent inflation rates for different household groups therefore provides an insight into how these price changes can vary between different groups, within an established framework based on economic principles.
Notes for: Things you need to know about this release
- Formerly known as the “Household disposable income and inequality” publication.
3. Summary of results
Table 1 presents an overview of annual growth rates for each of the subgroups we have considered. The results are broadly in line with the first Household Cost Indices (HCIs) preliminary estimates, with the most notable results being for retired and non-retired households who, over the period from 2006 to 2018, have average 12-month growth rates of 2.7% and 2.3% respectively.
This year we have additionally included a tenure-type subgroup. Here we see similar differences between groups, with the average 12-month growth for subsidised renters at 2.7%, and owner-occupiers at 2.3%, with renters falling in the middle at 2.5%.
| Group | 12-month growth rate (%) | ||||
|---|---|---|---|---|---|
| Decile of | 1 | 2 | 9 | 10 | All |
| Disposable income | 2.7 | 2.6 | 2.2 | 2.3 | 2.4 |
| Retired households | 2.7 | ||||
| Non-retired households | 2.3 | ||||
| Households with children | 2.2 | ||||
| Households without children | 2.5 | ||||
| Subsidised rented households | 2.7 | ||||
| Rented households | 2.5 | ||||
| Owner occupied households | 2.3 | ||||
Download this table Table 1: Average HCIs 12-month growth rates for selected household groups, UK, 2006 to 2018
.xls .csvIn the following sections we present more detailed results for each of the subgroups considered. The only differences between the indices presented in this analysis result from differences in the share of expenditure attributed to each category of item (under the assumption that each household group experiences the same price changes).
Back to table of contents4. Retired and non-retired households’ experience of changing prices and costs
How have prices and costs changed for retired and non-retired households?
Figure 1 presents the average expenditure share on each category of spending as a proportion of total household spending, for retired and non-retired household groups, in parts per thousand.
Figure 1: Housing has the largest share of expenditure for both retired and non-retired households
Household Costs Indices, average expenditure share, UK, 2005 to 2018
Source: Office for National Statistics - Household Costs Indices
Notes:
Expenditure shares may not sum to 1,000 due to rounding.
Weights for each category of spending are averaged across the period of 2005 to 2018.
Download this chart Figure 1: Housing has the largest share of expenditure for both retired and non-retired households
Image .csv .xlsBroadly, retired and non-retired households spend similar proportions of their expenditure on the same categories of spending. For example, both retired and non-retired households spend the largest proportion of their expenditure on housing and housing-related services (239 and 231 parts per thousand respectively), and a very small proportion of expenditure on education (1 and 8 parts per thousand respectively).
However, there are categories of spending where the expenditure shares differ substantially for the two groups. To explore this further, Figure 2 presents the percentage difference in average expenditure shares (for 2005 to 2018) for retired households relative to non-retired households for the 12 categories of spending.
Figure 2: Retired households spend proportionally more on health
Household Costs Indices, retired and non-retired households, UK, 2005 to 2018
Source: Office for National Statistics - Household Costs Indices
Notes:
- Percentages are quoted in terms of the relative size of expenditure by retired households versus non-retired households. This is to say that positive 50% represents retired households having a category expenditure share one and a half times greater than that of non-retired households, while negative 50% represents retired households having an expenditure share half the size of non-retired households.
Download this chart Figure 2: Retired households spend proportionally more on health
Image .csv .xlsOn average, retired households have spent a larger proportion of their total expenditure on health than non-retired households between 2005 and 2018. Non-retired households have spent a larger proportion of their total expenditure on education than retired households over the same period.
Both household groups spent a similar proportion of their expenditure on housing and housing-related services, and recreation and culture. However, classifying these categories of spending in this way obscures some of the underlying trends. For example, when looking at the class level categories, the expenditure share on canteens, education and interest on credit card debt for non-retired households is nearly double that of retired households. It is also worth noting that the proportion of spending on owner occupiers’ housing costs (OOH) for retired households relative to non-retired households has decreased from negative 10.4% in the previous release, to negative 46.6% for this publication. This is due to removing Council Tax from OOH, which has reduced OOH spending for retired households.
Conversely, retired households have an expenditure share more than double non-retired households for categories including: domestic services and household services (such as cleaners and gardeners), newspapers and periodicals, liquid fuels, and medical services and equipment.
Table 2 shows the 12-month growth rates experienced by retired and non-retired households between 2006 and 2018 compared with an all-households index using the same methodology. The final row of the table shows the average 12-month growth rate for each group over the same period. On average over this period, retired households experienced slightly faster growth than non-retired households (0.4 percentage points); however, looking at the individual years, the trend is less clear.
There are three distinct years where the trend is reversed, and non-retired households experience stronger growth. These are 2010, 2015 and 2016. It is also worth noting that the gap in average growth between retired and non-retired households in 2009 has increased from the previous release, from 1.3 percentage points to 2.3 percentage points. This is driven by the change in OOH discussed in Section 2.
| Year | Non-retired | Retired | All-households |
|---|---|---|---|
| 2006 | 2.8 | 3.7 | 3.0 |
| 2007 | 3.4 | 3.6 | 3.4 |
| 2008 | 3.5 | 5.0 | 3.9 |
| 2009 | 0.0 | 2.3 | 0.6 |
| 2010 | 3.4 | 3.2 | 3.3 |
| 2011 | 4.7 | 4.9 | 4.8 |
| 2012 | 3.0 | 3.1 | 3.0 |
| 2013 | 2.3 | 2.6 | 2.4 |
| 2014 | 1.3 | 1.5 | 1.4 |
| 2015 | -0.1 | -0.3 | -0.2 |
| 2016 | 0.7 | 0.6 | 0.7 |
| 2017 | 2.5 | 2.7 | 2.6 |
| 2018 | 2.5 | 2.8 | 2.6 |
| Compound average | 2.3 | 2.7 | 2.4 |
Download this table Table 2: HCIs 12-month growth rates for retired and non-retired household groups, alongside an all-households index, UK, 2006 to 2018
.xls .csvThe 12-month growth rate by month (Figure 3) can provide more clarity on this trend. Between 2005 and 2009, retired households were typically experiencing stronger growth than non-retired households. For the period between 2010 and 2017, the rates mostly converged. Since 2017 we have started to see a small divergence, although this is no greater than in earlier periods; for example, between 2012 and 2014.
Figure 3: Retired households experienced stronger growth prior to 2010
Household Costs Indices, retired and non-retired households, 12-month growth, UK, January 2006 to December 2018
Source: Office for National Statistics - Household Costs Indices
Download this chart Figure 3: Retired households experienced stronger growth prior to 2010
Image .csv .xlsFigures 4 and 5 present the contributions to the 12-month growth rates for retired and non-retired households respectively, which provide useful insight into the main drivers of these trends over time. The two series are driven by similar components: food and drink, housing, and housing-related services. However, the differences in the magnitude with which these components affect the 12-month growth rates for each household group explain the divergence in growth between these groups (Figure 6).
Figure 4: Food and drink made a large contribution to retired households growth
Household Costs Indices, retired households, contributions to 12-month growth, UK, January 2006 to December 2018
Source: Office for National Statistics - Household Costs Indices
Download this chart Figure 4: Food and drink made a large contribution to retired households growth
Image .csv .xls
Figure 5: OOH made a large contribution to non-retired households growth
Household Costs Indices, non-retired households, contributions to 12-month growth, UK, January 2006 to December 2018
Source: Office for National Statistics - Household Costs Indices
Download this chart Figure 5: OOH made a large contribution to non-retired households growth
Image .csv .xls
Figure 6: OOH led to higher growth for non-retired households in 2008 and higher growth for retired households in 2009
Household Costs Indices, retired and non-retired households, contributions to difference in 12-month growth, UK, January 2006 to December 2018
Source: Office for National Statistics - Household Costs Indices
Notes:
Stacked bars reflect the percentage point contributions of each of the 87 class-level items to the 12-month growth rate, or the difference in 12-month growth rates. The contribution of each of the 87 class-level items is estimated separately, before being aggregated to seven distinct categories.
A reduction in the contribution of series to the annual rate of change need not imply falling prices, but could also reflect a lower rate of increase than the previous year.
“Food and drink” comprises food, non-alcoholic and alcoholic beverages and tobacco. “Housing (exc. OOH)” comprises actual rents, Council Tax, and products and services for the repair of dwellings. Owner occupiers’ housing costs (payments) is a separate category. “Elect., gas and fuel” comprises electricity, gas and other household fuels as well as fuels and lubricants for motor vehicles. “Transport and package holidays” includes passenger transport by road, rail, air and sea, as well as package holidays. “Education” reflects the division-level contribution. The “other” category reflects the combined contributions of the remaining class-level items, bringing the sum of contributions to the inflation rate.
Contributions may not sum due to rounding.
Download this chart Figure 6: OOH led to higher growth for non-retired households in 2008 and higher growth for retired households in 2009
Image .csv .xlsThe two upward spikes observed in Figure 6 prior to October 2009 indicate that retired households experienced stronger growth in those periods than non-retired households. The difference was driven largely by “food and drink”, “electricity, gas and other fuels”, and “OOH (payments)”. The latter occurs because we would expect a greater proportion of non-retired households to be paying a mortgage. For many retired households their mortgage will be paid off. Therefore, when interest rates were higher, towards the end of 2007, non-retired households’ mortgage interest payments pushed their annual growth higher then retired households.
Conversely, when interest rates fell in 2008 and 2009 the lower mortgage interest payments drove down non-retired households’ growth rates. The prices for “food and drink” and “electricity, gas and other fuels” were rising during these time periods, and as retired households are observed to spend a larger proportion of their expenditure on these categories of spending, they experience faster growth during these periods.
Since 2012, the contributions from food and drink, and electricity, gas and other fuels that led to retired households experiencing stronger growth have been offset by components such as education, transport and housing. Growth in OOH has also been quite flat over this period. Between 2014 and 2016 food and drink prices were falling, which contributed to non-retired households experiencing marginally faster growth. Over 2017 and 2018 this has reversed, with increasing food and drink prices contributing to slightly faster growth for retired households.
How does nominal disposable income compare with changes in prices and costs for retired and non-retired households?
The cumulative income growth1 is compared with the cumulative Household Cost Indices (HCIs) growth in Figures 7 and 8 for non-retired and retired households respectively.
Figure 7: Income and costs for non-retired households have increased broadly in line over the period
Mean equivalised household disposable income (nominal) and Household Costs Indices cumulative growth, UK, financial years ending 2006 to 2018
Source: Office for National Statistics - Household Costs Indices
Download this chart Figure 7: Income and costs for non-retired households have increased broadly in line over the period
Image .csv .xls
Figure 8: Retired households' income has increased faster than costs over the period
Mean equivalised household disposable income (nominal) and Household Costs Indices cumulative growth, UK, financial years ending 2006 to 2018
Source: Office for National Statistics - Household Costs Indices
Download this chart Figure 8: Retired households' income has increased faster than costs over the period
Image .csv .xlsBetween financial year ending (FYE) 2006 and (FYE) 2018, non-retired households have experienced similar changes in their income and their household costs (as measured by the HCIs). Household income for non-retired households has increased by 36% over this period, while household costs for this group have increased by 31%.
While household costs for retired households have increased at a faster rate than non-retired households, their income has also increased considerably more than non-retired households and considerably more than their household costs. Household income for retired households increased by 60% between FYE 2006 and FYE 2018; however, household costs for retired households only increased by 38% over this same period. In particular, over the latter period, FYE 2018 household costs and income have drifted even further apart. ONS research suggests that private pensions are the main reason for the rising disposable income of retired households up to the FYE 2016.
Notes for: Retired and non-retired households’ experience of changing prices and costs
- Details of the income measure used within this publication are provided in the Things you need to know about this release section of this bulletin, under the heading “What income measures are presented in this article?”.
5. Low-income and high-income households’ experience of changing prices and costs
How have prices and costs changed for households with different levels of income?
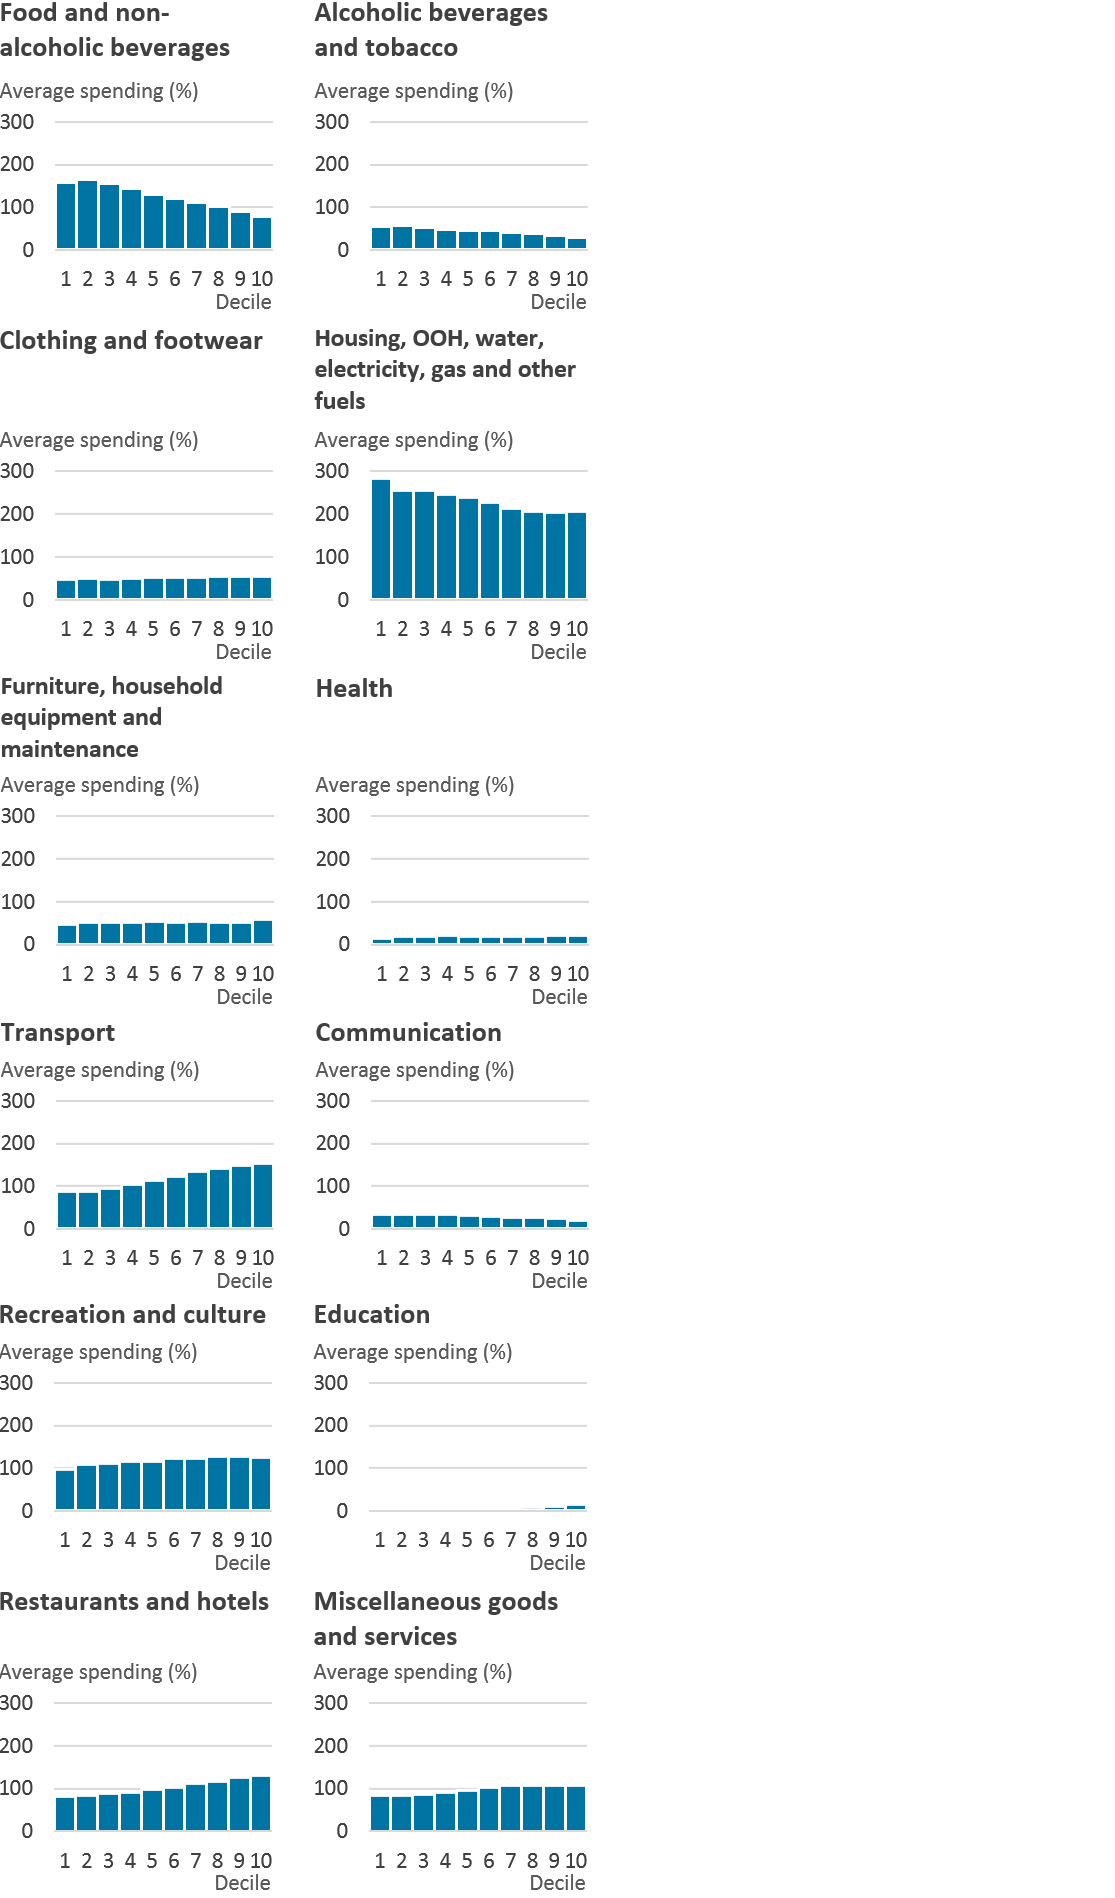
As well as dividing households by retirement status, the population of UK households can also be divided into income deciles: 10 equally sized groups of households ranked by their equivalised disposable income (as described in the Glossary section of this bulletin). Figure 9 presents the average household expenditure share on each category (division) as a proportion of average expenditure on all items by each decile.
Figure 9: Average proportional expenditure on housing decreases with income
Household Costs Indices, low and high equivalised income deciles, UK, 2005 to 2018
Source: Office for National Statistics - Household Costs Indices
Notes:
- Equivalised disposable income deciles (1 equals lowest-income households, 10 equals highest-income households).
- Expenditure shares may not sum to 1,000 due to rounding.
- Weights for each category of spending are averaged across the period of 2005 to 2018 (only the weights for January are included from 2017).
Download this image Figure 9: Average proportional expenditure on housing decreases with income
.png (86.9 kB) .xlsx (78.3 kB)
Over the period 2005 to 2018, average expenditure shares on essential items (such as food, housing and housing-related services) declined smoothly between the lowest- and highest-income deciles. Conversely, average expenditure shares on restaurants, hotels, education and transport gradually increased between the lowest- and highest-income deciles over this same period. In the previous release of the Household Cost Indices (HCIs), education displayed an irregular trend across income deciles, however, following methodological changes in the treatment of education for this release (see Annex A, and the Household Cost Indices: methodology article), a more consistent increasing trend is observed with increasing income.
As the lowest (1) and highest (10) income deciles are expected to share the same unusual composition as described in CPIH-consistent inflation rate estimates for UK household groups, they may display unusual spending patterns that could obscure the underlying trends. As such, for the remainder of this bulletin the second and ninth deciles are chosen to be representative of low-income households and high-income households respectively.
The difference in average weight between income deciles 2 and 9 for each category of spending are provided in Figure 10.
Figure 10: Low-income households spend proportionally more on food and drink
Household Costs Indices, low and high equivalised income deciles, UK, 2005 to 2018
Source: Office for National Statistics - Household Costs Indices
Notes:
- Percentages are quoted in terms of the relative size of expenditure by low-income households versus high-income households. This is to say that positive 50% represents low-income households having a category expenditure share one and a half times greater than that of high-income households, while negative 50% represents low-income households having an expenditure share half the size of high-income households.
Download this chart Figure 10: Low-income households spend proportionally more on food and drink
Image .csv .xlsPresenting the weights at this aggregate level obscures some of the underlying trends. For example, within the transport division low-income households (decile 2) spent a much greater proportion of their expenditure on passenger transport by road (including coach, bus and taxi fares), whereas high-income households (decile 9) spent a much greater proportion of their expenditure on passenger transport by railway and the purchase of vehicles (including new and second-hand cars, motorbikes and bicycles). Outside of the transport category, high-income (decile 9) households also spent a much greater proportion on health insurance, education, and interest on debt than low-income households (decile 2).
The differences in the expenditure shares of households within each of the 10 income deciles drive differences in the growth rates experienced by these groups. Table 3 shows the average 12-month growth rate experienced by each equivalised income decile between 2006 and 2018 compared with an all-households index that uses the same underlying methodology.
It can be observed that there is variation in the 12-month growth rate experienced by households with differing levels of equivalised income: the average 12-month growth rate over this period ranges from 2.7% for households in the lowest income decile to 2.3% for those in the highest income decile. On average, the all-households index has grown by 2.4% over this same period. This is equivalent to the average growth rate experienced by decile 6 within the income distribution.
| Year | Equivalised disposable income decile | All-households | |||||||||
|---|---|---|---|---|---|---|---|---|---|---|---|
| 1 | 2 | 3 | 4 | 5 | 6 | 7 | 8 | 9 | 10 | ||
| 2006 | 3.6 | 3.4 | 3.4 | 3.2 | 3.0 | 2.9 | 2.9 | 2.7 | 2.8 | 2.8 | 3.0 |
| 2007 | 3.5 | 3.4 | 3.4 | 3.3 | 3.4 | 3.5 | 3.4 | 3.4 | 3.6 | 3.7 | 3.4 |
| 2008 | 4.4 | 4.5 | 4.4 | 4.2 | 3.9 | 3.8 | 3.6 | 3.4 | 3.3 | 3.3 | 3.9 |
| 2009 | 1.5 | 1.8 | 1.7 | 1.5 | 1.0 | 0.5 | 0.1 | -0.2 | -0.7 | -1.0 | 0.6 |
| 2010 | 2.9 | 3.0 | 3.2 | 3.1 | 3.3 | 3.4 | 3.4 | 3.7 | 3.7 | 3.6 | 3.3 |
| 2011 | 5.0 | 4.8 | 4.9 | 4.8 | 4.7 | 4.7 | 4.7 | 4.8 | 4.6 | 4.7 | 4.8 |
| 2012 | 3.5 | 3.3 | 3.3 | 3.0 | 3.0 | 3.0 | 2.8 | 2.8 | 2.7 | 2.9 | 3.0 |
| 2013 | 2.7 | 2.7 | 2.6 | 2.4 | 2.5 | 2.3 | 2.2 | 2.1 | 2.1 | 2.0 | 2.4 |
| 2014 | 1.7 | 1.6 | 1.5 | 1.4 | 1.4 | 1.4 | 1.2 | 1.2 | 1.2 | 1.2 | 1.4 |
| 2015 | -0.1 | -0.1 | -0.2 | -0.2 | -0.2 | -0.2 | -0.3 | -0.2 | -0.2 | 0.0 | -0.2 |
| 2016 | 0.6 | 0.6 | 0.6 | 0.7 | 0.7 | 0.7 | 0.7 | 0.8 | 0.8 | 0.9 | 0.7 |
| 2017 | 2.6 | 2.5 | 2.6 | 2.6 | 2.6 | 2.5 | 2.6 | 2.5 | 2.5 | 2.7 | 2.6 |
| 2018 | 2.6 | 2.5 | 2.5 | 2.5 | 2.5 | 2.6 | 2.6 | 2.5 | 2.6 | 2.6 | 2.6 |
| Grand total | 2.7 | 2.6 | 2.6 | 2.5 | 2.5 | 2.4 | 2.3 | 2.3 | 2.2 | 2.3 | 2.4 |
Download this table Table 3: HCIs average 12-month growth rate (%) for equivalised disposable income deciles, alongside an all-households index, UK, 2006 to 2018
.xls .csvTo provide more clarity on this trend, Figure 11 presents the 12-month growth rate for selected income deciles along with the range of rates for all income deciles and an all-households index, between January 2006 and December 2018. The spread between 12-month growth rates is largest between 2008 and 2009. Since 2013, all income deciles have experienced similar rates of growth.
Figure 11: Low-income households experienced stronger growth prior to 2010
Household Costs Indices, 12-month growth, equivalised household disposable income deciles, UK, January 2006 to December 2018
Embed code
Cumulative changes in prices and costs over time can be seen in Figure 12. Since 2005, prices and costs of purchases by low-income households (decile 2) have risen by 41%, while prices and costs of purchases by high-income households (decile 9) have risen by 35%. The cumulative difference between deciles 2 and 9 is therefore 6 index points over the period since 2005.
Note that individual households will only have experienced these differences if they were consistently placed in the same income decile through time. As it is expected that households would move between income deciles throughout their life-cycle, the cumulative growth presented in Figure 12 is for the goods, services and other financial transactions that households in each decile purchase through time, rather than the experience of the households themselves.
Figure 12: Low-income households experienced higher cumulative growth
Household Costs Indices, equivalised household disposable income deciles, UK, January 2005 to December 2018
Embed code
The contributions to the 12-month growth rate (Figures 13 and 14) give an overview of the main drivers of the 12-month growth rates for income deciles 2 and 9. Low-income households (decile 2), on the whole, appeared to spend proportionally more on electricity, gas and fuels, and food and drink, whereas high-income households (decile 9) spent proportionally more on transport and package holidays, and owner-occupied housing. To understand what is driving the disparity between the two series, the differences between the contributions to 12-month growth for these two household groups are provided in Figure 15.
Figure 13: Food and drink contributes to 12-month growth for low-income households
Household Costs Indices, second equivalised household disposable income decile, UK, January 2006 to December 2018
Source: Office for National Statistics - Household Costs Indices
Download this chart Figure 13: Food and drink contributes to 12-month growth for low-income households
Image .csv .xls
Figure 14: Prior to 2010, OOH contributed to 12-month growth for high-income households
Household Costs Indices, ninth equivalised household disposable income decile, UK, January 2006 to December 2018
Source: Office for National Statistics - Household Costs Indices
Download this chart Figure 14: Prior to 2010, OOH contributed to 12-month growth for high-income households
Image .csv .xls
Figure 15: OOH led to higher growth for high-income households in 2008 and higher growth for low-income households in 2009
Household Costs Indices, low- and high-income households, contributions to difference in 12-month growth, UK, January 2006 to December 2018
Source: Office for National Statistics - Household Costs Indices
Notes:
- Stacked bars reflect the percentage point contributions of each of the 87 class-level items to the 12-month growth rate, or the difference in 12-month growth rates. The contribution of each of the 87 class-level items is estimated separately, before being aggregated to 7 distinct categories.
- A reduction in the contribution of series to the annual rate of change need not imply falling prices, but could also reflect a lower rate of increase than the previous year.
- “Food and drink” is composed of food, non-alcoholic and alcoholic beverages and tobacco. “Housing” is composed of actual rents, Council Tax and products and services for the repair of dwellings. “OOH (payments)” reflects the class level contribution from the payments approach to measuring owner occupiers’ housing costs (OOH). “Elect., gas and fuel” is composed of electricity, gas and other household fuels as well as fuels and lubricants for motor vehicles. “Transport and package holidays” includes passenger transport by road, rail, air and sea, as well as package holidays. “Education” reflects the division-level contribution. The “other” category reflects the combined contributions of the remaining class-level items, bringing the sum of contributions to the inflation rate.
- Contributions may not sum due to rounding.
Download this chart Figure 15: OOH led to higher growth for high-income households in 2008 and higher growth for low-income households in 2009
Image .csv .xlsFigure 15 suggests that it is food and drink, as well as electricity, gas and fuels, that act to increase the 12-month growth rate for the lower-income households (represented by income decile 2) compared with higher-income households (represented by income decile 9). However, when there are increases in the cost of owner occupation (as measured by the payments approach), high-income households experience a stronger 12-month growth rate. This is because households with higher income spend a larger proportion of their expenditure on owner occupiers’ housing costs (OOH), whereas lower-income households are more likely to be renting. When OOH are falling (for example, when mortgage interest payments declined in 2009), the downward pull on the growth of high-income households leads to low-income households experiencing stronger growth.
There are parallels here with the case of retired and non-retired households (Section 4). Low-income households and retired households are both less likely to be making mortgage repayments, therefore, will experience smaller effects from changes in OOH costs.
Since 2014, the contributions from all categories have been subdued suggesting the prices and costs for these items have remained relatively stable. The contributions to low-income households experiencing stronger growth are offset by contributions that would lead to high-income households experiencing stronger growth.
How does nominal disposable income compare with changes in prices and costs for households with different levels of income?
The cumulative income growth is compared with the cumulative HCIs growth in Figures 16, 17 and 18 for low-income households (represented by households within the second equivalised disposable income decile), mid-income households (represented by households within the fifth equivalised disposable income decile) and high-income households (represented by households within the ninth equivalised disposable income decile) respectively.
Figure 16: Income and costs for low-income households have increased broadly in line over the period
Mean equivalised household disposable income (nominal) and Household Costs Indices cumulative growth, UK, financial years ending 2006 to 2018
Source: Office for National Statistics - Household Costs Indices
Download this chart Figure 16: Income and costs for low-income households have increased broadly in line over the period
Image .csv .xls
Figure 17: Income begins to outpace costs for middle-income households after 2015
Mean equivalised household disposable income (nominal) and Household Costs Indices cumulative growth, UK, financial years ending 2006 to 2018
Source: Office for National Statistics - Household Costs Indices
Download this chart Figure 17: Income begins to outpace costs for middle-income households after 2015
Image .csv .xls
Figure 18: Income begins to outpace costs for high-income households after 2015
Mean equivalised household disposable income (nominal) and Household Costs Indices cumulative growth, UK, financial years ending 2006 to 2018
Source: Office for National Statistics - Household Costs Indices
Download this chart Figure 18: Income begins to outpace costs for high-income households after 2015
Image .csv .xlsFigures 16, 17 and 18 show that while there are divergences in changes in prices and costs for households within different equivalised disposable income deciles, these changes are typically matched with similar changes in income.
Since the last publication of these figures in 2017, the increase of prices and costs of purchases by high-income households has continued to track below that of low-income households (30% increase for high-income households since 2005 compared with a 37% increase for low-income households). However, low-income households have experienced slightly stronger income growth since 2005, at 43%, compared with 39% for high-income households.
The most recent year’s data available indicate that after a short period of divergence for the low-income group, the increases in income and costs appear to be coming into closer alignment. This does not appear to be the case for the middle- or high-income groups, with incomes continuing to keep ahead of costs.
Back to table of contents6. Experience of changing prices and costs for households with and without children
How have prices and costs changed for households with and without children?
Another interesting way to group households within the population is by comparing changing prices and costs for households with children with households who do not have children. Whether or not there are children within a household can influence the goods and services that the household purchases. Figure 19 presents the average expenditure shares of households with and without children by category of spending over the period 2005 to 2018.
Figure 19: Housing has the largest share of expenditure for households both with and without children
Household Costs Indices, Average expenditure share, UK, 2005 to 2018
Source: Office for National Statistics - Household Costs Indices
Download this chart Figure 19: Housing has the largest share of expenditure for households both with and without children
Image .csv .xlsThe patterns of household spending between households with and without children appear relatively similar. Figure 20 provides the percentage difference between average expenditure shares of households with children and households without children.
Figure 20: Households without children on average spend proportionally more on education
Household Costs Indices, households with and without children, UK, 2005 to 2018
Source: Office for National Statistics - Household Costs Indices
Notes:
- Percentages are quoted in terms of the relative size of expenditure by households without children versus households with children. This is to say that positive 50% represents households without children having a category expenditure share one and a half times greater than that of households with children, while negative 50% represents households without children having an expenditure share half the size of households with children.
Download this chart Figure 20: Households without children on average spend proportionally more on education
Image .csv .xlsAs would be expected, households with children spent a greater proportion of their expenditure on education than households without children (comprising pre-school, primary and secondary education, and student loans). Households with children also had a greater expenditure share for miscellaneous goods and services, which includes nursery fees, than households without children.
Conversely, households without children spent a greater proportion of their expenditure on health. This could be explained through the assumption that a greater proportion of retired households make up this group and, as shown in Section 4, retired households spend a larger proportion of their expenditure on health than non-retired households. Differences in other categories of spending are minor, and investigations into class-level categories provide little more insight than explorations of the data at this aggregate level.
The differences in the expenditure shares of households with and without children drive differences in the growth rates experienced by these groups. Table 4 shows the average 12-month growth rate experienced by these household groups between 2006 and 2018, compared with an all-households index that uses the same underlying methodology. The final row of the table shows the compound average 12-month growth rate for each group over the same period.
On average over this period, households without children have experienced faster growth than households with children (0.3 percentage points). This trend is consistent across all years except 2012 and 2016, where the two groups experienced the same level of growth.
| % | |||
|---|---|---|---|
| Year | With children | Without children | All-households |
| 2006 | 2.6 | 3.2 | 3.0 |
| 2007 | 3.3 | 3.5 | 3.4 |
| 2008 | 3.3 | 4.1 | 3.9 |
| 2009 | -0.3 | 1.0 | 0.6 |
| 2010 | 3.3 | 3.4 | 3.3 |
| 2011 | 4.6 | 4.9 | 4.8 |
| 2012 | 3.0 | 3.0 | 3.0 |
| 2013 | 2.2 | 2.4 | 2.4 |
| 2014 | 1.2 | 1.4 | 1.4 |
| 2015 | -0.2 | -0.1 | -0.2 |
| 2016 | 0.7 | 0.7 | 0.7 |
| 2017 | 2.5 | 2.6 | 2.6 |
| 2018 | 2.4 | 2.6 | 2.6 |
| Compound average | 2.2 | 2.5 | 2.4 |
Download this table Table 4: HCIs 12-month growth rates for households with and without children compared with an all-households index, UK, 2006 to 2018
.xls .csvTo present this trend more clearly, Figure 21 shows the 12-month growth rates for households with and without children between January 2006 and December 2018, alongside an all-household index measured using the same methodology. The growth rate experienced by households without children is typically more in line with the all-households index, although there have been periods of convergence between 2010 and 2018.
Figure 21: Households without children experienced stronger growth prior to 2010
Household Costs Indices, 12-month growth, households with and without children, UK, January 2006 to December 2018
Source: Office for National Statistics - Household Costs Indices
Download this chart Figure 21: Households without children experienced stronger growth prior to 2010
Image .csv .xlsTo explore this further, Figure 22 explores the difference in contributions to the 12-month growth rate for households with and without children.
Figure 22: OOH led to marginally higher growth for households with children in 2008 and higher growth for households without children in 2009
Household Costs Indices, households with and without children, contributions to difference in 12-month growth, UK, January 2006 to December 2018
Source: Office for National Statistics - Household Costs Indices
Notes:
Stacked bars reflect the percentage point contributions of each of the 87 class-level items to the 12-month growth rate, or the difference in 12-month growth rates. The contribution of each of the 87 class-level items is estimated separately, before being aggregated to seven distinct categories.
A reduction in the contribution of series to the annual rate of change need not imply falling prices, but could also reflect a lower rate of increase than the previous year.
“Food and drink” comprises food, non-alcoholic and alcoholic beverages and tobacco. “Housing (exc. OOH)” comprises actual rents, Council Tax, and products and services for the repair of dwellings. Owner occupiers’ housing costs (payments) is a separate category. “Elect., gas and fuel” comprises electricity, gas and other household fuels as well as fuels and lubricants for motor vehicles. “Transport and package holidays” includes passenger transport by road, rail, air and sea, as well as package holidays. “Education” reflects the division-level contribution. The “other” category reflects the combined contributions of the remaining class-level items, bringing the sum of contributions to the inflation rate.
Contributions may not sum due to rounding.
Download this chart Figure 22: OOH led to marginally higher growth for households with children in 2008 and higher growth for households without children in 2009
Image .csv .xlsCategories of spending that have a larger weight for households without children (such as food and drink, housing and electricity, gas and fuel) typically have greater price movements and are a large weight, therefore, they lead to households without children experiencing stronger growth between 2006 and 2013. Households with children have a reasonably large weight for owner occupiers’ housing costs (OOH (payments)) compared with households without children. Therefore, decreasing costs in this category in 2009 further contributes to households without children experiencing stronger growth.
Households without children experiencing stronger growth is partially offset by changes in the cost of education. As households with children spend a greater proportion of their expenditure on this category, any price changes will have a greater influence on their 12-month growth rate1.
How does nominal disposable income compare with changes in prices and costs for households with and without children?
The cumulative income growth2 is compared with the cumulative Household Cost Indices (HCIs) growth in Figures 23 and 24 for households without children and households with children respectively.
Figure 23: Income and costs for households without children have increased broadly in line over the period
Mean equivalised household disposable income (nominal) and Household Costs Indices cumulative growth, UK, financial years ending 2006 to 2018
Source: Office for National Statistics - Household Costs Indices
Download this chart Figure 23: Income and costs for households without children have increased broadly in line over the period
Image .csv .xls
Figure 24: Income and costs for households with children have increased broadly in line over the period
Mean equivalised household disposable income (nominal) and Household Costs Indices cumulative growth, UK, financial years ending 2006 to 2018
Source: Office for National Statistics - Household Costs Indices
Download this chart Figure 24: Income and costs for households with children have increased broadly in line over the period
Image .csv .xlsThe mean equivalised disposable income of households with and without children grew at a remarkably similar rate until 2016. This period was followed by a sharp rise for households without children in financial year ending (FYE) 2017, and a similar sharp rise for households with children in FYE 2018. The pattern of cost increases for the two groups have similar shapes with a slightly faster increase over the period for households without children.
Over the period as a whole, there has been little sustained divergence between income and costs for either group. It remains to be seen whether the current position of income growth being ahead of cost increases becomes an enduring trend.
Notes for: Experience of changing prices and costs for households with and without children
The student loans repayment index is presented in Annex A.
Details of the income measure used within this publication are provided in the “Things you need to know about this release” section, under the heading “What income measures are presented in this bulletin?”.
7. Experience of changing prices and costs for households of varying tenure types
How have prices and costs changed for subsidised rented, rented and owner-occupied households?
Housing costs are the largest expenditure category in the Household Cost Indices (HCIs). Therefore, the indices can be sensitive to changes in this kind of outgoing. Different tenure types (subsidised rent, rent from a private landlord or owner-occupied – defined to be consistent with the Consumer Prices Index including owner occupiers' housing costs (CPIH) subgroups publication) are exposed to different economic drivers of their housing costs and therefore might be expected to show differences in their HCIs over time.
Figure 25 shows the average expenditure shares by tenure type between 2005 and 2018, with housing costs clearly taking up a much larger share of expenditure for renters, and private renters in particular.
Figure 25: On average, subsidised and private renters spend proportionally more on housing
Household Costs Indices, subsidised renters, renters and owner occupiers, UK, 2005 to 2018
Source: Office for National Statistics - Household Costs Indices
Notes:
Expenditure shares may not sum to 1,000 due to rounding.
Weights for each category of spending are averaged across the period of 2005 to 2018 (only the weights for January are included from 2017).
Download this chart Figure 25: On average, subsidised and private renters spend proportionally more on housing
Image .csv .xlsAs might be expected, differences in growth rates for these groups are driven substantially by differences in housing costs. Table 5 shows the average 12-month growth rate experienced by these household groups between 2006 and 2018 (the last complete year of data), compared with an all-households index that uses the same underlying methodology. The final row of the table shows the compound average 12-month growth rate for each group over the same period.
On average, between 2012 and 2016, owner-occupied households have experienced lower annual growth rates than either type of rented household. In other periods, privately rented households tended to experience lower annual growth.
| % | ||||
|---|---|---|---|---|
| Year | Social | Private | Owner Occupied | All-households |
| 2006 | 3.2 | 2.8 | 3.0 | 3.0 |
| 2007 | 3.0 | 2.8 | 3.7 | 3.4 |
| 2008 | 4.3 | 3.7 | 3.8 | 3.9 |
| 2009 | 2.7 | 2.1 | -0.1 | 0.6 |
| 2010 | 2.8 | 2.7 | 3.6 | 3.3 |
| 2011 | 4.8 | 4.4 | 4.8 | 4.8 |
| 2012 | 3.5 | 3.3 | 2.8 | 3.0 |
| 2013 | 2.9 | 2.5 | 2.2 | 2.4 |
| 2014 | 1.8 | 1.7 | 1.2 | 1.4 |
| 2015 | 0.2 | 0.7 | -0.5 | -0.2 |
| 2016 | 0.7 | 1.1 | 0.6 | 0.7 |
| 2017 | 2.5 | 2.3 | 2.7 | 2.6 |
| 2018 | 2.5 | 2.0 | 2.7 | 2.6 |
| Compound average | 2.7 | 2.5 | 2.3 | 2.4 |
Download this table Table 5: HCIs 12-month growth rates for households separated by tenure type compared with an all-households index, UK, 2006 to 2018
.xls .csvFigure 26 illustrates how the growth rates have developed over time. Owner-occupied households experienced a sharp drop in costs relative to other tenure types in 2009. This is likely to be linked to low interest rates around this time. There is a less pronounced but more sustained period of lower growth rates between 2012 and 2017. They are also the only group to have experienced negative cost growth at any point.
Since 2015, privately rented households have seen more consistent growth rates than either socially rented or owner-occupied households, and for financial year ending 2018, have had the lowest annual growth rate, the first time this has happened since 2011.
Figure 26: Owner-occupiers experienced negative 12-month growth in 2009 and 2015
Household Costs Indices, subsidised renters, renters, and owner occupiers, UK, January 2006 to December 2018
Source: Office for National Statistics - Household Costs Indices
Download this chart Figure 26: Owner-occupiers experienced negative 12-month growth in 2009 and 2015
Image .csv .xlsThe role of housing costs in explaining the differences in HCIs for the three tenure types can be explained by examining the contributions to the index, shown in Figures 27, 28 and 29.
Figure 27: Food and drink tends to contribute most to growth for subsidised renters
Household Costs Indices, contributions to 12-month growth, UK, January 2006 to December 2018
Source: Office for National Statistics - Household Costs Indices
Download this chart Figure 27: Food and drink tends to contribute most to growth for subsidised renters
Image .csv .xls
Figure 28: Housing contributed consistently to the growth for renters
Household Costs Indices, contributions to 12-month growth, UK, January 2006 to December 2018
Source: Office for National Statistics - Household Costs Indices
Download this chart Figure 28: Housing contributed consistently to the growth for renters
Image .csv .xls
Figure 29: OOH was the main contributor to negative growth for owner-occupiers in 2009
Household Costs Indices, contributions to 12-month growth, UK, January 2006 to December 2018
Source: Office for National Statistics - Household Costs Indices
Notes:
Stacked bars reflect the percentage point contributions to the difference in 12-month growth rates. The contribution of each of the 87 class-level items is estimated separately, before being aggregated to seven distinct categories.
A reduction in the contribution of series to the annual rate of change need not imply falling prices, but could also reflect a lower rate of increase than the previous year.
“Food and drink” comprises food, non-alcoholic and alcoholic beverages and tobacco. “Housing (exc. OOH)” comprises actual rents, Council Tax, and products and services for the repair of dwellings. Owner occupiers’ housing costs (payments) is a separate category. “Elect., gas and fuel” comprises electricity, gas and other household fuels as well as fuels and lubricants for motor vehicles. “Transport and package holidays” includes passenger transport by road, rail, air and sea, as well as package holidays. “Education” reflects the division-level contribution. The “other” category reflects the combined contributions of the remaining class-level items, bringing the sum of contributions to the inflation rate.
Contributions may not sum due to rounding.
Download this chart Figure 29: OOH was the main contributor to negative growth for owner-occupiers in 2009
Image .csv .xlsThe sharp drop in owner-occupied housing costs that led to a decline in the HCI for owner-occupied households in 2009 can be clearly seen in Figure 29. Where owner-occupied households also experienced a decline in their HCI during 2015, increasing housing costs for both categories of renter ensured that their household costs continued to increase (albeit more so for private renters).
How does nominal disposable income compare with changes in prices and costs for households of each tenure type?
The cumulative income growth1 is compared with the cumulative HCIs growth in Figures 30, 31 and 32 for households of each tenure type.
Figure 30: Income and costs for subsidised renters have increased broadly in line over the period
Mean equivalised household disposable income (nominal) and Household Costs Indices cumulative growth, UK, financial years ending 2006 to 2018
Source: Office for National Statistics - Household Costs Indices
Download this chart Figure 30: Income and costs for subsidised renters have increased broadly in line over the period
Image .csv .xls
Figure 31: Income has been rising faster than costs for renters since 2015
Mean equivalised household disposable income (nominal) and Household Costs Indices cumulative growth, UK, financial years ending 2006 to 2018
Source: Office for National Statistics - Household Costs Indices
Download this chart Figure 31: Income has been rising faster than costs for renters since 2015
Image .csv .xls
Figure 32: Income and costs for owner-occupiers have increased broadly in line over the period
Mean equivalised household disposable income (nominal) and Household Costs Indices cumulative growth, UK, financial years ending 2006 to 2018
Source: Office for National Statistics - Household Costs Indices
Download this chart Figure 32: Income and costs for owner-occupiers have increased broadly in line over the period
Image .csv .xlsPrivate renters have seen the strongest income growth between financial year ending (FYE) 2006 and FYE 2018: 46% compared with 42% for subsidised renters and 39% for owner-occupiers. While subsidised renters have seen the largest increases in their costs: 38% compared with 35% for private renters and 32% for owner-occupiers. The strong income gains for private renters and the low-cost growth for owner-occupiers means that social renters seem to have gained the least since FYE 2006.
Notes for: Experience of changing prices and costs for households of varying tenure types
- Details of the income measure used within this publication are provided in the “Things you need to know about this release” section, under the heading “What income measures are presented in this bulletin?”.
8. Glossary
Disposable income
Disposable income is that which is available for consumption and is equal to all income from wages and salaries, self-employment, private pensions and investments, plus cash benefits less direct taxes.
Disposable income deciles
Households are grouped into deciles (or tenths) based on their equivalised disposable income. The richest decile (decile 10) is the 10% of households with the highest equivalised disposable income. Similarly, the poorest decile (decile 1) is the 10% of households with the lowest equivalised disposable income.
Equivalised
Equivalisation is the process of accounting for the fact that households with many members are likely to need a higher income to achieve the same standard of living as households with fewer members.
Equivalisation considers the number of people living in the household and their ages, acknowledging that while a household with two people in it will need more money to sustain the same living standards as one with a single person, the two-person household is unlikely to need double the income. This analysis uses the modified-Organisation for Economic Co-operation and Development (OECD) equivalisation scale.
Households with children
Households with children are defined as any household with one or more household members who are under 18 years of age, in full-time education and have never been married.
Owner-occupier households
Owner-occupier households are defined as any household in which the residents own the property outright or are buying the property with a mortgage. This includes shared owners (who own part of the property; paying both rent and mortgage).
Renter households
Renter households are defined as any household that rents their property from a private sector landlord. It excludes households who live in their property rent-free.
Retired persons and households
A retired person is defined as anyone who describes themselves (in the Living Costs and Food Survey (LCF)) as “retired” or anyone over minimum National Insurance pension age describing themselves as “unoccupied” or “sick or injured but not intending to seek work”. A retired household is defined as one where the combined income of retired members amounts to at least half the total gross income of the household.
Subsidised renter households
Subsidised renter households are defined as any household that either rents their property from a council, a registered social landlord or live in their property rent-free.
Back to table of contents9. Quality and methodology
More information on the methodology used to calculate these indices can be found in the related Household Costs Indices: methodology article, and also in the forthcoming article, Household Costs Indices, second release: methodology, which will be published at a later late.
With regards to creating subgroup measures, the methods used in this bulletin are consistent with the methodology to calculate CPIH-consistent inflation rates for UK household groups. Where differences to this methodology arise, they are discussed within this section.
Owner occupiers’ housing costs (OOH)
As the Household Costs Indices (HCIs) use a different approach to measuring OOH, the aggregate expenditure on OOH (payments) is reconciled with households in the Living Costs and Food Survey (LCF) based on their expenditure on housing-related payments (such as mortgage interest payments, transaction costs and taxes). Council Tax is no longer included in the OOH measure as it is a cost faced by all households, regardless of whether they own their own home or not.
Interest costs on credit card debt
This measure is unique to the HCIs. The aggregate expenditure on interest costs on credit card debt is reconciled with households in the LCF based on their reported expenditure on credit card interest.
Student loan repayments
Whilst the cost of university education is not unique to the HCIs, the approach to measurement does differ from our other consumer price statistics. The HCIs capture the cost of repaying a student loan rather than the price of tuition fees directly. The aggregate expenditure on student loan repayments is reconciled with households in the LCF based on their reported expenditure on student loan repayments. For more information on the construction of the student loan repayments measure, please refer to Annex A. More detail will be provided in the forthcoming article, Household Costs Indices, second release: methodology, which will be published at a later date.
Weights
Price indices are constructed using price and expenditure data. These expenditure shares can be calculated using different methodological approaches; the main two are democratic and plutocratic weighting. An overview of these approaches and their associated concepts can be found in Section 7.2 of the Consumer Price Indices Technical Manual (PDF, 674.4KB). We have also produced a methodology article Investigating the impact of different weighting methods on CPIH that compares the two approaches, alongside additional approaches to weighting a price index.
For the purpose of this article, democratic weighting is used, for both the household group indices and the all-households index.
The HCIs use a different weight for insurance spending categories. Gross insurance expenditure is used, such that money redistributed to households for insurance claims is captured rather than netted out. The aggregate expenditure on insurance is reconciled with households in the LCF based on their reported expenditure on insurance.
Limitations
While the calculation of household group measures is straightforward analytically, a range of data constraints make their estimation challenging in practice. For instance, an analysis of household group specific rates would ideally use price indices and expenditure weights specific to each household group. This would reflect the fact that different households will purchase goods and services from different outlets and therefore face different prices.
However, data are not available on household-group specific price indices, and therefore this bulletin uses national price indices as an approximation. There are also a number of challenges that arise from the data sources that are available to calculate the expenditure shares. For more information, please see the methodology publication.
Back to table of contents10. Annex A: Student loan repayments methodology
In December 2017, the first preliminary estimates of the Household Cost Indices (HCIs) were published. The accompanying methodological article announced the development of a price index for student loan repayments as a further component to consider for inclusion in the HCIs.
The proposed method for this release uses a “threshold” model for the estimation of the price index for student loan repayments. The weight associated with the price index was derived by combining household-level data and aggregated data in a democratic weighting approach.
The “threshold” model estimates monthly student loan repayments from graduate salaries and the repayment threshold, taking into account that individuals pay 9% of their income over a given threshold. For the aim of the HCIs, the mean salary of full-time graduate employees (excluding bonuses) was used from the Office for National Statistics (ONS) Labour Force Survey (LFS). Using graduate salaries and income thresholds over the time period 2005 to 2018, the monthly repayments for the average graduate were estimated. The unchained price index was obtained as follows:
Where sJan is the mean salary in January of the calendar year, and ti is the threshold income for month i (which is constant throughout a financial year).
The price index for student loan repayments (shown in Figure 33 ) was an input for the higher level price index for education, which informed the computation of the HCIs. The index declines because the income threshold is increasing faster than mean graduate salaries. The large decrease in the index seen in 2005 is due to the repayment threshold increasing from £833.33 to £1,250.00, by far the largest threshold increase seen over the period.
Figure 33: The cost of student loan repayments has decreased steadily since 2005
Household Costs Indices, cumulative growth, student loan repayments, UK, January 2005 to December 2018
Source: Office for National Statistics - Household Costs Indices
Download this chart Figure 33: The cost of student loan repayments has decreased steadily since 2005
Image .csv .xlsAs for the weights, household-level expenditure data were drawn from the Living Costs and Food Survey (LCF), and total expenditure in the UK was provided by the Student Loan Company (SLC). The LCF data referred to households surveyed between Quarter 1 (Jan to Mar) 2003 and Quarter 4 (Oct to Dec) 2016. Total expenditure from the SLC consisted of mandatory repayments between 2005 and 2016. Total expenditure data were price uprated in line with standard Consumer Prices Index (CPI) practice. For more information, please refer to the Consumer Price Indices Technical Manual.
Nevertheless, there are limitations to the inclusion of student loan repayments. First, in its current version, student loan repayment does not distinguish between teaching fees loans and maintenance loans. This could lead to double counting. This is because maintenance loans are used to fund purchases of goods and services, so the expenditure will already have been counted once in the expenditure categories for those goods and services that have been purchased with the maintenance loan. The expenditure will then be counted again through including maintenance loan repayment expenditure. Work is ongoing to disaggregate maintenance and teaching fees loans as a development element for the next release.
A second limitation is that the present version of the HCIs does not incorporate voluntary repayments. Although these are minor compared with mandatory payments, a fraction of household expenditure is not considered at present, which will be addressed by future development.
Tuition fees paid upfront are also unaccounted for currently. This requires establishing the weight of the two components through time to add them accordingly into the HCIs. While the present release refers to student loan repayments only, an estimation method is being designed that will allow teaching fees paid upfront to be similarly accounted for in the next release.
Further information on the inclusion of student loan repayments in the HCIs is provided in the methodological article that will be published shortly after this release.
Back to table of contents