Table of contents
- Other migration statistics published on 24 and 25 August 2017
- Main points
- International migration over the last 10 years
- Statistician’s comment
- Things you need to know about this release
- Net migration to the UK falls to +246,000
- Why do people move to and from the UK?
- Links to related statistics
- What has changed in this publication?
- Upcoming changes to this bulletin
- Quality and methodology
1. Other migration statistics published on 24 and 25 August 2017
This publication is one of a suite of migration-related statistics and analysis, which together give a more comprehensive view on the impact of migration on the UK.
Population of the UK by country of birth and nationality: 2016, provides information on where non-UK born and non-British nationals live by local authority and single country of birth.
The Local Area Migration Indicators Suite (LAMIS) presents a suite of migration indicators at local authority level; this annual output has been updated with the latest available estimates and will be accompanied by an interactive chart, a map and a quiz providing an introduction to the LAMIS and data by local authority.
Office for National Statistics (ONS) is also releasing, as Experimental Statistics, a comprehensive update on the statistics on immigration for study and emigration after study. This report combines analysis of exit checks data, which indicate what actually happened to non-EU students when their visas have expired following their studies, with the results of a new survey of graduating higher education students on their intentions following study.
The Home Office’s second report on statistics being collected under the exit checks programme complements this and gives a further update on the Experimental Statistics produced from the exit checks programme.
The Home Office are also publishing their Immigration Statistics April to June 2017, which gives an overview of work on immigration control, entry clearance, asylum and enforcement, including the work of UK Border Force, Immigration Enforcement and UK Visas and Immigration. It includes the latest statistics on how many people come or plan to come to the UK based on admissions and visa data, including information on those coming for study, work and family reasons as well as just to visit. Other topics covered are extensions of stay, settlement, citizenship, asylum, resettlement, returns (both enforced removals and voluntary departures) and detention under immigration powers.
The Department for Work and Pensions (DWP) are updating their publications showing the numbers of adult overseas nationals registering for a National Insurance number in order to work or claim benefits or tax credits in the UK. In addition they will also be updating the numbers of adult overseas nationals claiming DWP income-related benefits, spending on those benefits and the numbers of adult overseas nationals affected by the measures introduced to restrict access to income-related benefits for EEA migrants, which should be looked at alongside Her Majesty’s Revenue and Customs’ (HMRC) statistics on the taxes paid, and HMRC-related benefits claimed, by EEA and EU citizens.
ONS is also publishing Births by parents' country of birth, England and Wales: 2016.
Tomorrow (25 August), ONS will also be publishing research papers looking at alternative ways of estimating the population by ethnic group, nationality and country of birth using the annual population survey and administrative data. A third paper compares both approaches.
Back to table of contents2. Main points
Net long-term international migration was estimated to be +246,000 in year ending (YE) March 2017, down 81,000 from +327,000 in YE March 2016; immigration was 588,000, down 50,000, and emigration was 342,000, up 31,000 (all statistically significant changes).
More than half of the change in net migration can be accounted for by a decrease in net migration of EU citizens (down 51,000); this was driven by an increase (33,000) in emigration for EU citizens (in particular EU8 emigration up 17,000 (both statistically significant)) and a 19,000 decrease in immigration (not statistically significant).
Of those who immigrated to work (275,000) in YE March 2017, the majority had a definite job (188,000) but fewer came to the UK looking for work (down 39,000 to 87,000 – a statistically significant decrease over the year); for emigration to work (182,000), people moving abroad for a definite job saw an increase of 21,000 to 122,000 (statistically significant).
Long-term immigration to study (139,000) for all nationalities saw a statistically significant decrease of 27,000 from YE March 2016, reflecting the decrease reported in YE September 2016; the majority were non-EU citizens (93,000 – down 20,000); however, the comparable number of visas issued over the same period to non-EU students for 12 months or more rose by 5% to 142,128.
In the YE June 2017, the total number of non-European Economic Area sponsored applications to study at universities in the UK rose by 5% to 170,929 (all visa lengths).
A total of 51,000 non-British citizens emigrated to return home to live in YE March 2017 (up from 34,000); these were mostly EU citizens (44,000, up 20,000 from YE March 16) half of whom were from EU8 countries (all statistically significant changes).
A total of 16,211 people were granted asylum, resettlement or an alternative form of protection in YE June 2017; this is a 7% increase from 15,108 in the previous year.
3. International migration over the last 10 years
Figure 1: Long-Term International Migration
UK, 2007 to 2017 (year ending March 2017)
Source: Office for National Statistics, Long-Term International Migration
Notes:
- Figures for YE 2016 and 2017 are provisional. In this chart provisional estimates are shown in a shaded area. Rolling year data are produced quarterly and are for year ending (YE) March (Quarter 1), YE June (Quarter 2), YE September (Quarter 3) and YE December (Quarter 4).
- Net migration estimates for the period 2001 to 2011 have been revised in light of the 2011 Census. Immigration and emigration estimates have not been revised and are therefore not consistent with the revised net migration estimates. The revised estimates are only available for the years ending June and December each year. Refer to the Guidance note for net international migration revisions.
- Users are encouraged to review the published tables for confidence intervals and an insight into the inherent uncertainty in these statistics.
Download this chart Figure 1: Long-Term International Migration
Image .csv .xlsThe Office for National Statistics (ONS) interactive timeline provides further historical trends from 1964 for long-term international migration to and from the UK by British citizens, EU citizens (further split by EU15, EU8 and EU2 citizens) and non-EU citizens, with the underlying data available for download.
The ONS International migration and the Home Office migration research and analysis pages provide links to further publications.
Back to table of contents4. Statistician’s comment
“Net migration in the year to March 2017 was +246,000, a decrease of 81,000 compared with the previous year, two-thirds of this was due to EU net migration and mainly EU8. The net migration change was driven by an increase in emigration, mainly for EU citizens and in particular EU8 citizens, and a decrease in immigration across all groups.
“International migration for work remains the most common reason for migration with people becoming increasingly more likely to move to the UK or overseas only with a definite job than to move looking for work.
“These results are similar to 2016 estimates (published in May 2017) and indicate that the EU referendum result may be influencing people’s decision to migrate into and out of the UK, particularly EU and EU8 citizens. It is too early to tell if this is an indication of a long-term trend.”
Nicola White, Head of International Migration Statistics, Office for National Statistics
Follow our statistician @PaulVickers_ONS
Back to table of contents5. Things you need to know about this release
The reporting period for the International Passenger Survey (IPS) data in this release is year ending (YE) March 2017 and therefore includes 9 months of data following the EU referendum. Entry clearance visa, National Insurance number (NINo) and labour market data are available to the end of June 2017. IPS data covering a full year after the referendum (YE June 2017) will be available in November 2017.
This bulletin has been streamlined following user feedback and focuses mainly on the main messages and latest data. If you have comments or suggestions on the format please let us know by emailing MigStatsUnit@ons.gov.uk
Office for National Statistics (ONS) migration statistics use the UN recommended definition of a long-term international migrant: “A person who moves to a country other than that of his or her usual residence for a period of at least a year (12 months), so that the country of destination effectively becomes his or her new country of usual residence.”
In 2012, a new question was introduced to the IPS to collect information on an emigrant's main reason for previously immigrating to the UK. This categorised emigrants by whether they had previously immigrated for work, study, to accompany or join, or other reasons. The Office for Statistics Regulation (OSR) carried out a review of The quality of the long-term student migration statistics, which was published on 27 July 2017. The main focus of their report was the “student migration gap” – the difference between the estimate of the number of migrants entering the UK for formal study (student immigration) and the estimate of the number of former students leaving the UK (former student emigration). OSR noted that the IPS emigration estimate of former students does not provide a complete and coherent picture of former student emigration, as these figures alone do not provide information on all the different outcomes for international students. Given this, a requirement from the OSR was to label the former student emigration estimate as Experimental Statistics. What’s happening with international student migration? provides the latest update on our work in this area.
To avoid potential confusion about the contribution that particular groups of migrants make to total net migration figures, the previously published “balance” figures by reason have been removed from Tables 2 and 3 in the accompanying datasets.
The Long-Term International Migration (LTIM) estimates methodology describes how data from the IPS and other sources are used to create LTIM estimates. Some estimates are only available based solely on IPS data. Differences between ONS, Home Office, Department for Work and Pensions (DWP) and other sources are described in Comparing sources of international migration statistics.
Full details of definitions and glossary terms can be found in the Migration statistics first time user guide, glossary and list of products.
Back to table of contents6. Net migration to the UK falls to +246,000
The Long-Term International Migration (LTIM) net migration estimate (the difference between immigration and emigration) for the year ending (YE) March 2017 was +246,000, compared with +327,000 in YE March 2016. This 81,000 difference was statistically significant and is the lowest recorded net migration estimate since YE March 2014 (Table 1 and Figure 1).
Table 1: Latest changes in international migration
| UK, year ending March 2016 and year ending March 2017 | Thousands | ||||||||
| YE Mar 2016 | 95% CI | YE Mar 2017 | 95% CI | Difference | |||||
| Net migration | +327 | +/-39 | +246 | +/-42 | - 81* | ||||
| Immigration | 638 | +/-33 | 588 | +/-35 | -50* | ||||
| Emigration | 311 | +/-21 | 342 | +/-23 | 31* | ||||
| Source: Office for National Staistics, Long-Term International Migration | |||||||||
| Notes: | |||||||||
| 1. The estimates given are the sum of the EU, non-EU AND British citizenship groupings. | |||||||||
| 2. 2016 and 2017 estimates are provisional. | |||||||||
| 3. Figures are rounded to the nearest thousand. Figures may not sum due to rounding. | |||||||||
| 4. CI is Confidence Interval. Further information on confidence intervals can be found in the Migration Statistics Quarterly Report Information for Users. | |||||||||
| 5. YE is year ending. | |||||||||
| 6. Statistically significant change at the 5% level is indicated by an asterisk. | |||||||||
Download this table Table 1: Latest changes in international migration
.xls (29.7 kB)In YE March 2017, the 50,000 decrease in immigration and the 31,000 increase in emigration combined to produce the net migration decrease of 81,000 compared with the previous year (all statistically significant as shown in Table 1).
The latest immigration estimate of 588,000 is the lowest recorded estimate since YE June 2014. The emigration estimate of 342,000 is the highest recorded estimate since YE September 2012. The highest recorded estimate for emigration (427,000) was in YE December 2008.
EU international migration accounts for more than half the net migration change
All main citizenship groups saw a decrease in net migration compared with YE March 2016 (Table 2). More than half of the fall in net migration is accounted for by a statistically significant decrease of 51,000 for EU citizens, for whom net migration has decreased to the lowest since YE December 2013.
Table 2: Latest changes in net migration by citizenship
| UK, year ending March 2016 and year ending March 2017 | Thousands | ||||
| YE Mar 2016 | 95% CI | YE Mar 2017 | 95% CI | Difference | |
| Total | +327 | +/-39 | +246 | +/-42 | -81* |
| British | -43 | +/-19 | -60 | +/-20 | -17 |
| EU | +178 | +/-28 | +127 | +/-29 | -51* |
| (of which) EU15 | +76 | +/-18 | +74 | +/-20 | -2 |
| (of which) EU8 | +39 | +/-14 | +7 | +/-14 | -32* |
| (of which) EU2 | +61 | +/-15 | +43 | +/-14 | -18 |
| Non-EU | +193 | +/-21 | +179 | +/-23 | -14 |
| (of which) Asia | +120 | +/-16 | +110 | +/-17 | -10 |
| (of which) Rest of World | +60 | +/-12 | +57 | +/-15 | -3 |
| Source: Office for National Statistics, Long-Term International Migration | |||||
| Notes: | |||||
| 1. EU other and Other Europe citizenship groupings are not included as separate groups in the table but are included under the EU and non-EU totals. | |||||
| 2. 2016 and 2017 estimates are provisional. | |||||
| 3. Figures are rounded to the nearest thousand. Figures may not sum due to rounding. | |||||
| 4. CI is Confidence Interval. Further information on confidence intervals can be found in the Migration Statistics Quarterly Report Information for Users. | |||||
| 5. YE is year ending. | |||||
| 6. Statistically significant change at the 5% level is indicated by an asterisk. | |||||
Download this table Table 2: Latest changes in net migration by citizenship
.xls (30.7 kB)Almost all of the change in EU net migration is accounted for by EU8 citizens, down 32,000 (statistically significant), and a decrease of 18,000 (not statistically significant) for EU2 citizens (from the previous year) to the lowest estimate since YE September 2014. EU15 citizens still make up the majority of the EU migrating population and their net migration has remained at a similar level over the last few years (Figure 2).
Figure 2: EU net migration to the UK by citizenship
UK, year ending June 2007 to year ending March 2017
Source: Office for National Statistics, Long-Term International Migration
Notes:
- Figures for 2016 and 2017 are provisional. In this chart provisional estimates are shown in a shaded area. Rolling year data are produced quarterly and are for year ending (YE) March (Quarter 1), YE June (Quarter 2), YE September (Quarter 3) and YE December (Quarter 4).
- This chart does not include data for citizens of Malta, Cyprus or Croatia.
Download this chart Figure 2: EU net migration to the UK by citizenship
Image .csv .xlsImmigration remains much higher than emigration accounting for the positive net migration over the last two decades. In the YE March 2017, there was a statistically significant decrease of 50,000 in the estimate for immigration compared with YE March 2016. There were no further statistically significant changes for any specific citizenship group but most citizenship groups saw a decrease in immigration (Table 3).
Table 3: Immigration and emigration to and from the UK by citizenship
| UK, year ending March 2016 and year ending March 2017 | Thousands | |||||||
| Immigration | Emigration | |||||||
| YE Mar 2016 | YE Mar 2017 | Difference | YE Mar 2016 | YE Mar 2017 | Difference | |||
| Total | 638 | 588 | -50* | 311 | 342 | 31* | ||
| British | 83 | 74 | -9 | 126 | 134 | 8 | ||
| EU | 267 | 248 | -19 | 89 | 122 | 33* | ||
| (of which) EU15 | 128 | 133 | 5 | 52 | 58 | 6 | ||
| (of which) EU8 | 68 | 52 | -16 | 29 | 46 | 17* | ||
| (of which) EU2 | 69 | 59 | -10 | 8 | 16 | 8 | ||
| Non-EU | 288 | 266 | -22 | 95 | 86 | -9 | ||
| (of which) Asia | 177 | 159 | -18 | 57 | 49 | -8 | ||
| (of which) Rest of World | 94 | 91 | -3 | 34 | 34 | 0 | ||
| Source: Office for National Statistics, Long-Term International Migration | ||||||||
| Notes | ||||||||
| 1. EU other and Other Europe citizenship groupings are not included as separate groups in the table but are included under the EU and non-EU totals. | ||||||||
| 2. 2016 and 2017 estimates are provisional. | ||||||||
| 3. Figures are rounded to the nearest thousand. Figures may not sum due to rounding. | ||||||||
| 4. Confidence intervals (CIs) can be found in the accompanying datasets and more information on CIs can be found in the Migration Statistics Quarterly Report Information for Users. | ||||||||
| 5. YE is year ending. | ||||||||
| 6. Statistically significant change at the 5% level is indicated by an asterisk. | ||||||||
Download this table Table 3: Immigration and emigration to and from the UK by citizenship
.xls (30.2 kB)The 19,000 decrease in immigration of EU citizens, although not statistically significant, when combined with the increase in emigration (up 33,000), produces the large net migration change for EU citizens. EU8 and EU2 immigration decreased by 16,000 and 10,000 respectively, while EU15 immigration increased by 5,000 compared with the previous year (Table 3).
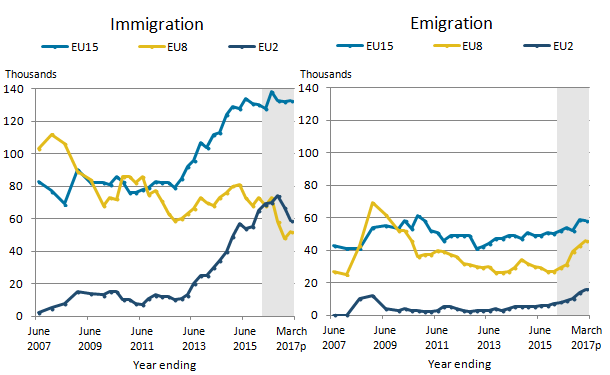
EU15 immigration numbers have been broadly flat following the steep rise in 2012 to 2014. The fall in EU8 immigration continues a decline in numbers seen since the 2008 recession, following the peak in the immediate period following these countries’ accession to the EU in 2004 (Figure 3).
Non-EU immigration decreased by 22,000 but again this change was not statistically significant. This change was mainly accounted for by citizens of Asia, down 18,000.
EU8 emigration in YE March 2017 increased by 17,000 to an estimated 46,000 (statistically significant) compared with YE March 2016. EU2 emigration doubled to 16,000 (not statistically significant) but it is too early to tell if this is a longer-term trend. These emigration increases are reflected in the net migration decreases for EU8 and EU2 citizens. A small increase in emigration by EU15 citizens was balanced by a similar increase in immigration for this group (Table 3).
Emigration from the UK for British citizens saw a small increase and for non-EU citizens saw a small decrease (both not statistically significant) compared with the previous year.
Figure 3: EU immigration to and emigration from the UK by citizenship
UK, year ending June 2007 to year ending March 2017
Source: Office for National Statistics, Long-Term International Migration
Notes:
- Figures for 2016 and 2017 are provisional. In this chart provisional estimates are shown in a shaded area. Rolling year data are produced quarterly and are for year ending (YE) March (Quarter 1), YE June (Quarter 2), YE September (Quarter 3) and YE December (Quarter 4).
- This chart does not include data for citizens of Malta, Cyprus or Croatia.
Download this image Figure 3: EU immigration to and emigration from the UK by citizenship
.png (25.7 kB) .xls (34.3 kB)
More detailed Long-Term International Migration (LTIM) estimates of immigration, emigration and net migration by citizenship over time along with confidence intervals around all the estimates can be found in Table 1, Chart 1TS and Chart 1 Net in the accompanying datasets.
Back to table of contents7. Why do people move to and from the UK?
Figure 4: International Passenger Survey estimates of immigration to the UK by citizenship and reason
UK, year ending March 2017
Source: Office for National Statistics, International Passenger Survey
Notes:
- Figures for 2017 are provisional.
- Accompany or join means accompanying or joining others and includes those migrating to “accompany or join” a partner or immediate family; it includes those migrating to get married and those who, on prompting, gave no further reason of their own for migrating.
- Other reasons includes any other stated reason, for example, working holidaymakers, those visiting friends and family, anyone taking a long holiday as well as migrants who are travelling for religious reasons.
- No reason stated includes non-responses and the response "Emigrating or Immigrating".
Download this chart Figure 4: International Passenger Survey estimates of immigration to the UK by citizenship and reason
Image .csv .xls
Figure 5: International Passenger Survey estimates of emigration from the UK by citizenship and reason
UK, year ending March 2017
Source: Office for National Statistics, International Passenger Survey
Notes:
- Figures for 2017 are provisional.
- Accompany or join means accompanying or joining others and includes those migrating to “accompany or join” a partner or immediate family; it includes those migrating to get married and those who, on prompting, gave no further reason of their own for migrating.
- Other reasons includes any other stated reason, for example, working holidaymakers, those visiting friends and family, anyone taking a long holiday as well as migrants who are travelling for religious reasons.
- No reason stated includes non-responses and the response "Emigrating or Immigrating".
Download this chart Figure 5: International Passenger Survey estimates of emigration from the UK by citizenship and reason
Image .csv .xlsWork remains the most common reason for international migration
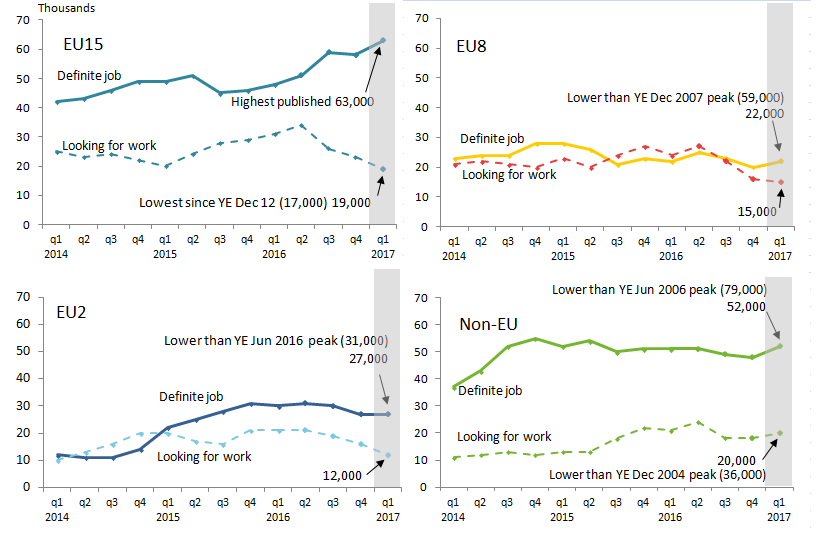
Long-Term International Migration (LTIM) estimated that 275,000 people immigrated for work-related reasons in year ending (YE) March 2017, down from 303,000 for the previous year. This difference was not statistically significant but this is the lowest recorded estimate since YE September 2014. The majority immigrated with a definite job (188,000) but fewer people arrived looking for work (down 39,000 to 87,000 – a statistically significant decrease).
International Passenger Survey (IPS) data shows that the reason for immigration varies by nationality with EU immigrants accounting for the majority (60%) of people arriving for work (Figure 4). Differences in reason for immigration are likely to reflect the differing rights of EU and non-EU citizens to migrate to the UK, as well as the effect of government policies and other factors (such as economic conditions in origin countries).
The decrease in people looking for work was accounted for by EU citizens, down 29,000 to 47,000 in the YE March 2017 (statistically significant). EU15 citizens looking for work decreased by 12,000 (statistically significant), while EU8 and EU2 each saw a decrease of 9,000 (not statistically significant) (Figure 6).
Figure 6: International Passenger Survey estimates of immigration to the UK for work-related reasons by citizenship
UK, year ending March 2014 to year ending March 2017
Source: Office for National Statistics, International Passenger Survey
Notes:
- Figures for 2017 are provisional. In this chart provisional estimates are shown in a shaded area. Rolling year data are produced quarterly and are for year ending (YE) March (q1), YE June (q2), YE September (q3) and YE December (q4).
- Peaks are shown with the appropriate YE data.
- Note that the EU total given in published tables and the text of this report includes Malta, Cyprus and Croatia.
- Figures may not sum due to rounding.
Download this image Figure 6: International Passenger Survey estimates of immigration to the UK for work-related reasons by citizenship
.png (41.6 kB) .xls (29.7 kB)
The estimate of non-EU immigrants arriving to work (72,000) in YE March 2017 was the same as the previous year. Of these, 20,000 (28%) arrived looking for work, which is likely to be accounted for by people granted visas under the Youth Mobility Scheme.
Most non-EU citizens arriving for work will be coming to take skilled jobs. Home Office visa statistics show that the number of visas granted for longer than 12 months to skilled workers fell by 4,780 (6.6%) to 67,322 in YE June 2017. More details of nationality and sector of work are provided in the Home Office Immigration Statistics release.
The IPS shows that an estimated 33,000 British citizens arrived for work reasons. Of these around half (16,000) arrived looking for work.
For emigration (LTIM estimates), work accounted for over half (182,000) of all emigrants in YE March 2017. Similar to immigration, people emigrating for work-related reasons were more likely to emigrate to a definite job (an increase of 21,000 to 122,000 (statistically significant)) – the highest recorded estimate since YE September 2012. Fewer people emigrated looking for work, 60,000, a decrease of 9,000 (not statistically significant).
An increase in people emigrating with a definite job was seen across all main citizenship groups (none were statistically significant changes) in the year to YE March 2017. There was a 9,000 (not statistically significant) decrease in emigrants looking for work, which was accounted for by non-EU citizens who saw a statistically significant decrease of 8,000.
More detailed LTIM and IPS estimates over time can be found in Tables 2 and 3 in the accompanying datasets.
Further work-related immigration data
In addition to the Long-Term International Migration (LTIM) and International Passenger Survey (IPS) estimates, further detail on work-related immigration is available from a number of sources including:
Home Office visa statistics
Department for Work and Pensions (DWP) National Insurance number (NINo) allocations
Office for National Statistics (ONS) estimates on UK and non-UK people in the labour market
Differences between these sources are described in Comparing sources of international migration statistics.
Work-related visas (non-European Economic Area (EEA) nationals)
In the year ending (YE) June 2017, the number of sponsored skilled work (Tier 2) visas, including dependants, was 1% lower than the previous year at 93,000. Tier 5 youth mobility and temporary visas were 4% lower at 42,000. In the YE June 2017, in all work categories there were 164,000 work-related visas (including dependants) granted, 2% lower than YE June 2016 (Table 4).
Table 4: Work-related visa grants by category
| UK, year ending June 2016 and year ending June 2017 | United Kingdom | |||
| Type of visa granted | Year ending June 2016 | Year ending June 2017 | Difference | % change to previous year |
| Total work-related visas | 166,590 | 163,594 | -2,996 | -2% |
| Tier 1 visas | 4,531 | 4,729 | 198 | 4% |
| Tier 2 (skilled) visas | 93,980 | 92,805 | -1,175 | -1% |
| Tier 5 (youth mobility and temporary) visas | 43,342 | 41,731 | -1,611 | -4% |
| Non-PBS/Other work visas | 24,737 | 24,329 | -408 | -2% |
| Source: Home Office | ||||
| Notes: | ||||
| 1. Figures include dependants. | ||||
| 2. PBS is "points-based system". | ||||
Download this table Table 4: Work-related visa grants by category
.xls (27.6 kB)Indian nationals accounted for 58% of total skilled work visas granted (53,366 of 92,805); and the information technology sector sponsored 42% of skilled work visa applications.
More detailed statistics by citizenship, industry sector and the underlying data can be found in the Home Office Immigration Statistics release. Due to differing definitions these visa data are not directly comparable with long-term immigration estimates from the International Passenger Survey, as explained in the comparing sources article.
How many adult overseas nationals register for a National Insurance number (NINo)?
National Insurance number (NINo) registrations and IPS estimates should not be directly compared. NINo figures include short-term migrants and registration may not have taken place in the same period as arrival (as explained in further detail the information on the differences article).
In the year ending (YE) June 2017:
there were 771,000 NINo registrations overall, a decrease of 7% on the previous year
there were 576,000 NINo registrations from EU nationals, a decrease of 9% on the previous year
NINo registrations to EU15 (217,000) and EU8 (138,000) fell by 5% and 21% respectively; registrations from the EU2 fell by 3% to 218,000
there were 194,000 NINo registrations from non-EU nationals, an increase of 1% on the previous year
Following a recent peak in 2015, the total number of NINo registrations has been falling – this is mainly because of a fall from the EU (in particular the EU8) while registrations from outside the EU have remained broadly level. A similar pattern is reported in the International Passenger Survey (IPS) work-related long-term immigration estimates although for the latest year EU15 immigration for work increased slightly (not statistically significant).
The Department for Work and Pensions (DWP) statistical first release on NINo registrations and the summary tables provide more detail alongside the background information.
NINo allocations to adult overseas nationals and nationality at point of NINo registration of DWP working age benefit recipients (NINo benefit claimants) are no longer badged as National Statistics. The statistics continue to be published as Official Statistics following Office for Statistics Regulation reassessment of the statistics. The full assessment can be found on the UK Statistics Authority website in a report on the reassessment of the NINo statistics.
Overseas nationals in the UK labour market
Labour market statistics are estimates of the stock of people working in the UK and are not designed to provide a measure of migration flows. As a result, changes in the labour market stock cannot be directly compared with long-term net migration.
Estimates of the UK and non-UK population involved in the labour market (employed, unemployed and economically inactive) by nationality and country of birth were recently published. These statistics are derived from the Labour Force Survey up to the latest period that is, April to June 2017. Latest estimates showed there were 3.56 million non-UK nationals in employment in the UK, 199,000 were unemployed and 1.12 million were economically inactive.
An in-depth analysis of the labour market characteristics of UK, EU and non-EU nationals in the UK in 2016 was published in April 2017.
Study was the second most common reason for migration
Long-Term International Migration (LTIM) estimates show that immigration for study (139,000) was the second most common reason for migration in year ending (YE) March 2017. Immigration to study saw a statistically significant decrease of 27,000 compared with the previous year. (See LTIM data in Table 2, Chart 2a and 2b in the accompanying datasets).
Student immigration follows a seasonal pattern, with the majority of international students arriving between July and September. As such, annual figures typically change in the YE September period. Therefore, the 27,000 statistically significant decrease from YE March 2016 to YE March 2017 is to be expected following similar figures in the last 2 quarters.
International Passenger Survey (IPS) data show that, of those whose main reason for long-term immigration was study, the majority (93,000 or 69%) were non-EU citizens (Figure 6) – a statistically significant decrease of 20,000 on the previous year. The comparable number of visas issued over the year to YE March 2017 to non-EU students for 12 months or more reported by the Home Office rose by 5% to 142,128.
As noted, there is a difference between the long-term IPS estimates for immigration to study and the numbers of long-term student visas issued by the Home Office. There are a range of potential reasons why the data sources might differ, such as: timing, stated intentions and length of stay, sampling variability in the survey and if a visa was used or not, as discussed in the student section in the Migration Statistics Quarterly Report: Feb 2017 statistical bulletin. Differences are explained further in Comparing sources of international migration statistics article.
Home Office visa data provide additional detail for non-EU migrant students. The most recent data for YE June 2017 shows the total sponsored visa applications to study (for all visa lengths) from non-EU nationals (main applicants only) rose by 3% to 203,816.
This included changes in visa applications to study as follows:
a rise for higher education (to 170,929, up 5%); within this total, applications to Russell Group universities rose by 9%
a rise for English language schools (to 2,940, up 20%)
falls for further education sector (to 14,445, down 9%), and independent schools (to 12,895, down 6%)
More than one-third of non-EU study visas were granted to Chinese students (up by 12,000 or 17% compared with a year earlier).
More detailed estimates over time can be found for LTIM in Table 2 and for IPS in Table 3 in the accompanying datasets. More detailed statistics and underlying data on visas for study reasons can be found in the Home Office Immigration Statistics release.
Other reasons for international migration
Long-Term International Migration (LTIM) estimates for year ending (YE) March 2017 for other reasons include:
to accompany or join others (80,000 immigrants; 29,000 emigrants)
other reasons (63,000 immigrants; 33,000 emigrants)
no stated reason (31,000 immigrants; 74,000 emigrants)
International Passenger Survey (IPS) estimates showed that 51,000 non-British citizens emigrated to return home to live in YE March 2017 a statistically significant increase of 34,000 compared with the previous year (Figure 6). These were mostly EU citizens (44,000, up 20,000 from YE March 2016) half of whom were from EU8 countries (all statistically significant changes).
These were the largest estimates for EU and EU8 citizens since December 2008.
More detailed estimates over time can be found for LTIM in Table 2 and for IPS in Table 3 in the accompanying datasets. More detailed statistics and underlying data on visas family reasons can be found in the Home Office Immigration Statistics release.
How many people are granted asylum in the UK?
The Home Office publishes data on asylum applications, grants and persons resettled. In the year ending (YE) June 2017, a total of 16,211 people were granted asylum, resettlement or an alternative form of protection. This is a 7% increase from 15,108 in the previous year.
Of the 16,211 total, 9,350 were grants of asylum or an alternative form of protection to main applicants and their dependants following an in-country application for asylum (a decrease of 2,319 from the previous year). An additional 6,861 people were brought to the UK under various resettlement schemes (an increase of 3,422 from the previous year).
Over 8,500 Syrian nationals have been granted humanitarian protection under the Vulnerable Persons Resettlement Scheme since it began in 2014.
In 2016, the largest number of applications for asylum came from nationals of Iran (4,184), followed by Pakistan (2,870) and Iraq (2,672). Grant rates for asylum and other forms of protection vary considerably between nationalities. For example, at initial decision, the grant rate for Iranian nationals was 37% (1,456 grants), compared with 12% (285 grants) for Iraqi nationals. Overall, there were 8,465 grants at initial decision for all nationalities in 2016, which corresponds to a grant rate of 34%. A separate Home Office analysis shows that for the years 2013 to 2015, on average 37% of decisions were granted initially, but this proportion rose to 52% after appeal.
More detailed statistics and underlying data on asylum and protection can be found in the Home Office Immigration Statistics release.
Back to table of contents9. What has changed in this publication?
We have updated the structure and some of the headings of this bulletin in line with the ONS Statistical bulletin guidance and following feedback from the Consultation on International Migration Statistics Outputs. If you have comments or suggestions on the format please let us know by emailing MigStatsUnit@ons.gov.uk.
Following the Office for Statistics Regulation (OSR) report published on 27 July 2017, The quality of the long-term student migration statistics, former student emigration estimates are now labelled as Experimental Statistics.
To avoid potential confusion about the contribution that particular groups of migrants make to total net migration figures, the previously published “balance” figures by reason have been removed from Tables 2 and 3 in the accompanying datasets.
Additional labour market data for UK and non-UK people in the labour market was published on 16 August 2017. This includes an analysis of Labour Force Survey (LFS) estimates for employment, unemployment and economic inactivity by nationality and country of birth.
Back to table of contents10. Upcoming changes to this bulletin
Data tables including “old country groupings”, which described old and new commonwealth country groups, have been removed from the published accompanying datasets. Estimates using the old country groupings will only be available in the annual underlying datasheets (4-series tables) that accompany the annual final data tables published each year in November. Data tables for the “old country groupings” continue to be available on the Office for National Statistics (ONS) website up to 2015; from 2016 onwards tables may be available on request subject to ONS charging policy through MigStatsUnit@ons.gov.uk.
Back to table of contents11. Quality and methodology
The Long-Term International Migration Quality and Methodology Information report contains important information on:
the strengths and limitations of the data and how it compares with related data
users and uses of the data
how the output was created
the quality of the output including the accuracy of the data
For more detailed information on how our migration statistics are used, along with information on their strengths and limitations, please see Long-Term International Migration Estimates Methodology and International Migration Methodology.
A note on accuracy of the long-term migration estimates
Surveys gather information from a sample of people from a population. Using the International Passenger Survey (IPS) as an example, the population is passengers travelling through the main entry and exit points from the UK including airports, seaports and the Channel Tunnel. The estimates produced are based on only one of a number of possible samples that could have been drawn at a given point in time. Each of these possible samples would produce an estimated number of migrants. These may be different from the true value that would have been obtained if it were possible to ask everyone passing through about their migration intentions. This is known as sampling variability.
A confidence interval is a measure of the uncertainty around the estimate. Confidence intervals are reported in the accompanying datasets. Users are advised to be cautious when making inferences from estimates with relatively large confidence intervals. For immigration and emigration estimates where the lower confidence interval is below zero users should assume the estimate is above zero. Estimates from a survey could change from one period to the next simply due to sampling variability. In other words, the change may be due to which individuals were selected to answer the survey, and may not represent any real-world change in migration patterns.
For further information on confidence intervals, the accuracy of these statistics, comparing different data sources, and the difference between provisional and final figures, please see the Migration Statistics Quarterly Report – information for users and the Long-Term International Migration – frequently asked questions and background notes.
Revisions to net migration estimates in light of the 2011 Census
In April 2014, we published a report examining the quality of international migration statistics between 2001 and 2011, using the results of the 2011 Census. As a result we published a revised series of net migration estimates for the UK. Published tables have been updated on our website to include the revised estimates. The report, a summary and guidance on how to use these revised figures are available on our website. No revisions were made to separate immigration and emigration estimates at the time the net migration estimates were revised.
Back to table of contentsContact details for this Statistical bulletin
Related publications
You might also be interested in:
- Migration statistics first time user guide, glossary and list of products
- Long-Term International Migration – frequently asked questions
- International migration methodology
- International Migration: Table of Contents
- Home Office – Immigration statistics quarterly release
- Department for Work and Pensions – National Insurance number allocations to adult overseas nationals entering the UK
- Migration levels: What do you know about your area? - Visual.ONS
- Population estimates by ethnic group
- Research report on population estimates by characteristics
- Research Outputs: An approach for estimating ethnicity from survey and administrative data, 2011