Table of contents
- Main points
- Statistician’s comment
- Things you need to know about this release
- Net migration to the UK estimated to be +273,000
- Immigration to the UK estimated to be 596,000
- Emigration from the UK estimated to be 323,000
- Where can I find more information?
- Understanding the main terms used in this report
- A note on sampling and uncertainty
- Future releases
- Quality and methodology
1. Main points
The reporting period for the International Passenger Survey data in this release is for year ending (YE) September 2016 and therefore includes 3 months of data following the EU referendum; entry clearance visa, National Insurance number (NINo) and labour market data are available to the end of December 2016.
Net long-term international migration was estimated to be +273,000 in YE Sept 2016 (down 49,000 (not statistically significant – for more information see Things you need to know about this release) from YE Sept 2015); comprising +165,000 EU citizens, +164,000 non-EU citizens and -56,000 British citizens.
Immigration was estimated to be 596,000 in YE Sept 2016, (down 23,000 (not statistically significant) from YE Sept 2015); comprising 268,000 EU citizens, 257,000 non-EU citizens and 71,000 British citizens.
Emigration was estimated to be 323,000 in YE Sept 2016 (up 26,000 (not statistically significant) from YE Sept 2015); comprising 103,000 EU citizens, 93,000 non-EU citizens and 128,000 British citizens.
EU immigration included a statistically significant increase for EU2 citizens (up 19,000 to 74,000 – highest estimate recorded); partially offset by a not statistically significant decrease for EU8 citizens (down 10,000 to 58,000); immigration for EU15 citizens was flat.
The increase in emigration includes statistically significant increases for EU8 citizens, up 12,000 to 39,000, and non-EU citizens from the group Africa, the Americas and Oceania, up 11,000 to 39,000.
Long-term immigration to study (134,000) saw a statistically significant decrease of 41,000 from YE Sept 2015, the majority of which were non-EU (87,000 – down 31,000); however, the number of visas issued over the same period to non-EU students for 12 months or more was 141,286, up 2%; for more information see Things you need to know about this release.
In YE Sept 2016, 294,000 people immigrated to work, similar to the previous year; of these 190,000 (65%) had a definite job to go to (the highest estimate recorded) compared with 169,000 in YE Sept 2015 and 104,000 arrived looking for work compared with 120,000 the previous year; however, neither change was statistically significant.
In 2016, there were 626,000 NINo registrations by EU nationals (down 1% on the previous year) and 198,000 by non-EU nationals (up 1% on the previous year); note the NINo data include many short-term migrants.
In YE Sept 2016, 180,000 EU citizens arrived for work compared with 164,000 the previous year (not statistically significant); of these 113,000 had a definite job to go to, up 18,000 compared with the previous year (not statistically significant).
There were 38,517 asylum applications (including dependants) in 2016, a decrease of 1,451 from 2015 (4%) and the first annual fall since 2010; in addition, a further 4,369 people were granted humanitarian protection under the Syrian Vulnerable Persons Resettlement Scheme in 2016.
2. Statistician’s comment
“Although net migration in the year to September 2016 has not seen a statistically significant change, we have seen a statistically significant decrease in net migration among EU8 citizens and non-EU citizens from Africa, the Americas and Oceania.
This is the first release to contain long-term international migration estimates including three months of data following the EU referendum. Although we have seen a fall in net migration of EU8 citizens there have been continued increases in immigration from Romania and Bulgaria, so it is too early to say what effect the referendum result has had on long-term international migration.
There has been a statistically significant decrease in non-EU long-term students immigrating to the UK while a small increase was seen in the number of study visas issued. It is too early to tell if this is an indication of a long-term trend”.
Nicola White, Head of International Migration Statistics, Office for National Statistics
Back to table of contents3. Things you need to know about this release
The reporting period for the International Passenger Survey (IPS) data in this release is for year ending (YE) September 2016 and therefore includes 3 months of data following the EU referendum. Entry clearance visa, National Insurance number (NINo) and labour market data are available to the end of December 2016. Data covering a full year after the referendum (YE June 2017) will be available in November 2017. For more details on when all our outputs will cover the referendum period, please go to the Visual.ONS website.
For this release there are 2 particular points worth highlighting.
The net migration confidence interval (that is the uncertainty around the estimate due to it being based on a sample survey) is calculated using both the confidence intervals for immigration and emigration. This results in a relatively large confidence interval around the net migration estimate. The confidence interval around the change in net migration from one year to the next will also be relatively large as it will be based on the confidence intervals around the 2 net migration estimates. Therefore, for a change in net migration to be statistically significant the actual observed change in net migration would also need to be large to account for the relatively large confidence intervals.
There is a notable difference between the long-term IPS figures for immigration to study and long-term student visa data for the YE September 2016. There are potential reasons why the data sources differ such as: timing, stated intentions and length of stay, sampling variability and the fact that a visa may not be used. There have been differences in the trends between the IPS and visa data for study in the past, in particular around 2009 and 2010, so this is not unprecedented.
Long-term international student migration has a marked seasonal pattern with a large proportion of people immigrating to study in the July to September quarter. Particularly for those who will start the academic year in September, changes in immigration are more likely to be reflected in the YE September reporting year. It is too early to tell if this is an indication of an emerging long-term trend of the IPS student data as it is based on one quarter’s data and a small increase was seen in the number of study visas issued to non-EU citizens. Therefore we will continue to monitor the trends and compare against other sources such as university admissions data. Our future work programme will also help to understand such differences – International migration data and analysis: Improving the evidence.
ONS migration statistics use the UN recommended definition of a long-term international migrant: “A person who moves to a country other than that of his or her usual residence for a period of at least a year (12 months), so that the country of destination effectively becomes his or her new country of usual residence.”
Long-Term International Migration (LTIM) estimates are based on data from the IPS, with adjustments made for asylum seekers, non-asylum enforced removals, people resettled in the UK under resettlement schemes, visitor and migrant switchers and flows to and from Northern Ireland. LTIM estimates are used where available. Estimates of citizenship by reason for migration are based solely on IPS data. In these cases the IPS totals will not match LTIM totals, but will give a good measure of magnitude and direction of change. Figures relating to visas are produced by the Home Office and include long-term and short-term migrants and their dependants; the Department for Work and Pensions’ (DWP’s) National Insurance number (NINo) registrations to adult overseas nationals also include long-term and short-term migrants.
On 19 January 2017, the Office for Statistics Regulation (OSR) published an assessment report covering DWP statistics on NINo allocations to adult overseas nationals and nationality at point of NINo registration of DWP working age benefit recipients (NINo benefit claimants), for compliance with the Code of Practice for Official Statistics. OSR judgement is that the statistics published should have their National Statistics status temporarily suspended until work to improve their limited supporting guidance and overall public value is undertaken. The full assessment can be found on the UK Statistics Authority website: report on the reassessment of the NINo statistics.
ONS will continue to include statistics and commentary on NINo data pending further reviews with the OSR this year.
DWP welcomes the report and in particular that it upholds the quality and accuracy of the NINo statistics. These statistics now carry an “Official Statistics” badge, as the OSR have suspended the “National Statistics” badge and have set out some requirements for the statistics in order to have the National Statistics badge reinstated. DWP have already addressed some of these requirements in their Statistical Release, via the statistics landing page and through publication of a new User Guide to the Statistics. Others will be addressed by 30 April 2017 after which the OSR intend to review.
A consultation on international migration statistics outputs ran from 11 November 2016 until 23 December 2016. The purpose of this consultation was to gather insight and seek user views on the presentation and timing of the Government Statistical Service’s international migration statistics outputs and specifically what products are used, why they are used and what other data sources users would like to see published. Thank you to all those who responded to the consultation. We will publish a response to the consultation in March 2017.
Back to table of contents4. Net migration to the UK estimated to be +273,000
The net migration estimate (the difference between immigration and emigration) for the year ending (YE) September 2016 is +273,000 and has a 95% confidence interval of +/-41,000, compared with +322,000 (+/-37,000) in YE September 2015. This difference was not statistically significant. This is however the lowest recorded net migration estimate since YE June 2014.
The net migration confidence interval (that is the uncertainty around the estimate due to it being based on a sample survey) is calculated using both the confidence intervals for immigration and emigration. This results in a relatively large confidence interval around the net migration estimate. The confidence interval around the change in net migration from one year to the next will also be relatively large as it will be based on the confidence intervals around the 2 net migration estimates. Therefore, for a change in net migration to be statistically significant, the actual observed change in net migration would also need to be large to account for the relatively large confidence intervals.
Table 1 shows the headline figures for YE September 2015 and YE September 2016 with their corresponding confidence intervals. Statistically significant changes are normally denoted with an asterisk, but no changes in this table are statistically significant in this period.
Table 1: Latest changes in migration, UK, year ending September 2015 and year ending September 2016
| Thousands | |||||||||||||||
| YE Sept 2015 | 95% CI | YE Sept 2016 | 95% CI | Difference | |||||||||||
| Net migration | +322 | +/-37 | +273 | +/-41 | -49 | ||||||||||
| Immigration | 619 | +/-32 | 596 | +/-34 | -23 | ||||||||||
| Emigration | 297 | +/-19 | 323 | +/-22 | +26 | ||||||||||
| Source: Office for National Statistics, Long-Term International Migration | |||||||||||||||
| Notes: | |||||||||||||||
| 1. The estimates given are the sum of the EU, non-EU AND British citizenship groupings. | |||||||||||||||
| 2. 2016 estimates are provisional. | |||||||||||||||
| 3. Figures are rounded to the nearest thousand. Figures may not sum due to rounding. | |||||||||||||||
| 4. Further information on confidence intervals can be found in the MSQR Information for Users. | |||||||||||||||
| 5. YE = Year Ending. | |||||||||||||||
| 6. CI = Confidence Interval. | |||||||||||||||
| 7. Statistically significant change at the 5% level is indicated by an asterisk. | |||||||||||||||
Download this table Table 1: Latest changes in migration, UK, year ending September 2015 and year ending September 2016
.xls (28.2 kB)In YE September 2016, immigration was estimated to be 23,000 lower than the previous year whereas emigration was 26,000 higher over the same period. This resulted in net migration for YE September 2016 being estimated to be 49,000 lower than the previous year. None of these differences were statistically significant.
Figure 1: Long-Term International Migration, UK, 2006 to 2016 (year ending September 2016)

Source: Office for National Statistics, Long-Term International Migration
Notes:
- Figures for YE 2016 are provisional. In this chart provisional estimates are shown separated by a break in the series.
- Net migration estimates for the period 2001 to 2011 have been revised in light of the 2011 Census. Immigration and emigration estimates have not been revised and are therefore not consistent with the revised net migration estimates. The revised estimates are only available for the years ending June and December each year.
- Users are encouraged to review the published tables for confidence intervals and an insight into the inherent uncertainty in these statistics
Download this image Figure 1: Long-Term International Migration, UK, 2006 to 2016 (year ending September 2016)
.png (32.5 kB) .xls (35.3 kB)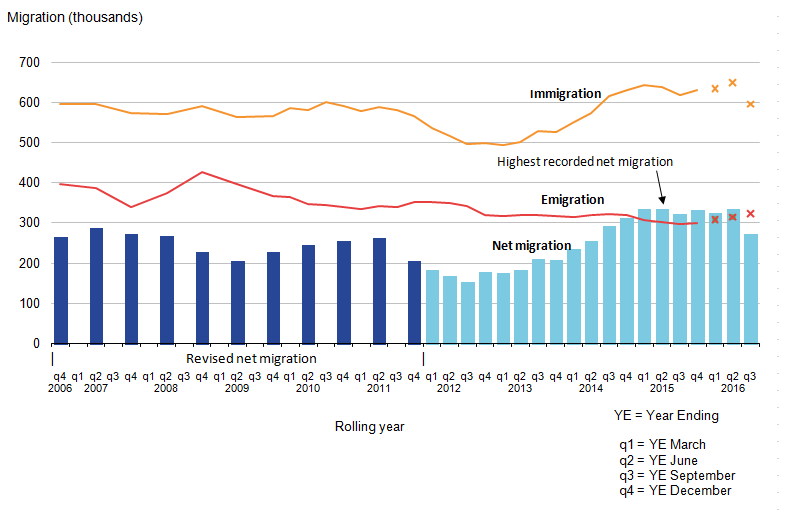
The ONS online interactive timeline provides annual totals and additional commentary from 1964 to 2015 to show the longer-term context, with the underlying data available for download.
Figure 2 shows the trend in net migration for EU, non-EU and British citizens and shows that the current level of net migration for EU citizens is similar to that for non-EU citizens, with the gap between the 2 series narrowing in recent years.
Figure 2: Net Long-Term International Migration by citizenship, UK, 1975 to 2016 (year ending September 2016)
Source: Office for National Statistics, Long-Term International Migration
Notes:
- Figures for 2016 are provisional. All other figures are final calendar year estimates of LTIM. In this chart provisional estimates are shown separated by a break in the series.
- This chart is not consistent with the revised total net migration estimates as shown in Figure 1. This also means that estimates for the period 2001 to 2011 are not fully comparable with those for later periods.
- Figures up to and including 1990 are IPS only, and from 1991 onwards are LTIM.
- Users are encouraged to review the published tables for confidence intervals and an insight into the inherent uncertainty in these statistics
Download this chart Figure 2: Net Long-Term International Migration by citizenship, UK, 1975 to 2016 (year ending September 2016)
Image .csv .xlsTable 2 shows net migration by citizenship estimates for YE September 2015 and YE September 2016 with their corresponding confidence intervals. Statistically significant changes are denoted with an asterisk. Statistically significant decreases were seen for EU8 citizens, down 22,000 to +19,000 and for non-EU citizens from Africa, the Americas and Oceania, down 24,000 to +44,000. Net migration of EU2 citizens is the highest estimate recorded.
Table 2: Latest changes in net migration by citizenship, year ending September 2015 and year ending September 2016
| Thousands | |||||||
| YE Sept 2015 | 95% CI | YE Sept 2016 | 95% CI | Difference | |||
| Total | +322 | +/-37 | +273 | +/-41 | -49 | ||
| British | -40 | +/-18 | -56 | +/-18 | -16 | ||
| EU | +171 | +/-26 | +165 | +/-30 | -6 | ||
| (of which) EU15 | +80 | +/-18 | +81 | +/-20 | 1 | ||
| (of which) EU8 | +41 | +/-14 | +19 | +/-16 | -22* | ||
| (of which) EU2 | +48 | +/-12 | +64 | +/-15 | 16 | ||
| Non-EU | +192 | +/-20 | +164 | +/-21 | -28 | ||
| (of which) Asia | +114 | +/-15 | +106 | +/-16 | -8 | ||
| (of which) Rest of World | +68 | +/-13 | +44 | +/-13 | -24* | ||
| Source: Office for National Statistics, Long-Term International Migration | |||||||
| Notes: | |||||||
| 1. EU other and Other Europe citizenship groupings are not included in the table. | |||||||
| 2. 2016 estimates are provisional. | |||||||
| 3. Figures are rounded to the nearest thousand. Figures may not sum due to rounding. | |||||||
| 4. Further information on confidence intervals can be found in the MSQR Information for Users. | |||||||
| 5. YE = Year Ending. | |||||||
| 6. CI = Confidence Interval. | |||||||
| 7. Statistically significant change at the 5% level is indicated by an asterisk. | |||||||
Download this table Table 2: Latest changes in net migration by citizenship, year ending September 2015 and year ending September 2016
.xls (30.2 kB)5. Immigration to the UK estimated to be 596,000
The latest immigration estimate for the year ending (YE) September 2016 is 596,000, with a confidence interval of +/-34,000, compared with 619,000 (+/-32,000) in YE September 2015. This difference was not statistically significant. However, this is the lowest recorded immigration estimate since YE June 2014.
In YE September 2016 immigration of EU citizens was estimated to be 268,000, compared with 256,000 the previous year. This difference was not statistically significant. Immigration of non-EU citizens was estimated to be 257,000, compared with 275,000 and British citizens was 71,000 compared with 88,000 the previous year; again neither difference was statistically significant.
Figure 3: Immigration to the UK by citizenship, 2006 to 2016 (year ending September 2016)
Source: Office for National Statistics, Long-Term International Migration
Notes:
- Figures for 2016 are provisional. In this chart provisional estimates are shown separated by a break in the series.
- This chart is not consistent with the total revised net migration estimates as shown in Figure 1.
Download this chart Figure 3: Immigration to the UK by citizenship, 2006 to 2016 (year ending September 2016)
Image .csv .xlsEU citizens
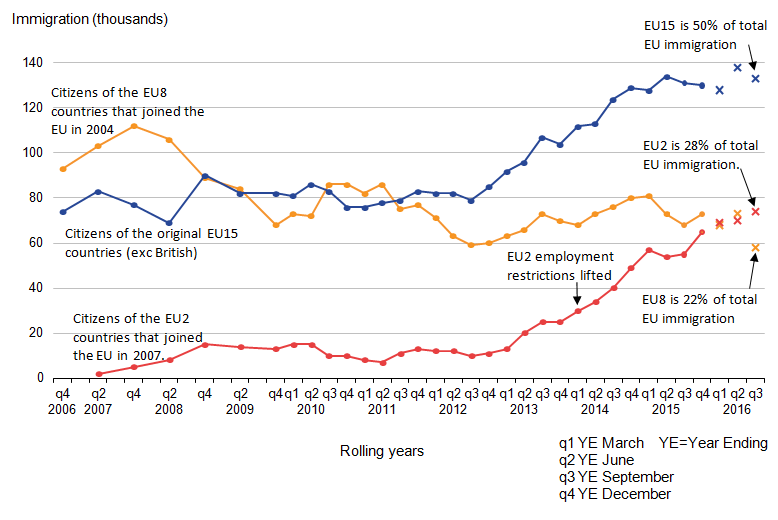
Long-term immigration from the EU rose from 2012 but has levelled off since 2015. Figure 4 shows how the trends in EU immigration vary between the 3 main EU groups: EU15, EU8 and EU2 immigration was estimated to be 133,000, 58,000 and 74,000 (highest estimate recorded) respectively.
EU2 immigration showed a statistically significant increase of 19,000 compared with the previous year and now accounts for 28% of EU immigration. However, this increase was partially offset by a not statistically significant decrease for EU8 citizens (down 10,000 to 58,000).
Figure 4: EU immigration to the UK, 2006 to 2016 (year ending September 2016)
Source: Office for National Statistics, Long-Term International Migration
Notes:
- Figures for 2016 are provisional. In this chart provisional estimates are represented by a cross.
- This chart does not include data for citizens of Malta, Cyprus or Croatia.
Download this image Figure 4: EU immigration to the UK, 2006 to 2016 (year ending September 2016)
.png (32.2 kB) .xls (35.8 kB)
Non-EU citizens
Immigration of non-EU citizens was estimated to be 257,000, down from 275,000 the previous year. This difference was not statistically significant, however, this is the lowest estimate recorded since YE December 2013.
Nationality information on individuals who are subject to immigration controls, coming from non-EU countries, is provided by visa data published by the Home Office. Recent trends in visas granted have provided a good leading indicator for trends in long-term non-EU immigration. The total number of non-visitor visas granted in 2016 (576,637) increased slightly from 2015 (up 22,108 or 4%). There were increases for Chinese nationals (up 10,208 or 11%) and falls for Nigerian nationals (down 3,112 or 20%) and United States nationals (down 1,813 or 5%), with the highest numbers of visas being granted to Chinese and Indian nationals.
There are a range of potential reasons why the long-term immigration estimates from the International Passenger Survey (IPS) may differ from figures for visas granted, including:
visa data will include shorter visas (for less than 12 months)
differences in coverage, for example differences between stated intentions and length of stay
sampling variation in the IPS
timing differences between when visas are granted and when an individual travels
visa and admissions data can include dependants recorded in different subcategories from the IPS
For more information see the Home Office Immigration Statistics October to December 2016 bulletin.
British citizens
Long-Term International Migration (LTIM) estimates show that in YE September 2016, the estimated number of British citizens immigrating to the UK was 71,000 compared with 88,000 the previous year. This difference was not statistically significant, however, this is the lowest recorded estimate since 1981. These numbers include British citizens returning to the UK after living abroad for a year or more, or citizens who were born abroad and may be coming to the UK for the first time.
Immigration by main reason
Figure 5: Long-Term International Migration estimates of immigration to the UK, by main reason for migration, 2006 to 2016 (year ending September 2016)
Source: Office for National Statistics, Long-Term International Migration
Notes:
- Figures for 2016 are provisional. In this chart provisional estimates are shown separated by a break in the series.
- Up to YE December 09, estimates are only available annually.
- Acc./join means accompanying or joining.
Download this chart Figure 5: Long-Term International Migration estimates of immigration to the UK, by main reason for migration, 2006 to 2016 (year ending September 2016)
Image .csv .xlsIPS data show that, of those whose main reason for long-term migration was work-related, the majority (64%) were EU citizens, whereas of those whose main reason for migration was study, the majority (69%) were non-EU citizens. The difference in reason for immigration likely reflects the differing rights of EU and non-EU citizens to migrate to the UK as well as the impact of government policies and other factors (such as economic conditions in origin countries).
Immigration for work
The most commonly stated reason for immigration to the UK was work (Figure 5). In YE September 2016, 294,000 (49%) people immigrated for work, compared with 289,000 in YE September 2015. This difference was not statistically significant.
Of the 294,000 arriving to work, 190,000 (65%) had a definite job to go to (the highest estimate recorded) compared with 169,000 in YE September 2015 and 104,000 arrived looking for work compared with 120,000 the previous year; however, neither change was statistically significant.
IPS estimates show around 64% of immigrants arriving for work were EU citizens, 24% were non-EU citizens and 12% were British citizens.
In YE September 2016, 180,000 EU citizens arrived for work compared with 164,000 in YE September 2015. This difference was not statistically significant. Approximately 63% (113,000) of all EU immigrants arriving for work-related reasons reported they had a definite job to go, compared with 95,000 the previous year (not statistically significant). The percentages of those arriving with a definite job for each EU citizenship group were: EU15: 70%, EU8: 51%, EU2: 60%.
Of the 67,000 non-EU immigrants who arrived for work-related reasons, 49,000 (73%) had a definite job to go to.
An estimated 35,000 British citizens arrived for work. Of these 16,000 arrived looking for work, a statistically significant decrease of 10,000 compared with the previous year.
Figure 6: IPS estimates of immigration to the UK for work-related reasons by citizenship, year ending September 2013 to year ending September 2016

Source: Office for National Statistics, International Passenger Survey
Notes:
- Figures for 2016 are provisional. In this chart provisional estimates are represented by a cross.
- These are rolling year estimates, and peaks are shown with the appropriate “year ending” data.
- Note that the EU total given in published tables and the text of this report includes Malta, Cyprus and Croatia, so will be slightly different from the total of the 3 EU charts shown in Figure 6.
Download this image Figure 6: IPS estimates of immigration to the UK for work-related reasons by citizenship, year ending September 2013 to year ending September 2016
.png (32.9 kB) .xls (30.2 kB)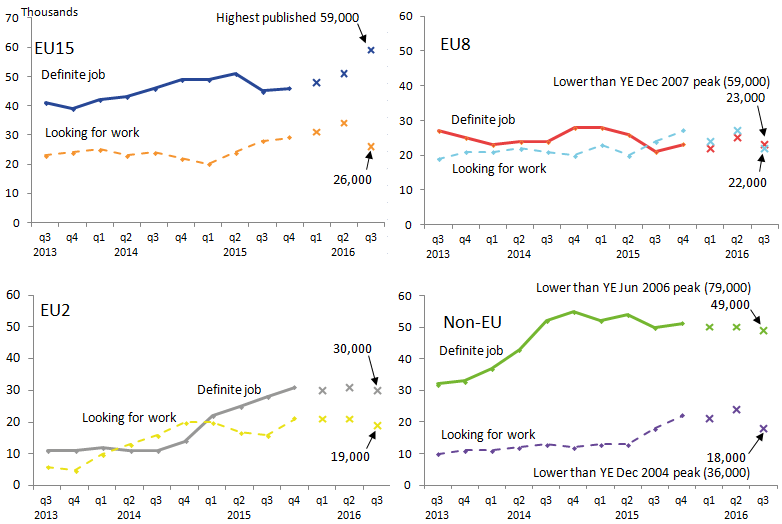
Work-related visas (non-European Economic Area nationals)
In 2016, the number of sponsored skilled work (Tier 2) visas, including dependants, rose by 1% to just over 93,000. In all work categories there were 163,882 work-related visas (including dependants) granted in 2016, down 1% (2,018), mainly accounted for by fewer Tier 5 visas, which fell 2,895 to 42,033.
Table 3: Work related visa grants by category, 2015 and 2016
| UK | ||||||||||||
| Type of visa granted | 2015 | 2016 | Difference | % change to previous year | ||||||||
| Total work-related visas | 165,900 | 163,882 | -2,018 | -1% | ||||||||
| Tier 1 visas | 5,389 | 4,540 | -849 | -16% | ||||||||
| Tier 2 (skilled) visas | 92,026 | 93,244 | 1,218 | 1% | ||||||||
| Tier 5 (youth mobility and temporary) visas | 44,928 | 42,033 | -2,895 | -6% | ||||||||
| Non-PBS/Other work visas | 23,557 | 24,065 | 508 | 2% | ||||||||
| Source: Home Office | ||||||||||||
| Notes: | ||||||||||||
| 1. Figures include dependants. | ||||||||||||
| 2. PBS is “points-based system”. | ||||||||||||
Download this table Table 3: Work related visa grants by category, 2015 and 2016
.xls (28.2 kB)Indian nationals accounted for 57% of total skilled work visas granted (53,575 of 93,244), with USA nationals the next largest nationality group (9,348 or 10% of the total). The information technology sector sponsored 42% of skilled work visa applications, followed by professional, scientific and technical activities (19%) and financial and insurance activities (12%).
There were falls in numbers of work-related visas granted following the introduction of the points-based system and the onset of the economic downturn, in 2008. The fall in Tier 1 was largely accounted for by falls in dependants in the Tier 1 General category (-848) now closed, and in the Tier 1 Entrepreneur and Tier 1 Investor categories (-414 and -121 respectively), partially offset by an increase in the Tier 1 Exceptional Talent category (+248).
IPS long-term immigration estimates for work and formal study among non-EU nationals have broadly followed the same long-term trends as visas granted for work and study. However, IPS estimates will be lower than the visa figures because the IPS estimates exclude those individuals who intend to stay for less than 1 year and there will be other differences in categorisation. Furthermore, the dependants of those granted a visa to work or study are included in the work and study visa figures, whereas the reason for migration for such individuals, in most cases, are likely to be recorded as accompanying or joining others by the IPS. Other differences may be due to sampling variation in the IPS. For more information see the Home Office Immigration Statistics October to December 2016 bulletin.
National Insurance number (NINo) registrations to adult overseas nationals
On 19 January 2017, the Office for Statistics Regulation (OSR) published an assessment report covering Department for Work and Pensions (DWP) statistics on NINo allocations to adult overseas nationals and nationality at point of NINo registration of DWP working age benefit recipients (NINo benefit claimants), for compliance with the Code of Practice for Official Statistics. OSR judgement is that the statistics published should have their National Statistics status temporarily suspended until work to improve their limited supporting guidance and overall public value is undertaken. The full assessment can be found on the UK Statistics Authority website: report on the reassessment of the NINo statistics.
NINo registrations and IPS estimates should not be directly compared. NINo figures include short-term migrants and the figures are based on the recorded registration date on the National Insurance Recording and Pay As You Earn System (NPS) (after the NINo application process has been completed) and so should not be used as a direct measure of when a person migrated to the UK. As such, there will be differences between the NINo registration data shown in Table 4, and the estimates of long-term international migration. More detailed information on these differences is discussed in the publication from 12 May 2016.
In YE December 2016, there were 626,000 National Insurance number (NINo) registrations by EU nationals (down 1% on the previous year) and 198,000 by non-EU nationals (up 1% on the previous year).
Table 4: National Insurance number registrations to adult overseas nationals entering the UK, year ending December 2016 (these data are not designated National Statistics)
| Thousands | ||||||||||||
| World area | 2015 | 2016 | Difference | % change to previous year | ||||||||
| Total | 828 | 825 | -3 | 0% | ||||||||
| European Union | 630 | 626 | -5 | -1% | ||||||||
| (of which) EU15 | 232 | 232 | -1 | 0% | ||||||||
| (of which) EU8 | 185 | 158 | -26 | -14% | ||||||||
| (of which) EU2 | 209 | 231 | 22 | 11% | ||||||||
| Non-European Union | 197 | 198 | 1 | 1% | ||||||||
| Source: Department for Work and Pensions. | ||||||||||||
| Notes: | ||||||||||||
| 1. The figures are based on recorded registration date on the National Insurance Recording and Pay As You Earn System, ie after the NINo application process has been completed, and are not a direct measure of when a person migrated to the UK. | ||||||||||||
| 2. The number of new registrations of NINos to non-UK nationals over a given period is not the same as the total number of non-UK nationals who hold a NINo. | ||||||||||||
| 3. The total number of non-UK nationals who have been allocated a NINo is not the same as the number of non-UK nationals working in the UK. This is because people who have been allocated NINos may subsequently have left the UK, or they may still be in the UK but have ceased to be in employment. | ||||||||||||
| 4. Some people arriving into the UK may already hold a NINo from a previous stay in the UK. Once a person has been allocated a NINo, they do not need to reapply in order to work in the UK. | ||||||||||||
| 5. There are a small number of cases where the nationality of an individual is not recorded on the source system - therefore the sum of world areas may differ from the total. | ||||||||||||
| 6. Differences may vary from calculations derived from the totals due to rounding. | ||||||||||||
Download this table Table 4: National Insurance number registrations to adult overseas nationals entering the UK, year ending December 2016 (these data are not designated National Statistics)
.xls (30.2 kB)
Figure 7: National Insurance number registrations to adult overseas nationals entering the UK from the EU and non-EU, 2007 to year ending December 2016 – (these data are not designated National Statistics)
Source: Department for Work and Pensions, National Insurance number registrations to adult overseas nationals
Notes:
- The figures are based on recorded registration date on the National Insurance Recording and Pay As You Earn System (NPS), that is after the NINo application process has been completed, and are not a direct measure of when a person migrated to the UK.
- Although figures do accurately reflect the number of NINos registered over time, a change to the process of recording NINos during the quarter April to June 2014, means that the volume of NINo registrations recorded were lower in that quarter and then higher in the subsequent quarter July to September 2014 than would otherwise be the case. Comparisons of NINo registrations over time between these periods should be viewed with caution.
Download this chart Figure 7: National Insurance number registrations to adult overseas nationals entering the UK from the EU and non-EU, 2007 to year ending December 2016 – (these data are not designated National Statistics)
Image .csv .xlsAs with the LTIM estimates, NINo registrations numbers reflect the rise in EU immigration between 2012 and 2015. The sharp rise in registrations to EU2 nationals in 2014 to some extent mirrors the long-term migration trend over an extended period. However, in the last year, the growth in EU2 registrations has been offset by a fall in registrations from other EU member states.
Table 5 shows the top registrations for individual EU and non-EU nationalities.
Table 5: Top 5 EU and non-EU country of nationality for NINo registrations, year ending December 2016 (these data are not designated National Statistics)
| UK, thousands | |||
| EU country of nationality | NINo registrations | Non-EU country of nationality | NINo registrations |
| Romania | 189 | India | 35 |
| Poland | 93 | Australia | 13 |
| Italy | 63 | China | 13 |
| Spain | 48 | Pakistan | 12 |
| Bulgaria | 42 | United States | 10 |
| Source: Department for Work and Pensions | |||
Download this table Table 5: Top 5 EU and non-EU country of nationality for NINo registrations, year ending December 2016 (these data are not designated National Statistics)
.xls (26.1 kB)Labour market statistics
Labour market statistics are a measure of the stock of people working in the UK and are not designed to provide a measure of migration flows. As a result, changes in the labour market stock cannot be directly compared with changes in long-term net migration.
Of the total in employment in October to December 2016, 89.1% were British nationals, 7.0% were EU nationals and 3.9% non-EU nationals. These compare with 89.7%, 6.5%, 3.8% respectively, in October to December 2015, showing a small proportional difference.
There have been increases for all nationality groupings in employment in October to December 2016, compared with the same quarter for the previous year (Table 6).
Table 6: Change in employment, October to December 2016, UK
| Thousands | |||||||||||||
| Nationality grouping | Total in employment, Oct to Dec 2015 | Total in employment, Oct to Dec 2016 | Difference | % Change to previous year | |||||||||
| Total | 31,617 | 31,916 | 299 | 0.9% | |||||||||
| British | 28,365 | 28,435 | 70 | 0.2% | |||||||||
| Non-UK | 3,245 | 3,478 | 233 | 7.2% | |||||||||
| Non-EU | 1,193 | 1,236 | 42 | 3.6% | |||||||||
| EU | 2,052 | 2,242 | 190 | 9.3% | |||||||||
| EU15 | 862 | 930 | 68 | 7.9% | |||||||||
| EU8 | 972 | 1,013 | 41 | 4.2% | |||||||||
| EU2 | 204 | 286 | 82 | 40.3% | |||||||||
| Source: Office for National Statistics | |||||||||||||
| Notes: | |||||||||||||
| 1. Figures may not sum due to rounding. | |||||||||||||
Download this table Table 6: Change in employment, October to December 2016, UK
.xls (27.6 kB)The growth in overall employment over the last year was 299,000. Of this 23% can be accounted for by growth in employment for British nationals, 63% by growth in employment for EU nationals with the remaining 14% accounted for by non-EU nationals.
Note that these growth figures relate to net changes in the number of people in employment. They do not indicate the proportion of new jobs that have been filled by UK and non-UK workers.
Immigration for study
The LTIM estimate of people arriving to study was 134,000 (22% of the total LTIM immigration) in YE September 2016, a statistically significant reduction from 175,000 in September 2015. This is the lowest estimate recorded since 2002.
IPS estimates show 69% of those immigrating to study for more than 12 months were non-EU citizens, 26% were EU citizens and the remaining 5% were British citizens. In YE September 2016 the estimate of non-EU citizens immigrating to the UK to study for 12 months or more was 87,000, a statistically significant decrease of 31,000 from 118,000 the previous year. Citizens of Asian countries made up 68% (59,000) of these, a statistically significant decrease of 23,000 from 82,000 the previous year.
Home Office visa data provide additional detail for non-EU migrant students1. In YE September 2016 the number of visas issued to non-EU students for 12 months or more was 141,286, a rise of 2%.
There is a notable difference between the long-term IPS figures for immigration to study and long-term student visa data for the YE September 2016. There are potential reasons why the data sources differ such as: timing, stated intentions and length of stay, sampling variability and the fact that a visa may not be used. There have been differences in the trends between the IPS and visa data for study in the past, in particular around 2009 and 2010, so this is not unprecedented.
Long-term international student migration has a marked seasonal pattern with a large proportion of people immigrating to study in the July to September quarter. Particularly for those who will start the academic year in September, so changes in immigration are more likely to be reflected in the YE September reporting year. It is too early to tell if this is an indication of an emerging long-term trend of the IPS student data as it is based on one quarter’s data and a small increase was seen in the number of study visas issued to non-EU citizens. Therefore we will continue to monitor the trends and compare against other sources such as university admissions data. Our future work programme will also help to understand such differences – International migration data and analysis: Improving the evidence.
In 2016, total sponsored visa applications to study from non-EU nationals (main applicants only) fell by less than 1% to 200,8492. This included a rise in visa applications to study for higher education (to 167,554, up 1%); within this total, applications from Russell Group universities rose by 6%; but there were falls for:
further education sector and other educational institutions (to 14,586, down 9%)
English language schools (to 2,828, down 3%)
independent schools (to 13,376, down 2%)
There were 87,197 visas granted to short-term students (formerly known as “student visitors”), a rise of 39%.
Table 7 shows that more than one-third of non-EU study visas were granted to Chinese students, and together the 3 largest nationalities made up more than half of the non-EU foreign students granted visas in calendar year 2016.
Table 7: Top 5 nationalities for study, calendar year 2016 (main applicants)
| UK | |||||||||||
| Country of nationality | Study visa granted | % of total | |||||||||
| Total | 194,608 | 100% | |||||||||
| China | 76,225 | 39% | |||||||||
| United States | 13,701 | 7% | |||||||||
| India | 10,798 | 6% | |||||||||
| Hong Kong | 8,995 | 5% | |||||||||
| Malaysia | 7,697 | 4% | |||||||||
| Other non-EEA nationalities | 77,192 | 40% | |||||||||
| Source: Home Office | |||||||||||
Download this table Table 7: Top 5 nationalities for study, calendar year 2016 (main applicants)
.xls (27.1 kB)For more information on immigration to the UK for study, see the Home Office topic report on study and the Home Office research report on short term study (formerly known as “student visitors”).
Immigration to accompany or join others
The third most common reason for migrating to the UK is to accompany or join others. This category can include people who are arriving to marry a UK resident as well as people coming as a family member of another migrant coming for other reasons, such as to work3. In YE September 2016, of all long-term immigrants, 12% (74,000) arrived in the UK to accompany or join others (Figure 5), a similar estimate to the year before.
Home Office entry clearance visa statistics show that 38,119 family route visas were granted in 2016, an increase of 1% compared with 2015 (37,719), but nearly half the peak level of YE March 2007 (72,894). This category includes partners, as well as some dependants. A combined total that also includes those granted permissions as dependants of other non-EU visa holders and non-EU persons granted EEA family permits is 135,144, a decrease of 1%. Note these figures include both long term and short term migrants and are therefore not directly comparable to the IPS.
Further information on visas granted for family reasons has been published by the Home Office.
Immigration for other reasons
There was a statistically significant rise in the number of immigrants arriving in the UK for other reasons, from 50,000 to 61,000 in YE September 2016. This includes asylum seekers (as measured by Home Office data), volunteers, religious pilgrims and those coming for medical treatment. From YE December 2015 the LTIM adjustments additionally include the number of people resettled in the UK under the various resettlement schemes, as provided by the Home Office.
Asylum applications
There were 38,517 asylum applications (including dependants) in 2016, a slight decrease from 2015 (down 1,451 or 4%). This is the first annual fall in asylum applications since 2010.
The number of applications is less than half the level of the peak in 2002 (103,081) and relatively low compared with some other European countries (the UK received the sixth highest number of asylum seekers of the 28 EU member states in 2016).
A total of 9,933 people were granted asylum or an alternative form of protection in 2016, an overall grant rate of 32% at initial decision.
Table 8 shows the 5 nationalities with the highest number of applications for asylum to the UK in 2016.
Table 8: Nationalities with highest number of asylum applications, UK, calendar year 2016
| UK | ||||||||||||
| Country of nationality | Asylum applications | Change since last year | Proportion granted (at initial decision) | |||||||||
| 1. Iran | 4,792 | 1,076 | 39% | |||||||||
| 2. Pakistan | 3,717 | 352 | 16% | |||||||||
| 3. Iraq | 3,651 | 1,003 | 13% | |||||||||
| 4. Afghanistan | 3,094 | 242 | 35% | |||||||||
| 5. Bangladesh | 2,234 | 914 | 6% | |||||||||
| Source: Home Office | ||||||||||||
| Notes: | ||||||||||||
| 1. Figures include dependants | ||||||||||||
Download this table Table 8: Nationalities with highest number of asylum applications, UK, calendar year 2016
.xls (27.1 kB)There were 1,588 asylum applications from Syrian nationals (including dependants) 2016, the ninth highest nationality and a decrease of 43% compared with the previous year (2,794). There were 1,764 grants of asylum or an alternative form of protection (including dependants) to those giving Syrian as their nationality in 2016, a grant rate of 86% at initial decision. In addition, 4,369 people were granted humanitarian protection under the Syrian Vulnerable Persons Resettlement Scheme in 2016 (5,706 since the scheme began in January 2014).
Further detail is provided in the Home Office topic report on asylum.
Settlement in the UK
The number of non-EEA nationals granted permission to stay permanently in the UK fell by 35% to 59,009 in 2016. The number of grants is low relative to the peak in YE September 2010 (241,586). The decrease in the latest 12 months was driven by falls in work (down 16,449), family (down 10,160) and asylum-related (down 5,824) grants. This may partly reflect changes to the family rules in July 2012 on how quickly partners qualify for settlement and other factors affecting the number of visas and extensions granted in previous years.
For more information on settlement in the UK, see the Home Office topic report on settlement
In February 2017, the Home Office published “Statistics on changes in migrants’ visa and leave status: 2015” (formerly known as “The Migrant Journey”), which shows how non-EEA migrants change their immigration status, and the immigration routes used prior to achieving settlement in the UK. Main points include:
over a quarter (30%; 21,507) of those issued a skilled work visa (which has a potential path to settlement) in the 2010 cohort had been granted settlement 5 years after their initial visa had been granted; a further 14% (10,255) still had valid leave to remain in the UK
Indian nationals were issued the largest proportion (40% of the total) of skilled work visas in the 2010 cohort and, of these skilled Indian nationals, 32% had received settlement after 5 years, while a further 12% still had valid leave to remain in the UK
of those granted settlement in the 2015 cohort:
- around two-fifths had originally been issued a visa that could potentially directly lead to settlement (family or skilled work) and a further 8% were granted settlement on arrival
- half originally entered on a temporary route and later switched onto a route that led to permanent settlement, over half of whom had originally entered the UK as students (29% of the total granted settlement in 2015, more than double the proportion in 2009 when this series began)
Notes for: Immigration to the UK estimated to be 596,000
There are a range of reasons why LTIM and IPS figures for long-term migrants for study may be different from Home Office figures for study visas granted. For example, the Home Office visa statistics include short-term students migrating to the UK for less than 1 year, but only record students who are non-EEA nationals. LTIM estimates are based on a sample survey and therefore may fluctuate due to sampling variability.
Note that this figure relates to Certificates of Acceptance to Study (CAS) data used in the application process for a visa, which will differ from the number of study visas granted, although the number is likely to be similar as sponsors are expected to only issue CAS to legitimate students.
Much more detail can be found in the Home Office Immigration Statistics User Guide.
6. Emigration from the UK estimated to be 323,000
The emigration estimate for the year ending (YE) September 2016 was 323,000 with a confidence interval of +/-22,000, compared with 297,000 (+/-19,000) in YE September 2015. This difference was not statistically significant.
Recent levels of emigration have remained fairly stable, having fallen from the highest estimate of 427,000 in 2008.
In YE September 2016, work-related reasons remain by far the most common reason1 given for emigration, accounting for just over half (167,000) of emigrants, the same as the previous year. There was a statistically significant increase in the estimated number of those going home to live, from 25,000 to 48,000.
Figure 8: Emigration from the UK by citizenship, 2006 to 2016 (year ending September 2016)
Source: Office for National Statistics, Long-Term International Migration
Notes:
- Figures for 2016 are provisional. In this chart provisional estimates are shown separated by a break in the series.
- This chart is not consistent with the total revised net migration estimates as shown in Figure 1. Please see guidance note for further information.
Download this chart Figure 8: Emigration from the UK by citizenship, 2006 to 2016 (year ending September 2016)
Image .csv .xlsBritish citizens
In YE September 2016, 128,000 British citizens emigrated from the UK (40% of all emigrants), the same as the previous year.
International Passenger Survey (IPS) data show that of 115,000 British emigrants, reasons given for emigration were:
work-related reasons (57,000 or 50%), of whom 79% had a definite job to go to
accompanying or joining others (14,000)
formal study (7,000)
“other” and “not stated” (36,000)
EU citizens
The estimated number of EU citizens emigrating from the UK was 103,000 in YE September 2016, compared with 85,000 the previous year. This difference was not statistically significant. An estimated 39,000 EU8 citizens emigrated, a statistically significant increase of 12,000 compared with the previous year.
IPS data show that of the EU emigrants, 43% left for work-related reasons.
Of the 48,000 emigrants who, in the IPS, stated their main reason for emigration as “going home to live”, just over three-quarters (37,000) were EU citizens, which was a statistically significant increase compared with the previous year (18,000). This was partly driven by a statistically significant rise in the number of EU8 citizens going home to live compared with the previous year (from 8,000 to 19,000).
Non-EU citizens
The latest estimates show 93,000 non-EU citizens emigrated from the UK compared with 84,000 the previous year. This difference was not statistically significant. Of these, 39,000 were from the “Rest of the World” grouping (Africa, the Americas and Oceania), a statistically significant rise of 11,000 compared with the previous year.
Of all non-EU emigrants, 69% were emigrating for work-related reasons.
Emigration from the UK by previous main reason for immigration
The IPS asks emigrants about their main reason for originally coming to the UK. Of the 300,000 individuals shown in IPS data to be emigrating from the UK, 87,000 (29%) were “new” long-term emigrants (individuals who had not previously lived away from the UK for 12 months or more) and 212,000 (71%) were long-term emigrants who had formerly immigrated to the UK, which was a statistically significant increase of 26,000 compared with the previous year (186,000).
This included 95,000 who originally came to work in the UK and, of these 62,000 (65%) were EU citizens, a significant increase of 16,000 compared with the previous year (46,000). Within this EU grouping, 29,000 were EU8 citizens, a statistically significant increase of 13,000 compared with the previous year (16,000). Of the 62,000 EU citizens who emigrated having originally arrived to work, 49,000 (79%) had arrived with a definite job to go to, a statistically significant increase of 19,000 compared with the previous year.
There were also an estimated 62,000 who left the UK who had originally arrived to study.
More detailed estimates derived from this IPS question can be found in Table 4a and Table 4b in the accompanying datasets for this MSQR release.
An Office for National Statistics (ONS) report, International student migration – what do the statistics tell us, explores the reasons for the apparent gap between student immigrants and emigrants who previously arrived to study and a further progress report was published on 16 November, Update on international student migration statistics: November 2016.
Notes for: Emigration from the UK estimated to be 323,000
- Note that for former immigrants, the reason a person emigrates may not reflect their original reason for immigration. For more, see the “Emigration from the UK by previous main reason for immigration” section.
7. Where can I find more information?
There is a lot more detail within the charts and tables found in the accompanying download of provisional datasets alongside this report, including breakdowns of the statistics by main reason and by citizenship grouping. Definitions of the main terms used in the report can be found at the end of the report, along with links to find more information, and a note on statistical uncertainty.
If you are new to migration statistics, you might find it helpful to read our “International Migration Statistics First Time User Guide, Glossary and List of Products”. This contains information on other measures of international migration, for example:
Short-Term International Migration estimates for England and Wales, year ending June 2014 were published in May 2016 and cover migrants coming to or leaving the UK for 1 to 12 months and 3 to 12 months
Population of the UK by Country of Birth and Nationality, 2015 was published in August 2016 and covers the number of people resident in households in the UK by country of birth and nationality in 2015
A report was published 27 January which explores what statistics are available to estimate the number of British citizens living in the EU
For more detailed information on how our migration statistics are used, along with information on their strengths and limitations, please see the articles Quality and Methodology Information for Long-Term International Migration (LTIM) releases and Long-Term International Migration Estimates Methodology, as well as the Note on Sampling and Uncertainty section later in this bulletin.
There are many sources of official statistics that measure the number and characteristics of international migration into and out of the UK (flows) as well as the migrants who have settled in the UK (stocks). Taken together they provide a rich picture of migration in the UK. It is important to understand that these sources measure different things: some measure flows, some measure stocks, some measure workers, some students and some only measure the characteristics of those migrating from outside the EU. Each source is valuable in its own right in measuring particular aspects of international migration.
We have produced several notes this year looking at how some of these sources differ such as: the note on International Student Migration published 22 January 2016; IPS and National Insurance number reconciliation note published 12 May 2016; and the IPS and Annual Population Survey (APS) comparison paper published 1 December 2016, A separate summary note takes some of the main themes from the notes to help users understand that the differences between the sources are driven by differences in definitions and coverage.
There is considerable interest in migration statistics both nationally and internationally, and they are a fundamental component of our mid-year population estimates. These are used for planning and service delivery, resource allocation and managing the economy. Additionally, these statistics are reported regularly by the media to assess the government’s progress against its ambition to reduce levels of net migration to sustainable levels.
If you would like to subscribe to our newsletter, please send an email to pop.info@ons.gov.uk with the subject title “Subscribe to ONS Population Statistics Newsletter”, or you can also follow our statistician @PaulVickers_ONS on Twitter for the latest population statistics news and updates and join in the conversation.
Back to table of contents8. Understanding the main terms used in this report
Here is a quick overview of 6 of the main terms used throughout the report. More can be found in our First Time User Guide, Glossary and List of Products article.
Immigration
This refers to those people coming into the UK. Our estimates sometimes refer to EU or non-EU immigrants, but the estimates of total immigration include EU, non-EU AND British immigrants.
Emigration
This refers to those people leaving the UK and, as with immigration, totals include EU, non-EU AND British emigrants.
Net migration
Net migration is the difference between immigration and emigration. If immigration is higher than emigration, meaning more people come to the UK than leave the UK, then net migration will be a positive (+) number. If more people leave the UK than come to the UK then net migration will be a negative (-) number.
EU2
The EU2 are the 2 countries that joined the EU on 1 January 2007: Bulgaria and Romania. Between 2007 and 2013, in the first 12 months of stay, working Bulgarian and Romanian nationals were subject to restrictions on the types of work they could undertake in the UK. These restrictions were lifted on 1 January 2014.
EU8
The EU8 are the 8 central and eastern European countries that joined the EU on 1 May 2004: Czech Republic, Estonia, Hungary, Latvia, Lithuania, Poland, Slovakia and Slovenia. The EU8 does not include the 2 other countries that joined on that date: Cyprus and Malta.
EU15
The EU15 consists of Austria, Belgium, Denmark, Finland, France, Germany, Greece, Italy, Luxembourg, Netherlands, Portugal, Republic of Ireland, Spain, Sweden and the UK. However, our EU15 statistics exclude British citizens (and as a result in some other publications the EU15 are referred to as the EU14).
Back to table of contents9. A note on sampling and uncertainty
Surveys gather information from a sample of people from a population. Using the International Passenger Survey (IPS) as an example, the population is passengers travelling through the main entry and exit points from the UK including airports, seaports and the Channel Tunnel. The estimates produced are based on only one of a number of possible samples that could have been drawn at a given point in time. Each of these possible samples would produce an estimated number of migrants. These may be different from the true value that would have been obtained if it were possible to ask everyone passing through about their migration intentions. This is known as sampling variability.
The published estimate is based upon the single sample that was taken and is the best estimate of the true value based on the data collected. However, to account for sampling variability, the estimates we publish include a “95% confidence interval”.
The confidence interval is a measure of the uncertainty around the estimate. Confidence intervals become larger (meaning there is more uncertainty) for more detailed estimates (such as citizenship by reason for migration). This is because the number of people in the sample who have these specific characteristics (for example, EU8 citizens arriving to study) is smaller than the number of people sampled in higher level categories (such as the total number of EU citizens arriving to study). Where possible, it is better to use the highest level breakdown of data available.
We use the widely accepted 95% confidence interval, meaning that over many sampling repetitions under the same conditions, we would expect the confidence interval to contain the true value 95 times out of 100. Equivalently, we can say that there would be a 1 in 20 chance that the true value would lie outside of the range of the 95% confidence interval.
Estimates from a survey could change from one period to the next simply due to sampling variability. In other words, the change may be due to which individuals were selected to answer the survey, and may not represent any real-world change in migration patterns.
Statistical tests can be used to determine whether any increases or decreases that we see in the estimates could be due to chance, or whether they are likely to represent a real change in migration patterns. If the tests show that the changes are unlikely to have occurred through chance alone, and are likely to reflect a real change, then the change is described as being “statistically significant”. The usual standard is to carry out these tests at the 5% level of statistical significance. This means that in 1 out of 20 differences identified as statistically significant, the difference may not be the result of a real change.
For information on the accuracy of these statistics, comparing different data sources, and the difference between provisional and final figures, please see the “MSQR Information for Users”.
Revisions to net migration estimates in light of the 2011 Census
In April 2014, we published a report examining the quality of international migration statistics between 2001 and 2011, using the results of the 2011 Census. A main finding of the report was that, over the 10-year period, annual net migration estimates were a total of 346,000 lower than total net migration implied by the 2011 Census. However, the report also showed that the quality of international migration estimates improved following changes made to the IPS in 2009.
Within the report, we published a revised series of net migration estimates for the UK. Published tables have been updated on our website to include the revised estimates. The report, a summary and guidance on how to use these revised figures are available on our website. You should be aware that no revisions were made to separate immigration and emigration estimates at the time the net migration estimates were revised – ONS analysis of the differences between the 2011 Census and population estimates suggest immigration figures could have been higher in the mid-2000s as a result of migration from eastern Europe.
Back to table of contents10. Future releases
25 May 2017 – for the year ending December 2016
24 August 2017 – for the year ending March 2017
30 November 2017 – for the year ending June 2017 and final estimates for 2016
11. Quality and methodology
The Long-Term International Migration Quality and Methodology Information document contains important information on:
the strengths and limitations of the data and how it compares with related data
users and uses of the data
how the output was created
the quality of the output including the accuracy of the data