1. Introduction
1.1 The Office for National Statistics (ONS) is committed to providing the right information to inform public and policy debate, as set out in its Better Statistics, Better Decisions strategy. International migration is a topic of considerable debate and there is a high demand for trusted data and analysis. We believe that ONS can be more helpful by making better use of data sources across government and this article sets out our ambition on how we want to make this happen.
1.2 Over the last 2 decades, there have been a number of changes1 in international migration2 patterns and a substantial increase in the level of net migration. A decade ago there was considerable interest in correctly estimating the migration flows from Eastern European countries following their accession to the EU. This led to many developments to migration statistics, including improvements to the International Passenger Survey (IPS)3 and the way that migration statistics were reported across government. There have also been improvements to other data sources, such as the census, the Labour Force Survey (LFS) and Annual Population Survey (APS) where additional questions have been included to help users understand more about migrants living in the UK.
1.3 Whilst these improvements have been widely welcomed, the landscape and demands for information have shifted in recent years and continue to shift. There is now much more interest in the characteristics of migrants who reside in the UK and the impact they have on the economy and society. There are sources of data that shed some light on this but these only go so far in meeting the needs of the public, media and policymakers. We have plans to improve the information that is currently available to understand migration but these do depend on cross-government collaboration and data sharing.
1.4 This article explains how we will meet some of these demands. We intend to address this in a 2-stage approach. The first stage focuses, in the short term, on using existing sources of information to provide indicative analysis on some of the high-priority questions such as: student migration; the impact of migration on the economy and labour market; the services that migrants use; and the benefits they may claim. In the long term we will make the best use of data (administrative data, survey data and census data) held across government. Analysis of these data will provide fuller and more complete answers to inform debate and contribute to policymaking, especially as the UK enters negotiations on its departure from the EU. This will require working and collaborating with statistical colleagues and other analysts across government to see what can be achieved quickly. We will also need to work with them to plan how to realise our longer-term goals.
Notes for: Introduction
For example, non-EU immigration increased sharply in the late 1990s; immigration from Eastern European countries increased in the years following accession in 2004; in 2010, David Cameron announced his aim to reduce net migration to the tens of thousands; non-EU student migration peaked around 2011; Bulgaria and Romanian nationals had working restrictions lifted in 2014; EU immigration has doubled since 2012; and there has been increasing interest in changing patterns in migration, such as short-term and circular migration, since they also contribute to the economy and use services.
“International migration” is used to describe the movement of people into and out of the UK, excluding visitors. Long-term international migration refers to people who change their country of residence for 1 year or more. Short-term migration refers to people who change their country of residence for 1 to 12 months. References to “migration” throughout the rest of this article are to be interpreted as international migration.
See Annex 1.
2. Meeting this demand (current)
2.1 A range of official statistics are available to help Parliamentarians, policymakers and the public understand trends in migration. These include survey estimates, census data and data from administrative sources which measure different aspects of migration. While no single data source alone provides a full account of migration in the UK, collectively these sources provide useful evidence about international migration to and from the UK.
Information from the International Passenger Survey (IPS) provides a comprehensive picture of the number and characteristics of those entering and leaving the country on both a short-term and long-term basis. This is particularly useful for measuring the impact that international migration has on population growth. The IPS along with adjustments for Irish flows, asylum seekers and people who change their intentions forms the basis of our Long-Term International Migration (LTIM) figures.
Home Office visa data provides information on flows of people from outside the EU.
Department for Work and Pensions (DWP) data from those adults registering for National Insurance numbers (NINos) provides an indication of migration.
The Annual Population Survey and the Labour Force Survey (APS and LFS) help provide some information on the stock of resident migrants and their characteristics, especially at the national level on the skills, industry or occupation groups of migrants.
The 2011 Census has provided information on the characteristics of the migrant population that was previously not available.
Data on overseas students are available from the Higher Education Statistics Agency (HESA).
2.2 However, these sources measure different populations and there are good reasons why they differ. They also don’t meet all the recent demands for information on the characteristics of migrants in the population (rather than those flowing into and out of the population), the impact of international migration on the economy both nationally and locally, and migrants’ consumption of services and contribution to society.
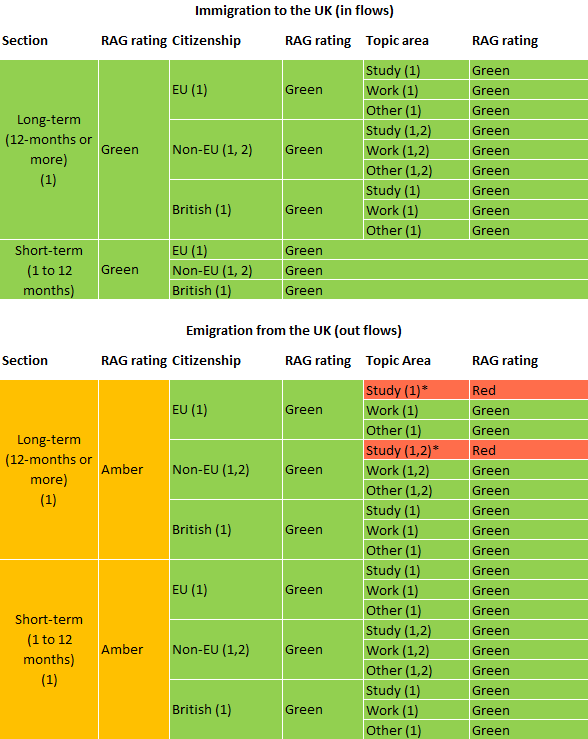
Figure 1: ONS view on how well current data sources can provide data and analysis on different aspects of international migration flows
Notes:
Current Data Sources (shown in brackets)
(1) ONS: LTIM and IPS; (2) Home Office: Visa statistics
* Although the IPS provides robust estimates of those emigrating to study, there is still additional analysis underway to understand more fully the IPS figures on those EU and non-EU citizens who are emigrating and who originally immigrated to the UK for study purposes.
An accessible version of the image is available as an Excel download (.xls).
Download this image Figure 1: ONS view on how well current data sources can provide data and analysis on different aspects of international migration flows
.png (46.1 kB) .xls (33.8 kB)
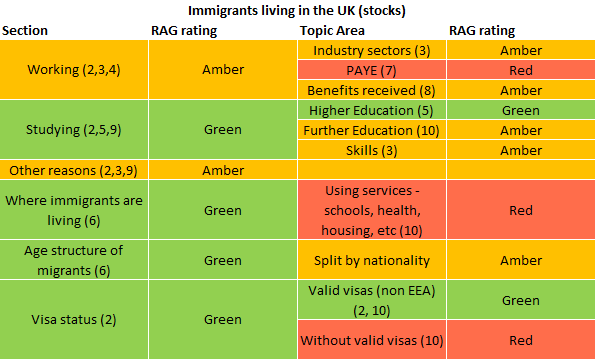
Figure 2: ONS view on how well current data sources can provide data and analysis on different aspects of international migration stocks
Notes:
Current Data Sources (shown in brackets)
(2) Home Office: Visa statistics; (3) ONS: Labour Force Survey; (4) DWP: NINo statistics; (5) Higher Education Statistics Agency; (6) ONS: Population Estimates; (7) HMRC: PAYE system; (8) DWP: Benefits and Income Data; (9) ONS: Census; (10) No data available
An accessible version of the image is available as an Excel download (.xls).
Download this image Figure 2: ONS view on how well current data sources can provide data and analysis on different aspects of international migration stocks
.png (24.7 kB) .xls (22.0 kB)
In Figures 1 and 2 the green boxes indicate our view at this point in time on those areas where we have relatively robust information. The amber boxes indicate where we feel we have only partial information. The red ones indicate where we have little or no information or where more work is required to assess their reliability. Discussions are ongoing with government departments on how well different data sources can be used to measure these different aspects of migration and how well this is reflected in the chart.
2.3 One of the significant current challenges is to understand what former international student immigrants do when they complete their studies. This is reflected by the red boxes in the right-hand column. The IPS figures of international students immigrating to the UK are consistently higher than the IPS figures of former international students emigrating. We are working collaboratively with other government departments to investigate what other sources can tell us. This is a complex area which will require analysis of several datasets, drawing on the expertise of data providers across government. We will publish an article by mid-2017 giving a further update of progress in this area.
2.4 By mid-2017 we will work with colleagues across government to investigate what existing sources show on the impact of international migration in the UK. The main areas we will focus on are:
student migration, including a new online student survey
impacts of migration on the labour market
impacts of migration on housing
local impacts of migration on population growth
If this important collaborative work produces useful results, we will agree publication of these as soon as possible, with the aim of publishing outputs on each these topics by mid-2017.
Back to table of contents3. Longer-term goals
3.1 The real power of using administrative data could be realised through our ability to securely link different data sources together. This will provide a much richer combined data source where we can drill deeper into the data to provide more detailed analysis and at smaller levels of geography. We plan to work with data providers to build up a much better picture of a migrant’s “journey” such as when they immigrated, their initial occupation or studies, further skills and occupations, the areas in which they have lived and possibly interactions with services such as healthcare, housing or education.
3.2 We need much better access to datasets already held across government to do this work, and generally to support better statistics for better decision-making. The Digital Economy Bill, presently before Parliament, provides the basis for this so that there is a clear legal gateway for departments to share their data with us for statistical purposes. For example, a paper published by the National Statistician in March 2016 included a case study about the importance of new legislation supporting the delivery of better statistics and analysis relating to international student migration.
3.3 We have the expertise to securely hold data and are currently developing further systems to hold data in a secure setting so that linking can take place on an individual record basis. Outputs will be produced on an aggregate level so that the confidentiality of individuals is not compromised.
3.4 Over the next couple of years we will be working with data providers to set in place this linking and analysis to meet the demands of the many audiences, as shown in Annex 2. At the end of 2018, we would hope that many areas where there are gaps will be filled and many of the boxes currently red or amber will be turned to green as shown in Figures 3 and 4.
Figure 3: ONS view on how well future use of data sources could meet the needs for data and analysis on different aspects of international migration flows

Notes:
Current Data Sources (shown in brackets)
(1) ONS: LTIM and IPS; (2) Home Office: Visa statistics; (11) Securely linked data
An accessible version of the image is available as an Excel download (.xls).
Download this image Figure 3: ONS view on how well future use of data sources could meet the needs for data and analysis on different aspects of international migration flows
.png (39.7 kB) .xls (24.1 kB)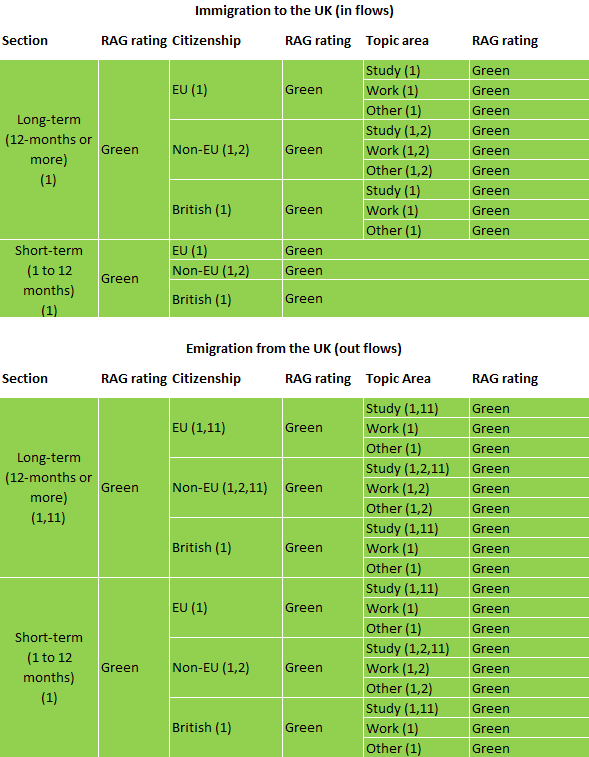
Figure 4: ONS view on how well future use of data sources could meet the needs for data and analysis on different aspects of international migration stocks

Notes:
Current Data Sources (shown in brackets)
(2) Home Office: Visa statistics; (3) ONS: Labour Force Survey; (4) DWP: NINo statistics; (5) Higher Education Statistics Agency; (6) ONS: Population Estimates; (7) HMRC: PAYE system; (8) DWP: Benefits and Income Data; (9) ONS: Census; (10) No data available; (11) Securely linked data
An accessible version of the image is available as an Excel download (.xls).
Download this image Figure 4: ONS view on how well future use of data sources could meet the needs for data and analysis on different aspects of international migration stocks
.png (22.0 kB) .xls (21.0 kB)
4. Conclusion
4.1 In summary, there is growing demand for information on international migration in terms of overall numbers and detailed information on its impact to inform public and policy debate. Current data sources can only provide a partial picture and while work is taking place to make better use of existing sources, there will be substantial value in securely linking different data sources and pooling expertise across the Government Statistical Service to provide a richer evidence base. We will continue to collaborate with data owners and keep audiences informed as progress is made.
Back to table of contents5. Annex 1 – Improvements to the International Passenger Survey, 2004 to 2016
A number of quality improvements have been made to the International Passenger Survey (IPS) to improve its collection of migration data. The information below presents a timeline of these improvements. Improvements have also been made to other sources of migration data that are not reflected here.
2004 – New questions added to identify “visitor switchers”
Visitor switchers are travellers who intend to stay in or leave the UK for less than 12 months, but actually stay for more than 12 months. New IPS questions were introduced in 2004 to provide a more informed indication of how many visitors will change their intentions and become migrants. Previous visitor switcher estimates were based firstly on visa data supplied by the Home Office, then on fixed proportions calculated by us, which would not account for changes in propensity to switch over time.
2006 – Port Survey Review
In 2006, an Inter-Departmental Task Force on Migration published recommendations which led to the Port Survey Review (PSR), through which a number of improvements were made to the IPS between 2007 and 2009.
January 2007 – Migration filter shifts for emigration
Migrant filter shifts are used to quickly identify if a passenger is migrating and allow more migrants to be sampled by the IPS interviewers. In January 2007, migration filter shifts were introduced for departing passengers, in order to increase the number of emigrant contacts. There was a three-fold increase in the number of emigrant contacts on the IPS between 2006 and 2007.
April 2008 – Expansion of interviewing locations
Following the Port Survey Review in 2006, migration filter shifts were established at Luton, Stansted and Manchester, to increase the number of migrant contacts and make the sample less skewed towards London Heathrow. All migration filter shifts now included short-term migrants, where previously only long-term migrants had been included. Additional shifts were introduced for the Dover-Calais and Dover-Dunkirk ferry crossings, and for the Eurotunnel shuttle between Cheriton and Coquelles. Additional ordinary shifts were also introduced at some other airports (such as Birmingham).
In addition, IPS interviewing was introduced at Heathrow Terminal 5, Southampton, Bournemouth and Robin Hood (Doncaster) airports for the first time. This was to improve the reliability of estimates of migrants known to predominately use other routes (for example, regional airports), notably those from the EU accession countries.
2008 – Change of IPS calibration
Many migrants responding to the IPS may not know precisely where they will settle. They are likely to say they will live in 1 area (often London), before actually settling in another part of the country. In 2008, we began to use the Labour Force Survey (LFS) distribution of recent migrants to calibrate IPS inflow estimates by region. These changes reduced immigration estimates for London and increased estimates for other regions.
2009 – Survey redesign
In 2009, the IPS was redesigned so that the primary emphasis is on identifying migrants, with a sub-sample of these contacts being interviewed for balance of payments and travel and tourism purposes. The sampling interval was set to be as many as possible, for example, higher when a port is busier.
July 2009 – Additional ports added to sample
In July 2009, Belfast International airport, Aberdeen airport and the Portsmouth-Bilbao sea route were added to the IPS sample design. A common, more sophisticated weighting method was also introduced across all ports and routes. The new approach followed the same principles previously applied only to “main” airports. Changes were also made to the sample design and data processing, making the survey more statistically robust, particularly for international migrants not entering the country through Heathrow.
January 2012 – Previous reason for immigration
In January 2012, new questions were added to the IPS asking those emigrating from the UK why they had previously immigrated to the UK. This enables the identification of international students who are leaving the UK.
August 2012 – Publishing confidence intervals
In August 2012, 95% confidence intervals for IPS estimates were published for the first time, allowing users to assess the level of variation around the estimates and assess whether changes between 2 estimates are statistically significant.
2015 – Sample optimisation exercise
In 2015, an IPS sample optimisation exercise was carried out to ensure that the IPS was operating as efficiently as possible. Although the exercise sought to make savings, safeguarding the quality of IPS-based migration estimates was a priority. Following the exercise, migration filter shifts were reintroduced in some ports, which will slightly enhance the precision of IPS migration estimates.
January 2016 – Additional questions added
In January 2016, additional questions were added to the IPS, asking for further information about the type of visa non-EU migrants were using to enter the UK. This information will be used to compare IPS estimates with visa statistics from the Home Office.
Back to table of contents6. Annex 2 – Examples of what questions we want to answer and how we intend to answer them
Examples of what questions we want to answer and how we intend to answer them
| Question | What we would like to do | |
|---|---|---|
| Are we measuring international migration accurately? | 1) Analyse Home Office exit check data to better understand non-EU departures from the UK. This will not tell us how many are long-term emigrants, but it will provide information by some characteristics that would be useful to compare with the International Passenger Survey. | |
| 2) Linking Department for Work and Pensions (DWP) and HM Revenue and Customs (HMRC) data to Home Office data could tell us when migrant workers leave the UK. | ||
| 3) HMRC data could provide a useful source to identify migration patterns of workers in the UK, for example, circular migration (those who alternate between periods working in the UK and abroad within the same year). | ||
| How many international students are there and what do they do after their studies? How do students contribute to the UK labour market and economy? | Link Higher Education Statistics Agency (HESA) data to Home Office data which measures all passenger flows into and out of the UK. | |
| This could tell us how many international students completing their courses are departing the UK (subject to matching quality). The Home Office's "Migrant Journey" data provides information on non-EU students and the paths they take through the visa system. | ||
| Link HESA data to HMRC data. This will tell us how many students are working in the UK during or after their studies. | ||
| Investigate what linking Home Office exit check data to HESA will show for non-EU students, how many depart after their courses and how this relates to visa durations. | ||
| UK exports for international study is already available. | ||
| How has international migration impacted on the UK economy? | By analysing HMRC and DWP datasets we can ascertain which non-UK employed nationals are paying tax and claiming benefits. | |
| Through combining DWP with HMRC PAYE and Self Assessment it would be possible to see who is self-employed or employed, claiming benefits and the dependency structure. This would provide an economic picture of migrant workers and their families. A link to HESA data would provide a profile on working students and whether working was preceded by UK study. | ||
| What is the impact of immigration on the labour market? Which sectors have the largest proportions of migrant workers in the UK? Is there a gap between the skills immigrants have and their occupations? | Matched DWP and HMRC data can tell us where migrant workers are for those in employment or claiming benefit, their nationality at registration and (if linked with HMRC data, including Self Assessment), the sectors they work in, how much they earn, benefits claimed and taxes paid. | |
| The Labour Force Survey (LFS) can provide useful analysis where sample sizes are suitable (for example, for areas with large international populations) and other sources will build upon information collected from the LFS. | ||
| What is the impact of international migration on the health service, including emergency care and midwifery services? What does this cost the NHS? How many healthcare workers are non-UK nationals? | Fully use available data from the Patient Register (numbers of new GP registrations) and births to non-UK born mothers. Linking health data, such as Hospital Episode data to the 2011 Census could provide useful information on the characteristics of immigrants and which health services they interact with. | |
| Analysis of immigrants working in the health sector could be based on LFS estimates of non-UK national workers in the health industry and HMRC data on the numbers of migrant workers in the health sector. | ||
| How many migrant children require school places? How many non-UK nationals work in the education sector? | Analyse the 2016 to 2017 School Census (it will include nationality and country of birth for the first time). | |
| The LFS, DWP and HMRC sources can identify how many non-UK nationals work in the education sector. | ||
| DWP benefits data would provide a picture of how many dependents are associated with migrant adults who are claiming benefit. | ||
| How many non-UK nationals are living in social housing? How have areas affected by high levels of immigration coped with the housing demand? | Analyse the census, Annual Population Survey and social housing data to identify which local authorities have experienced the greatest changes in international migration. Sources are unlikely to be robust for small-area estimates. |