Table of contents
- Main points
- Latest indicators at a glance
- UK spending on debit and credit cards
- Business impact of the coronavirus
- Social impact of the coronavirus
- Shipping
- Value Added Tax returns
- Footfall
- Company incorporations and voluntary dissolution applications
- Online job adverts
- Weekly online food and drink basket
- Roads and traffic camera data
- Data
- Glossary
- Measuring the data
- Strengths and limitations
- Related links
1. Main points
- According to the indicator derived from the Bank of England’s Clearing House Automated Payment System (CHAPS) data, aggregate debit and credit card purchases increased by 8 percentage points from the previous week to 24% below their February 2020 average, with rises in all four individual category levels. See Section 3.
- According to the Business Impact of Coronavirus (COVID-19) Survey (BICS), 18% of the workforce of all UK businesses were on furlough leave in Wave 23, similar to 17% in the previous wave but considerably lower than during the first national lockdown at 31% in early June 2020. See Section 4.
- According to the latest Opinions and Lifestyle Survey (week ending 7 February 2021), the proportion of working adults in Great Britain who in the last seven days travelled to work (either exclusively or in combination with working from home) remained similar to the previous week at 47%. See Section 5.
- According to exactEarth, there was an average of 275 daily ship visits in the week ending 7 February 2021, a decrease from the previous week (290) and lower than the same period a year ago (389), but still a return to pre-Christmas levels. See Section 6.
- According to Value Added Tax (VAT) returns, in January 2021 there were 20,510 new VAT reporters, which is above the level in January 2020 of 20,190 but below the 2015 to 2019 average of 20,908. See Section 7.
- According to VAT returns, in December 2020, slightly more UK firms reported decreasing turnover than increasing turnover when compared with November 2020. See Section 7.
- According to Springboard, retail footfall remains low when compared with its level on the same day of last year, with Greater London, the East Midlands and Scotland generally seeing the weakest daily footfall volumes compared with other regions in the latest week. See Section 8.
- According to Companies House, in the week to 5 February 2021, there were 5,659 voluntary dissolution applications; this is lower than the level recorded in the same week of 2020 but, for the first time this year, higher than the same period in 2019. See Section 9.
- According to Adzuna, in the week ending 5 February 2021, the volume of UK online job adverts increased slightly by 2 percentage points to 80% of the level seen in the same week last year. See Section 10.
- The overall price of items in the food and drink basket was broadly unchanged, with the “milk, cheese and eggs” category increasing by 0.7% compared with the previous week. See Section 11.
- According to Department for Transport (DfT) non-seasonally adjusted road traffic data, on Monday 8 February 2021, the volume of all motor vehicle traffic decreased by 6 percentage points from the previous week to 60% of the levels seen on the equivalent day of the first week of February last year; this was driven by falls in all three categories of motor vehicle traffic. See Section 12.
Results presented throughout this bulletin are experimental and may be subject to revision.
2. Latest indicators at a glance
Embed code
3. UK spending on debit and credit cards
These data series are experimental faster indicators for estimating UK spending on credit and debit cards. They track the daily Clearing House Automated Payment System (CHAPS) payments made by credit and debit card payment processors to around 100 major UK retail corporates. These payments are the proceeds of recent credit and debit card transactions made by customers at their stores, both via physical and via online platforms.
More information on the indicator is provided in the accompanying methodology article.
Companies are allocated to one of four categories based on their primary business:
- “staples” refers to companies that sell essential goods that households need to purchase, such as food and utilities
- “work-related” refers to companies providing public transport or selling petrol
- “delayable” refers to companies selling goods whose purchase could be delayed, such as clothing or furnishings
- “social” refers to spending on travel and eating out
Figure 1: In the week to 4 February 2021, the aggregate CHAPS-based indicator of debit and credit card purchases increased by 8 percentage points to 24% below its February 2020 average
Index February 2020 = 100, percentage change on a backward looking seven-day rolling average,13 January 2020 to 4 February 2021, non-seasonally adjusted, nominal prices
Source: Office for National Statistics and Bank of England calculations
Notes:
- Users should note the daily payment data is the sum of card transactions processed up to the previous working day, so there is slight time lag when compared with real-life events on the chart.
Download this chart Figure 1: In the week to 4 February 2021, the aggregate CHAPS-based indicator of debit and credit card purchases increased by 8 percentage points to 24% below its February 2020 average
Image .csv .xlsFigure 1 shows changes in the value of CHAPS payments received by large UK corporates from their credit and debit card processors, “merchant acquirers”. In the week to 4 February 2021, the CHAPS-based indicator of credit and debit card purchases in aggregate increased 8 percentage points from the previous week to 24% below its February 2020 average. This was driven by rises in all four individual consumption category levels since the previous week. In the latest week, card spending on “staples”, which normally rises around the turn of the month, was 13% higher than the February 2020 average. On the other hand, “delayable”, “social” and “work-related” purchases were 40%, 43% and 38% below average levels seen in February 2020, respectively.
The full data time series available for data on UK spending on debit and credit cards can be found in the accompanying dataset.
More about coronavirus
- Find the latest on coronavirus (COVID-19) in the UK.
- Explore the latest coronavirus data from the ONS and other sources.
- All ONS analysis, summarised in our coronavirus roundup.
- View all coronavirus data.
- Find out how we are working safely in our studies and surveys.
6. Shipping
These shipping indicators are based on counts of all vessels, and cargo and tanker vessels. As discussed in Faster indicators of UK economic activity: shipping, we expect the shipping indicators to be related to the import and export of goods.
Figure 3: There was an average of 275 daily ships visits in the week ending 7 February 2021, a decrease from the previous week (290) and lower than the same period a year ago (389)
Daily movements in shipping visits, UK, seasonally adjusted, 1 December 2019 to 7 February 2021
Source: exactEarth
Download this chart Figure 3: There was an average of 275 daily ships visits in the week ending 7 February 2021, a decrease from the previous week (290) and lower than the same period a year ago (389)
Image .csv .xlsIn the week ending 7 February 2021, the seven-day average of all daily shipping visits was 275, down from 290 the previous week. Despite this decline, shipping levels continue to show signs of a return to pre-Christmas levels since the low of 191 visits observed over the Christmas period. However, they remain at lower levels than the same period last year, with 389 visits recorded in the week ending 9 January 2020.
Figure 4: There was an average of 101 daily cargo ships visits in the week ending 7 February 2021, a marginal decrease on the previous week (102) and slightly lower than the same period a year ago (112)
Daily movements in shipping visits, UK, seasonally adjusted, 1 December 2019 to 7 February 2021
Source: exactEarth
Notes:
- The vertical lines indicate key events. In order, the events are: Storm Ciara; FCO advises against all non-essential international travel; Lockdown begins; UK international travel quarantine begins; travel corridors to 59 countries come into force; Storm Ellen; Storm Francis; Storm Alex; Storm Aiden.
- The number of visits for Hull are included in these data from 1 June onwards.
- The seasonally adjusted and trend estimates are estimated using a modified version of the seasonal adjustment method TRAMO-SEATS. More information is available in the Coronavirus and the latest indicators for the UK economy and society methodology.
- The seasonal adjustment method may be limited as this is a short time series.
- Daily and weekly shipping visits and unique visits are available by port in the dataset, along with non-seasonally adjusted aggregate series.
- The trend is now calculated as a rolling seven-day average of the number of daily ship and cargo ship visits.
- Users should note that a reduction in shipping activity has been observed over the Christmas periods in 2019 and 2020.
Download this chart Figure 4: There was an average of 101 daily cargo ships visits in the week ending 7 February 2021, a marginal decrease on the previous week (102) and slightly lower than the same period a year ago (112)
Image .csv .xlsThe seven-day average of daily cargo ship visits was 101 in the week ending 7 February 2021. This represented a marginal decrease from the previous week when there was an average of 102 visits. As with the headline ships data, the average number of daily cargo ship visits continues to show signs of a return to the levels seen before Christmas. However, it remains at a lower level than the same period last year, with 112 visits recorded in the same week of 2020.
Back to table of contents7. Value Added Tax returns
New reporters
The new reporters index measures the number of UK firms sending Value Added Tax (VAT) returns for the first time, which is related to the number of firm creations.
Figure 5: In January 2021, there were 20,510 new VAT reporters, which is above the level in January 2020, but below the 2015 to 2019 average
The number of new firm reporters, January 2015 to January 2021, non-seasonally adjusted, UK
Source: Her Majesty’s Revenue and Customs (HMRC)
Download this chart Figure 5: In January 2021, there were 20,510 new VAT reporters, which is above the level in January 2020, but below the 2015 to 2019 average
Image .csv .xlsIn January 2021, there were 20,510 new VAT reporters, an increase from 19,990 in December 2020. This is also higher than the number seen in January 2020 (20,190), but lies below the three-month average of Quarter 4 (Oct to Dec) 2020 (21,237) and the 2015 to 2019 longer-term average of 20,908.
Business turnover estimates
Turnover diffusion indices are an aggregate measure used to track whether the majority of firms are reporting an increase or decrease in turnover in their VAT returns. They are calculated as the percentage of firms with increasing turnover minus the percentage with decreasing turnover.
The heatmap in Figure 6 is a visual way of showing the VAT diffusion indices based on the standard deviation from their historical 2008 to 2019 average. Larger deviations are more darkly coloured, with red representing a negative change, and teal a positive change when compared with the previous period.
The Monthly estimate of gross domestic product (GDP) for December 2020 will be published on 12 February 2021. January 2021 estimates of Retail sales in Great Britain will be published on Friday 19 February 2021. It is important to note that the timely VAT indicators are not attempting to forecast or predict gross domestic product (GDP) or other headline economic statistics, and the indicators should not be interpreted in this way.
Figure 6: In December 2020, slightly more UK firms have reported decreasing turnover than increasing turnover when compared with the previous month
Heatmap of business turnover estimates, UK, diffusion index standard deviation from the mean, up to Quarter 4 (Oct to Dec) 2020 and December 2020. New reporters, UK, up to January 2021
Embed code
Source: Her Majesty’s Revenue and Customs (HMRC)
Notes
- Agri - Agriculture, forestry and fishing, All - All industries, SA - Seasonally adjusted, NSA - Not seasonally adjusted.
- All industries are unweighted: each firm contributing to the index has the same weight regardless of turnover, size or industry.
- The thresholds for the colours in the heatmap are based on standard deviations from the mean of the indicator between 2008 and 2019.
- Note the monthly turnover estimates are based on a small sample of around 35,000 firms reporting their turnover, so are subject to volatility.
- The average firm contributions by industry for the monthly (M2) turnover estimates using SIC 2007 are dominated by agriculture, forestry and fishing (A), followed by wholesale and retail (G) and construction (F). More information is available in the methodology article.
The month-on-month all-industry turnover estimate for December 2020 compared with November 2020 has decreased slightly by 0.2 standard deviations below its historical 2008 to 2019 average (white), with a diffusion index of negative 0.01, shown in Figure 6. Out of the 36,330 firms that reported monthly turnover in December 2020, around 400 more firms saw their turnover decrease than firms who saw their turnover increase.
Agriculture and construction each saw a small decrease between November and December 2020, with agriculture seeing a decrease of 0.3 standard deviations (white) at a diffusion index of negative 0.02. Services and production each saw a small increase over this period, with services increasing by 0.5 standard deviations above their historical average (light teal) at a diffusion index of 0.02.
The month-on-year ago all-industry turnover estimate for December 2020 compared with December 2019 is 0.4 (white) standard deviations above its historical average with a diffusion index of 0.07, also shown in Figure 6. This implies around 2,500 more businesses are seeing increasing turnover than decreasing turnover when compared with the same month a year ago.
Across all major industries (services, production, construction, agriculture), turnover estimates increased over this period, except for construction. Construction saw a decrease of 0.3 standard deviations (white) with a diffusion index of negative 0.02. Agriculture saw the largest increase over this period of 0.7 standard deviations above its historical average (light teal) with a diffusion index of 0.11.
Please note the monthly and quarterly diffusion indices can exhibit different trends as only a subset of firms contribute towards the monthly diffusion indices. Quarterly returns are allocated to the calendar quarter in which two or more of the months lie. For example, a quarterly return covering the period September 2020 to November 2020 will be allocated to Quarter 4 (Oct to Dec) 2020. At this stage of the quarterly data cycle, there is limited information about November 2020 feeding into the Quarter 4 2020 estimates.
For more information on how the quarterly reporting periods are derived, see VAT reporting periods in Section 2 of the VAT methodology article. The number of firms contributing towards each of the diffusion indices is published in the dataset.
Back to table of contents8. Footfall
National retail footfall
National footfall figures are supplied by Springboard, a provider of data on customer activity. They measure the following for overall UK retail footfall, as well as by high street, retail park, and shopping centre categories:
- daily retail footfall as a percentage of its level on the same day of the equivalent week of the previous year; for example, Sunday 31 January 2021 is compared with Sunday 2 February 2020
- total weekly retail footfall as a percentage of its level in the equivalent week of the prior year; for example, footfall in Week 5 of 2021 is compared with its level in Week 5 of 2020
- the percentage change in weekly footfall compared with the previous week; for example, Week 5 of 2021 is compared with Week 4 of 2021
More information on how these figures are compiled is available in the Coronavirus and the latest indicators for the UK economy and society methodology.
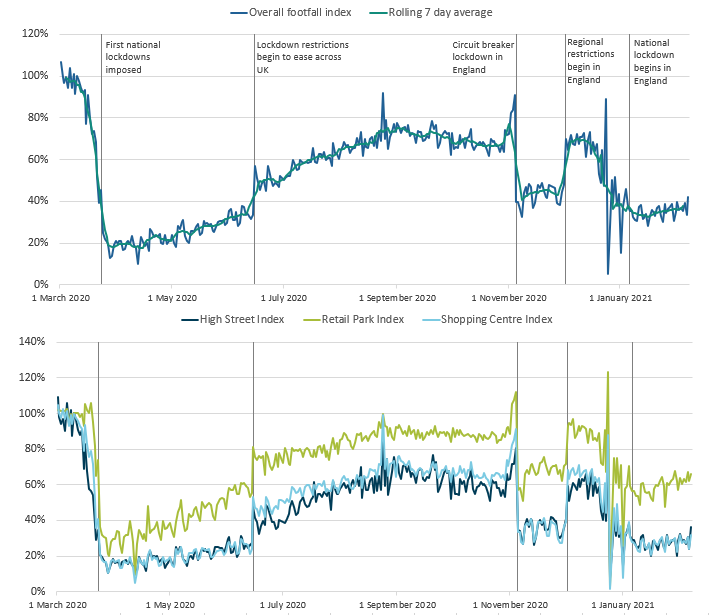
Figure 7: In the week ending 7 February 2021, overall retail footfall in the UK was at 36% of its level in the equivalent week of 2020
Volume of footfall, percentage compared with the same day the previous year, UK, 1 March 2020 to 31 January 2021
Source: Springboard and the Department for Business, Energy and Industrial Strategy
Notes:
- The spike on Monday 24 August 2020 was caused by the comparison with 26 August 2019, which was bank holiday Monday with good weather. The bank holiday that year was a week later, on 31 August 2020.
- The spikes on 23 December and 30 December 2020 are due to the year-on-year comparisons with 25 December 2019 and 1 January 2020 respectively, which were bank holidays.
Download this image Figure 7: In the week ending 7 February 2021, overall retail footfall in the UK was at 36% of its level in the equivalent week of 2020
.PNG (89.2 kB)
According to Springboard, in the week ending 7 February 2021, overall UK retail footfall was at 36% of its level compared with the equivalent week of 2020. This remains broadly unchanged from the week before and since the beginning of 2021.
Footfall at retail parks continues to outperform that of high streets and shopping centres, with the volume of footfall in week ending 7 February 2021 equivalent to 62% of its level in the equivalent period of 2020. The corresponding figures for high streets and shopping centres remain broadly unchanged from the previous week at 28% and 27% respectively.
Footfall increased in all types of retail locations between the weeks ending 31 January and 7 February 2021. The most pronounced rise was at high streets where weekly footfall increased by 9% compared with the week before, followed by retail parks where weekly footfall increased by 5%. Footfall at shopping centres increased by 4% compared with the week before.
Regional retail footfall
From this bulletin onwards we are reintroducing regional daily footfall graphs, created using figures supplied by Springboard. These show the volume of overall retail footfall compared with the same day of the equivalent week of the previous year, by UK region.
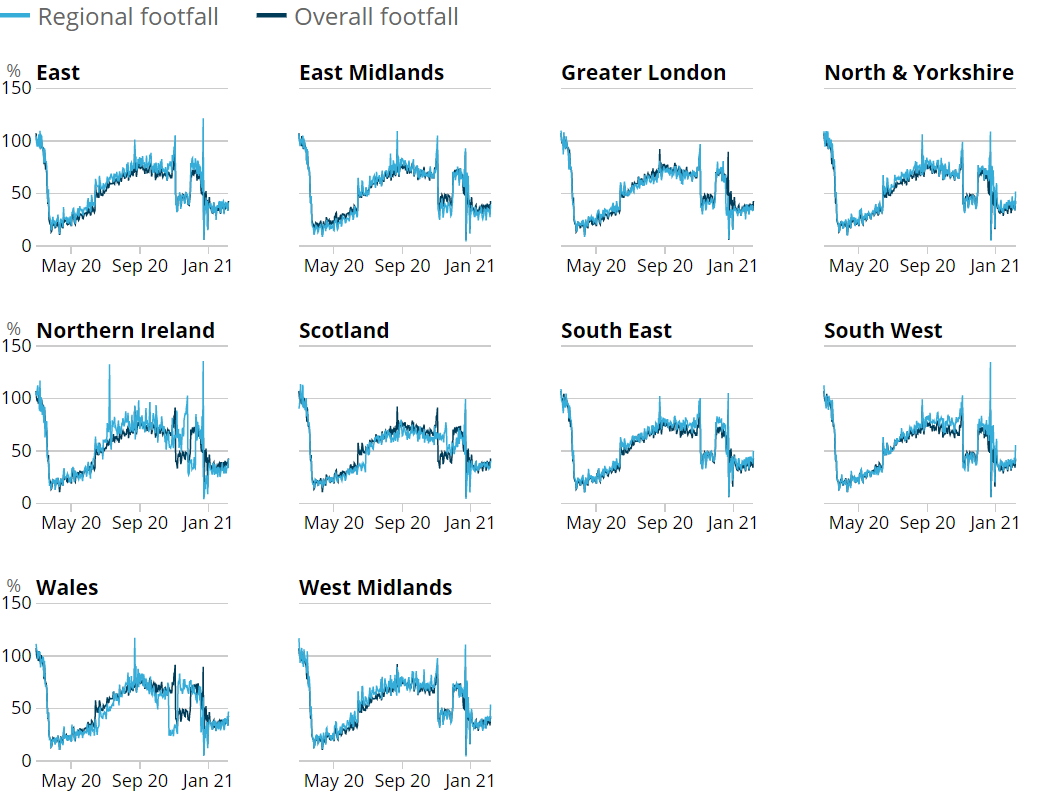
Figure 8: Retail footfall in all regions of the UK remains weak compared with its level in the same day of 2020
Volume of overall daily retail footfall, percentage of the level recorded on the same day of the equivalent week of the previous year, UK regions, 1 March 2020 to 7 February 2021
Source: Springboard and the Department for Business, Energy and Industrial Strategy
Download this image Figure 8: Retail footfall in all regions of the UK remains weak compared with its level in the same day of 2020
.PNG (100.8 kB)
Daily retail footfall in all regions of the UK remains substantially lower than its level in the same period of 2020. In the week ending 7 February 2021 compared to other regions Greater London, the East Midlands and Scotland have generally seen the weakest daily footfall volumes when compared with the equivalent day and week of 2020. In contrast in the same period footfall has been relatively stronger in the South East, South West and West Midlands, although still considerably lower than the levels seen on the equivalent day and week of last year.
For example, on Saturday 6 February 2021, retail footfall in the East Midlands was at 27% of its level recorded on the Saturday of the equivalent week of 2020, whereas the corresponding figure for the South East was 37%. Users should note that this comparison has been made using figures for Saturday as this is typically the busiest day of the week for retail locations.
Back to table of contents9. Company incorporations and voluntary dissolution applications
Incorporations
According to Companies House data, in the week to Friday 5 February 2021, there were 15,974 company incorporations in the UK, a slight decrease from 16,108 seen in the previous week. This is higher than the number of incorporations seen in the sixth week of both 2019 and 2020, when 14,355 and 14,902 were registered respectively. The number of company incorporations have remained at a broadly consistent level since the second week of this year and mark the continuation of a trend of higher incorporations since the second half of last year.
Figure 9: In the week to 5 February 2021, there were 15,974 company incorporations in the UK, a broadly consistent level to recent weeks
Total weekly company incorporations, UK, from week ending Friday 4 January 2019 to week ending Friday 5 February 2021
Source: Companies House and Office for National Statistics
Notes:
- Week 1 refers to the period week ending 4 January 2019, 3 January 2020 and 1 January 2021. Week 6 refers to the period week ending 8 February 2019, 7 February 2020 and 5 February 2021.
- The dips in December 2019 and December 2020 are explained by two bank holidays in the week ending 27 December 2019 and 25 December 2020.
- Weekly data are for week commencing Saturday to Friday, as incorporation requests received on Saturdays and Sundays are typically processed on subsequent weekdays. For more information, see the accompanying Companies House methodology page.
Download this chart Figure 9: In the week to 5 February 2021, there were 15,974 company incorporations in the UK, a broadly consistent level to recent weeks
Image .csv .xlsVoluntary dissolution applications
In the week to Friday 5 February 2021, there were 5,659 voluntary dissolution applications, a slight decrease from 5,667 recorded in the previous week. While this is still lower than the level recorded in Week 6 of 2020 (6,629), it is higher than the level recorded in the same week of 2019 when there were 5,588 voluntary dissolutions. This is the first time this year that the number of voluntary dissolution applications has been higher than the level seen in the same week of 2019.
Figure 10: In the week to Friday 5 February 2021, there were 5,659 voluntary dissolution applications, lower than the level recorded in the same week of 2020 but higher than the same period in 2019
Total weekly company voluntary dissolution applications, UK, from week ending Friday 4 January 2019 to week ending Friday 5 February 2021
Source: Companies House and Office for National Statistics
Notes:
- Week 1 refers to the period week ending 4 January 2019, 3 January 2020 and 1 January 2021. Week 6 refers to the period week ending 8 February 2019, 7 February 2020 and 5 February.
- The dips in December 2019 and December 2020 are explained by two bank holidays in the week ending 27 December 2019 and 25 December 2020.
- Weekly data are for week commencing Saturday to Friday, as incorporation requests received on Saturdays and Sundays are typically processed on subsequent weekdays. For more information, see the accompanying Companies House methodology page.
- Increased Companies House operational activity during week ending 8 November 2019 caused a spike in total weekly company voluntary dissolution applications. This data point should be treated with caution.
Download this chart Figure 10: In the week to Friday 5 February 2021, there were 5,659 voluntary dissolution applications, lower than the level recorded in the same week of 2020 but higher than the same period in 2019
Image .csv .xlsThe full data time series available for weekly company incorporations and voluntary dissolution applications can be found in the accompanying dataset.
Back to table of contents10. Online job adverts
These figures use job adverts provided by Adzuna, an online job search engine, and include experimental estimates of online job adverts by Adzuna category and by UK country and NUTS1 region. The number of job adverts over time is an indicator of the demand for labour. The Adzuna categories used do not correspond to Standard Industrial Classification (SIC) categories, so these values are not directly comparable with the Office for National Statistics (ONS) Vacancy Survey.
Figure 11: In the week ending 5 February 2021, the volume of UK online job adverts increased slightly by two percentage points to 80% of the level seen in the same week last year
Total weekly job adverts on Adzuna, UK 4 January 2019 to 5 February 2021, percentage compared with the same week in the previous year
Embed code
Notes:
- The observations were collected on a roughly weekly basis; however, before June 2020 they were not all observed at the same point in each week, leading to slightly irregular gaps between some observations.
- These series have a small number of missing weeks, mostly in late 2019, and the latest is in January 2020. These values have been imputed using linear interpolation. The data points that have been imputed are clearly marked in the dataset.
- Further category breakdowns are included in the Online job advert estimates dataset, and more details on the methodology can be found in Using Adzuna data to derive an indicator of weekly vacancies.
According to Adzuna, in the week ending 5 February 2021, the volume of UK online job adverts saw a slight increase of two percentage points from the previous week to 80% of the level seen in the same week last year.
Excluding the “unknown” category, online job adverts increased in 19 of the 28 Adzuna categories, decreased in six and stayed the same for the remaining three. The largest weekly increases came in “energy, oil and gas” and “admin, clerical and secretarial”; both increased by 11 percentage points to 76% and 68% of their levels seen last year, respectively. The increase in “admin, clerical and secretarial” category can be in-part attributed to increased vacancies from a single company. The “legal” category saw an increase of 9 percentage points from the previous week to 83% of the level seen last year.
The largest weekly decrease came from “domestic help”, which decreased by 26 percentage points to 81% of the level seen in the same week last year. This was followed by “construction and trade”, which saw a decrease of 14 percentage points. Despite this decrease in the latest week, the volume of online job adverts for “construction and trade” remains high at 108% of its level seen last year, having seen a consistent rise since July 2020.
Online job adverts for “travel and tourism”, “customer service and support” and “charity and voluntary” remained unchanged from the previous week when comparing the volume of online job adverts for these categories with the same week last year.
Figure 12: In the week ending 5 February 2021, the volume of UK online job adverts increased in 8 of the 12 UK regions and countries
Total weekly job averts on Adzuna, UK, 4 January 2019 to 5 February 2021, percentage compared with the same week in the previous year
Embed code
Notes:
- There is a level shift in the Northern Ireland series from 17 October 2019 due to a large source of Northern Ireland job adverts being removed, and another level shift from 7 August 2020 because of a new source being included.
In the week ending 5 February 2021, 8 of the 12 UK regions and countries saw an increase in the volume of online job adverts. The remaining four saw a decrease, three of which were the devolved countries. The volume of online job adverts in Northern Ireland fell by 24 percentage points, a reversal of the large weekly increases seen in recent weeks. This was followed by Wales, which saw a decrease of 7 percentage points when compared with the previous week, to 76% of the level in the same week last year.
The East Midlands saw the largest weekly increase of 5 percentage points compared with the previous week to 93% of the level seen last year, followed by Yorkshire and The Humber, which saw a weekly increase of 4 percentage points to 84% of the level seen last year.
Back to table of contents11. Weekly online food and drink basket
A timely indication of weekly online price change for a selection of food and drink products from several large UK retailers has been developed, covering the period 1 June 2020 to 7 February 2021. Details of the methodology used for these indicators can be found in Online price changes methodology. This analysis is experimental and should not be compared with our regular monthly consumer price statistics.
The data time series, weekly growth rates, and contributions to the weekly change for all individual food and drink items, along with sample sizes, are published in a dataset alongside this release.
The overall price of items in the online food and drink basket was broadly unchanged between the week ending 7 February 2021 and the previous week.
Figure 13: The overall price of items in the online food and drink basket was broadly unchanged from the previous week
Percentage point contributions to online price changes for food and drink, UK, between the week ending 31 January 2021 and the week ending 7 February 2021
Source: Office for National Statistics - Online price collection
Notes:
- Contributions may not always sum to the weekly change, as a result of rounding.
Download this chart Figure 13: The overall price of items in the online food and drink basket was broadly unchanged from the previous week
Image .csv .xlsThe main downward contributors in the latest week were “sugar, jam, syrup, chocolate and confectionery”, and “spirits”. The former category saw a 0.4% price decrease, mostly because of the falling price of chocolate, while the latter saw a 0.7% price decrease. Both categories each contributed negative 0.04 percentage points to the weekly change in the overall price level.
The largest upward contributor was “milk, cheese and eggs”, which saw a price increase of 0.7%, mainly because of the rising price of yoghurt and cheese. This category contributed positive 0.06 percentage points to the weekly change in the overall price level.
Back to table of contents12. Roads and traffic camera data
Road traffic in Great Britain
According to Department for Transport (DfT) non-seasonally adjusted road traffic data, on Monday 8 February 2021, the volume of all motor vehicle traffic fell by 6 percentage points when compared with the previous week to 60% of the level observed on the same day of the first week in February 2020. The overall volume of road traffic remains below pre-Christmas levels.
This fall was driven by decreases in all three main categories of motor vehicles. On Monday 8 February 2021, road traffic volumes of cars decreased by 6 percentage points compared with the previous week to 53% of the level observed on the same day of the first week in February 2020. Heavy goods vehicle (HGV) and light commercial vehicle traffic levels both decreased by 3 and 5 percentage points respectively.
Figure 14: On Monday 8 February 2021, the volume of all motor vehicle traffic decreased by 6 percentage points when compared with the Monday of the previous week
Daily road traffic index: 100 = same traffic as the equivalent day of the week in the first week of February 2020, 1 March 2020 to 8 February 2021, non-seasonally adjusted
Source: Department for Transport – Road traffic statistics: management information
Notes:
- On 5 January 2021, mainland Scotland entered a full lockdown, England followed on 6 January 2021.
- Full details of the restrictions on UK regions and countries can be found in Section 15: UK regional lockdown restrictions.
Download this chart Figure 14: On Monday 8 February 2021, the volume of all motor vehicle traffic decreased by 6 percentage points when compared with the Monday of the previous week
Image .csv .xlsThe daily DfT estimates are indexed to the first week of February 2020 and the comparison is with the same day of the week. The data provided are useful as an indication of traffic change rather than actual traffic volumes. More information on the methods, quality and economic analysis for these indicators can be found in the methodology article.
Traffic camera activity
Traffic cameras are a valuable source for understanding the level of activity in towns and cities as well as changing patterns of mobility. The UK has thousands of publicly accessible traffic cameras with providers ranging from national agencies to local authorities. Further information on the methodology used to produce these data is available in our methodology article and Data Science Campus blog.
In the accompanying dataset, the following categories are available as non-seasonally adjusted, seasonally adjusted and trend data:
- cars
- motorbikes (only available for London and the North East)
- buses
- trucks
- vans
- pedestrians and cyclists
The categories are available for the following regions, which give a broad coverage across the UK and represent a range of different-sized settlements in urban and rural settings:
Figure 15: In the week ending 7 February 2021, average counts of traffic camera activity for cars and pedestrians and cyclists increased slightly when compared with the previous week across London, Greater Manchester and Northern Ireland
Traffic camera activity in selected areas, daily counts of cars, buses, pedestrians and cyclists, seasonally adjusted, March 2020 to February 2021
Embed code
Notes:
The regions shown here were selected to be representative of the regions available.
Traffic camera images capture the appearance of buses, but they give no indication of the number of passengers using public transport.
Note that data for Durham have been excluded due to quality concerns.
Please also note that due to a camera outage between 28 January 2021 and 3 February 2021, the traffic camera values for Greater Manchester have been imputed.
In London in the latest week (week ending 7 February 2021), average counts of all traffic camera activity increased slightly compared with the previous week. Pedestrians and cyclists, vans and trucks all increased by 3%, buses and cars both increased by 2%.
In Northern Ireland, car, truck, and pedestrian and cyclist camera activity have increased compared with the previous week by 1%, 13% and 3% respectively. Bus traffic has decreased compared with the previous week by 9%, van traffic remains broadly unchanged.
In Greater Manchester, counts of car, and pedestrian and cyclist traffic both increased compared with the previous week, by 6% and 11% respectively, although it should be noted that these percentage changes are based in-part on imputed data because of camera outages.
Back to table of contents13. Data
UK spending on credit and debit cards
Dataset | Released 11 February 2021
These data series are experimental faster indicators for monitoring UK retail purchases derived from the Bank of England's Clearing House Automated Payment System (CHAPS) data.
Weekly and daily shipping indicators
Dataset | Released 11 February 2021
The weekly and daily shipping indicators dataset associated with the faster indicators of UK economic activity.
Traffic camera activity
Dataset | Released 11 February 2021
Experimental dataset for busyness indices covering the UK.
Online weekly price changes
Dataset | Released 11 February 2021
The online price changes for a selection of food and drink products from several large UK retailers. These data are experimental estimates developed to deliver timely indicators to shed light on changes in consumer prices from online grocery retailers.
Online job advert estimates
Dataset | Released 11 February 2021
Experimental job advert indices covering the UK job market.
Business insights and impact on the UK economy
Dataset | Released 11 February 2021
Responses from the voluntary fortnightly Business Impact of Coronavirus (COVID-19) Survey (BICS), which captures businesses responses on how their turnover, workforce prices, trade and business resilience have been affected in the reference period.
Economic activity, faster indicators, UK
Dataset | Released 14 January 2021
Data on road traffic and Value Added Tax (VAT) data from HM Revenue and Customs (HMRC).
Company incorporations and voluntary dissolutions
Dataset | Released 11 February 2021
Weekly dataset showing the number of Companies House Incorporations and Voluntary Dissolution applications accepted.
14. Glossary
Company incorporations
Incorporations are when a company is added to the Companies House register of limited companies. This can also include where an existing business applies to become a limited company, where it was not one before.
Diffusion index
The diffusion index tracks the growth in turnover and expenditure of firms. It is constructed to lie between negative one and one. For example, if 65% of firms have increasing turnover, 30% have decreasing turnover and 5% turnover remains unchanged, then the diffusion index is 0.35.
Faster indicator
A faster indicator provides insights into economic activity using close-to-real-time big data, administrative data sources, rapid response surveys or Experimental Statistics, which represent useful economic and social concepts.
New reporter
A new reporter is defined as a firm with a Value Added Tax (VAT) reference (that is, firm identification number) which has not previously reported its VAT returns. New reporters are published within one month of the end of the reporting period. The new reporting behaviour measure is classified by the month the data were received by HM Revenue and Customs, known as the receipt date, which is not necessarily the same as the reference period (the period for which the VAT return is made).
Voluntary dissolution applications
A voluntary dissolution application is when a company applies to begin dissolution proceedings. As such, they effectively chose to be removed from the Companies House register. For a company to be eligible to voluntarily dissolve, it should not have completed any trading activity for a period of three months.
Back to table of contents15. Measuring the data
End of EU exit transition period
As the transition period ends and the UK enters into a new Trade and Cooperation Agreement with the EU, the UK statistical system will continue to produce and publish our wide range of economic and social statistics and analysis. We are committed to continued alignment with the highest international statistical standards, enabling comparability both over time and internationally, and ensuring the general public, statistical users and decision makers have the data they need to be informed.
UK regional lockdown restrictions
The following is a summary of coronavirus (COVID-19) restrictions in each of the four UK constituent countries between Monday 1 February 2021 and Monday 8 February 2021.
A full list of national restrictions is available for England from gov.uk, for Scotland from the Scottish Government, for Wales the Welsh Government and for Northern Ireland from nidirect.
UK
- All travel corridors were closed. With a few exceptions, arrivals must self-isolate for 10 days and those flying were required to present evidence of a negative COVID test before boarding the plane.
Scotland
- All of mainland Scotland and the Western Isles were under full lockdown restrictions. Orkney and the Shetland Islands were under Level 3 restrictions.
Wales
- All of Wales was in Tier 4 lockdown restrictions.
England
- England was under a full national lockdown.
Northern Ireland
- Northern Ireland was under a full national lockdown.
Detailed information on the data sources, quality and methodology of the different indicators included in this bulletin is available in the Coronavirus and the latest indicators of the UK economy and society methodology.
We will summarise any crucial updates to the quality or methodology in this section in the future.
Back to table of contents16. Strengths and limitations
Detailed information on the strengths and limitations of the different indicators included in this bulletin is available in the Coronavirus and the latest indicators of the UK economy and society methodology.
We will summarise any crucial updates or warnings in this section in the future.
Back to table of contents
5. Social impact of the coronavirus
This section includes some provisional results from the Opinions and Lifestyle Survey (OPN) covering the period 3 February to 7 February 2021. The survey went out to 5,898 adults in Great Britain and had a response rate of 77%.
Further information to help understand the impact of the coronavirus (COVID-19) pandemic on people, households and communities in Great Britain, will be available in Coronavirus and the social impacts on Great Britain published on 12 February 2021.
Travelling to work
In the week ending 7 February 2021, the proportion of working adults in Great Britain who in the last seven days:
Shopping
Of the 91% of adults that reported they had left home in the last seven days, the proportion that did so to shop for food and medicine increased slightly when compared with the previous period to 75%, an increase of 2 percentage points.
The proportion of these adults who shopped for things other than food and medicine in the last seven days remained similar to the previous week unchanged at 7%; the continued low level coincides with the ongoing lockdowns throughout the UK.
Back to table of contents