Table of contents
1. Introduction
Office for National Statistics (ONS) has a programme of research and development aimed at improving and maintaining the Consumer Prices Index (CPI) and CPIH (a measure of consumer price inflation including owner occupiers’ housing costs) – ensuring that they continue to meet user needs, make use of new and innovative methods and are compliant with EU regulations (the CPI is governed by European legislation, but, where appropriate, compliance changes will also be considered for implementation into CPIH).
The Retail Prices Index (RPI) is also a measure of consumer price inflation. However, the RPI uses a formula that does not meet international best practice and as a result its designation as a National Statistic was cancelled in 2013. The RPI will continue to be maintained through routine changes, but methodological improvements will only be made if, to not do so, would inhibit the improvement of CPIH and CPI. We now only publish RPI-related data that is essential to the needs of users.
The CPIH and CPI work programme feeds into the higher ONS business plan (National Accounts and Economic Statistics (NAES) directorate), Economic Transformation, Better statistics, better decisions. We have allocated appropriate resources.
The aim of this development plan is to provide you with information on the plans in place for the development of consumer price statistics, how this work feeds into the ONS business plan and to show that appropriate resources have been allocated to this plan and that we are aware of the potential risks.
Back to table of contents2. Business plan
The strategy for UK statistics Better statistics, better decisions sets the collective mission for the official statistics system as, “high quality statistics, analysis and advice to help Britain make better decisions”. This strategy is reflected in the directorate business plan for National Accounts and Economic Statistics (NAES), which sets out how the directorate will contribute to fulfilling the strategy for UK statistics. The purpose of the Prices business plan is to set a local vision and set of objectives that aligns the work programme of prices with that of the NAES directorate and UK statistics.
The vision for Prices division aims to align the work programme with the wider vision for NAES and ONS, reflecting the need to continually improve what we do and to make the shift towards the transformation, both in our systems and people, needed in the delivery of inflation statistics. The vision for Prices division is therefore:
Delivering. Improving. Transforming
Delivering: Quality and relevant price statistics that are produced
Improving: Efficiently to meet customers' needs
Transforming: Keeping pace with evolving methods, sources and digital processes
Back to table of contents3. Work programme
3.1 Introduction
The work programme has been updated to reflect decisions reached by the National Statistician1 following the 2015 consultation on consumer price statistics2. The consultation followed a review led by Mr Paul Johnson (commonly referred to as the Johnson Review), which took a comprehensive look at how inflation is measured in the UK and made a series of recommendations about the future development of these statistics3. The programme and priorities also reflect the priority placed on the use of alternative data sources by Professor Sir Charles Bean’s review of economic statistics (commonly referred to as the Bean Review)4.
We expect that our top priorities for the next few years will be to:
- continue to provide information and assurance on sources used to compile the CPIH
- continue to develop the use of alternative data sources such as point of sale scanner data and web scraping
- continue to produce a measure that better reflects the households’ experience of inflation
- publish measures of income and price change as experienced by different household groups
- explore ways to improve clothing measurement, with a particular focus on the use of alternative data sources
For us to be at the cutting edge of international research for consumer price indices, the programme will need to continuously evolve in light of new priorities. Therefore we will review and update this work programme periodically and an update will be provided each September to the UK Statistics Authority Board via the National Statistician.
In updating the work programme, we will seek the guidance of the Advisory Panels on Consumer Prices and engage with experts and users of these statistics.
3.2. High priority
High priority items are the cornerstone of the development programme and if necessary will be prioritised over the delivery of medium and low priority items. High priority items are listed in order of implementation (of the first deliverable).
3.2.1. The range of measures needed to meet user needs
Overview
The National Statistician has alluded to the range of measures needed to meet user needs, which is based on three recognised user needs. The first is the need for a set of measures based on macroeconomic principles, calculated consistently with economic concepts and approaches. The second user need is in measuring the household experience, looking at changes in household outgoings or costs as they are experienced. The third user need is for the Retail Prices Index (RPI), due to its existing use in long-standing contracts.
To meet these three user needs we need to:
- continue to provide information and assurance on sources used to compile the Consumer Prices Index including owner occupiers’ housing costs (CPIH), improve user understanding of the measure and embed CPIH as the national measure in the UK
- continue to produce and improve the Consumer Prices Index (CPI) so that we have a measure that is comparable across the EU and also internationally
- work to develop a set of indices that better reflect inflation as experienced by the household, or by household groups
- continue to publish the RPI as a legacy measure, while making any necessary routine changes
Implementation
Produce initial exploratory Household Costs Indices; December 2017
Future iterations of HCIs research; December 2018
3.2.2. Data collection strategy for consumer price statistics
Overview
Improvements in technologies have resulted in new, alternative, sources of price data, which could be used in the compilation of price indices. There are two main alternative data sources that could be used, specifically:
point of scale scanner data – often referred to as scanner data, collected by retailers as goods are scanned across the till; these data are often considered the gold standard for consumer price statistics as the data include both price and volume information
online price data – either collected internally using web scraping (using automated robots that scan retailers’ websites and extract price information) or some other method (for example, using application programming interfaces (APIs) to access the data directly or by sourcing the data from an external supplier)
The Johnson Review and Bean Review recommended that ONS should give priority to obtaining these data and developing methods and capabilities to use them. We currently have several streams of research looking at these alternative sources of data. These cover a number of areas including:
- testing the collection and processing of grocery price data
- investigating the use of online price data in the measurement of clothing prices
- undertaking a feasibility study into using online price data to replace the central collection of prices
- reviewing appropriate price index methodology for use with alternative data sources
- investigating the use of a database of rail fares transactions to improve the rail fares item in CPI
- why prices for some items are sourced from the internet, while others are obtained from the local shop-based collections5
These workstreams will in turn advise a data collection strategy for consumer price statistics, which will include recommendations on the use of alternative data sources in the production of consumer price statistics. This item ties in with the Economic Statistics Centre of Excellence’s (ESCoE’s) workstream on measurement issues in the modern economy, which is investigating how measurement prices might evolve in light of the digital revolution. It also ties in with another ESCoE project on improving the quality of regional economic indicators in which one area of work is to look at how to construct regional price indexes using new data sources.
Implementation
Publication of the Data Collection Strategy for consumer prices; early 2018
Implementation of improvements to rail fares; early 2019
3.2.3. Developing Household Costs Indices (HCIs)
Overview
The concept of a Household Costs Index (HCI) was first proposed by Astin and Leyland (as the Household Inflation Index, HII), culminating in a paper6 submitted as a response to the 2015 consultation on consumer price statistics. Suggested differences from existing measures of price change include the potential inclusion of asset prices and interest payments, plus giving each household’s expenditure equal weight. Following the consultation the National Statistician decided that the HCIs could serve as an important complement to the suite of consumer price indices.
ONS has conducted research into the concepts and issues that were raised in Astin and Leyland’s paper and, in August 2016, released a discussion paper7. Feedback was provided by a number of important users, as well as the Advisory Panels on Consumer Prices. A summary of the feedback received, along with next steps to further develop the indices, was published in December 20168.
Work has now commenced to develop these indices, releasing focused analytical articles through 2017 and beyond, that will help shape the production of the final measure. ONS has subsequently engaged with its advisory panels on a number of development issues. Initial experimental indices were published in December 2017 but there are a number of concepts that will need to be explored further.
Following the 2015 consultation on consumer price statistics, the National Statistician reached the decision that ONS should produce comparable measures of income and price change for different household groups on an annual basis in one publication. We will engage with users to shape further development of the measures.
Much consideration has gone into how comparable measures of income and price change should be produced and work in the area suggests there may be a case for a “family of indices” to deflate income using different definitions. As such Household Costs Indices may be appropriate to be matched to a microeconomic measure of income. This item ties in with ESCoE’s workstream on democratic measures of income growth, which aims to make a wider range of measures available to policy-makers.
Implementation
Release experimental Household Costs Indices as part of a wider analysis of income, expenditure and price change; December 2017
Consultation with stakeholders; Quarter 1 (Jan to Mar) 2018
Ongoing experimental publication; annually
Explore further improvements that can be made to Household Costs Indices to bring them more in line with the households’ experience of changing costs; 2018 and 2019
Increase frequency of income and price change publications, using nowcasting techniques to improve the frequency of income measures; 2020.
3.2.4. Developing CPIH sub-groups
Overview
Research we published in 20149 shows that different household groups can experience different rates of inflation. Many users have since expressed interest in seeing updates and improvements to this work. The indices will need to be referenced to the CPIH instead of the CPI; given the CPIH is the lead measure of inflation in the UK. The indices could be developed further by differentiating between different products purchased, producing specific prices indices for each household group.
Following the 2015 consultation on consumer price statistics, the National Statistician reached the decision that ONS should produce comparable measures of income and price change for different household groups on an annual basis in one publication. We will engage with users to shape further development of the measures.
Much consideration has gone into how comparable measures of income and price change should be produced and work in the area suggests there may be a case for a “family of indices” to deflate income using different definitions. As such, CPIH sub-groups may be appropriate to be matched to a macroeconomic measure of income. Household sub-groups will also be produced for the HCIs work and so this item will be co-ordinated with the previous one.
Implementation
Engage with users on the best way to proceed with producing CPIH indices for different household groups; Quarter 1 (Jan to Mar) 2018
Initiate a quarterly production of CPIH sub-group indices; mid 2018
Increase frequency of income and price change publications, using nowcasting techniques to improve the frequency of income measures; 2020
3.2.5. Develop a reconciliation between CPIH and RPI and review the existing methodology for reconciliation
Overview
With the move towards making CPIH the preferred measure of inflation, we will develop a reconciliation between CPIH and RPI, and use the opportunity to review the reconciliation method used. This is being looked at experimentally and could help reconcile differences between alternative measures of owner occupiers’ housing (OOH) costs. We will seek the advice of the Advisory Panel on Consumer Prices – Technical and other expert users.
Implementation
Reconciliation between CPIH and RPI published; mid 2018
Improved reconciliation method; early 2020
3.2.6. Improving clothing measurement in consumer price inflation statistics
Overview
In 2010, we made a number of changes to the methodology used to collect clothing prices. These changes meant that the gap between RPI and CPI, which use different formulae at the lowest level of aggregation10, widened. Constructing price indices for clothing items can be problematic. This is because the high product turnover associated with fashion items makes it difficult to identify comparable replacements. We will continue to explore the measurement of clothing prices through analysis of the web-scraped clothing data provided by WGSN (see use of alternative data sources), as well as considering other ways that the measurement of clothing price changes could be improved. We will seek the advice of the Advisory Panels for Consumer Prices in this matter.
Implementation
Report on alternatives to matching and compare methods; Quarter 3 (July to Sept) 2018
Report on methodology and compare methods; Quarter 4 (Oct to Dec) 2018
Criteria for elementary aggregates and impact assessment; Quarter 1 (Jan to Mar) 2019
Proposal on improvements to clothing; Quarter 1 2019
3.2.7 Developing a historical series for CPIH
Overview
CPIH, the lead measure of inflation, is the most comprehensive measure of consumer price inflation, given its inclusion of owner occupiers’ housing costs (OOH). The current time series extends back to 2005, which is when the rental data sources used to calculate the OOH component for England began.
A modelled historical series has previously been estimated for the CPI11. To increase the usability of CPIH and provide a longer commentary on the impact of owner occupiers’ housing costs on inflation, a historical series will be modelled for CPIH.
Implementation
Publish a methods paper for developing a historical series; late 2017
Seek user views on the methods paper; Quarter 1 (Jan to Mar) 2018
Finalised series publish; mid 2018
3.3 Medium priority items
Medium priority items form an important part of the work programme but if necessary delivery may be delayed for high priority items. Medium priority items are listed in order of implementation (of the first deliverable).
3.3.1 European compliance issues
Overview
The UK CPI is also the UK’s Harmonised Index of Consumer Prices (HICP). The HICP is a measure of inflation produced by all EU member states in line with EU regulations. We are working to ensure compliance through implementing a temporal sample for fresh fruit and vegetables, and improvements to the methodology for package holidays.
Prices for fresh fruit and vegetables are collected on a single Index Day, a Tuesday, in or around the middle of the month. To address temporal sampling requirements, a second collection day for fresh fruit and vegetables will be implemented in 2018, following a parallel run in 2017.
In 2015, Eurostat published the UK Compliance Report12 which stated that ONS’s method for package holiday collection is non-compliant. This is because price relatives for package holidays are calculated by comparing the price in the current month with the price the same month a year ago, rather than comparing the price with December. Work is underway to develop an improved methodology.
Implementation
Introduction of temporal sampling for fresh fruit and vegetables; March 2018
Implementation of improvement to package holidays; early 2020
3.3.2 Developing measures of accuracy for CPIH
Overview
Due to the complex survey design, calculating standard errors for CPIH and specifically the growth in CPIH is very challenging.
There are two dimensions to the sampling: selection of items and selection of outlets. The sampling involves purposive sampling of both items and outlets. The CPIH weights come from a variety of sources. Some are administrative sources, some are survey-based. They are then put through national accounts balancing. This all makes the estimation of sampling errors difficult.
Also, CPIH weights are price-updated using movements in the appropriate CPIH index, so there is an interaction between weights and prices. Annual rates of change in the price index are ratio estimates, usually over a chain link, so there may be correlations between prices in successive periods that need to be taken into account. Estimates of the variance due to the variance in the Living Costs and Food (LCF) data used as weights are currently being investigated. These will give an indication of some part of the accuracy of CPIH.
Implementation
Further analysis and refinement; early 2018
Estimates of the sampling errors associated with central items; mid 2018
3.3.3 Review of quality adjustment and monitoring of quality change
Overview
One of the more difficult issues in producing consumer price inflation statistics is the accurate measurement and treatment of quality change due to changing product specifications. The Johnson Review considered quality change and recommended ONS provides more information to explain how quality change is monitored.
In response to the 2015 consultation on consumer price statistics, some users suggested that ONS should devote more resources to improving and monitoring methods of quality adjustment. In particular the quality adjustment of services could be given more consideration. The Bean Review13 also considered quality change and found that the issue is likely to grow in importance with the “spreading tentacles of the digital revolution”.
To address these findings we will launch a project to review quality adjustment methods used in consumer price inflation statistics and provide more detail on how quality adjustment is monitored.
This item ties in with ESCoE’s workstream on measuring activity in services sectors as the project aims to investigate the deficiencies in the current measures of services activities for the UK and how might they be improved.
Implementation
Report on quality adjustment methods used and how quality adjustment is monitored; Quarter 1 (Jan to Mar) 2019
3.3.4 Improvements to CPIH methodology
Overview
There are a number of ways in which the owner occupiers’ housing costs (OOH) component of CPIH could be further improved. We intend to explore these potential developments to further improve the effectiveness of CPIH as a measure of inflation. These are described in this section.
When the OOH component in CPIH was developed in 2011 using administrative data sources for England, Wales and Scotland, comparable rental data for Northern Ireland were not suitable. At the time the Northern Ireland Housing Executive (NIHE) received private rental data biannually, covering the Belfast Metropolitan Region only. As a result the existing CPI private rental data series for Northern Ireland has continued to be used. Since then the coverage across Northern Ireland has improved and the data are now available monthly. We have received an extract of these data from NIHE and started analysis with the ultimate aim of producing a rental index suitable for inclusion in OOH in 2018.
Currently, dwelling stock data from the Ministry of Housing, Communities and Local Government (MHCLG) are used to mix-adjust rental data to reflect the OOH market. However, the property type split is not available on a regional basis, so the same property type split is applied across all regions. We will explore other potential sources of data to improve the stratification.
The Johnson Review14 identified that recent research into the measurement of rental equivalence has suggested using a flow measure (new lets only), rather than a stock measure (new and existing lets). We will also explore the appropriateness of using this new approach to measuring rental equivalence costs.
Implementation
New rental data source for Northern Ireland implemented in OOH; early 2019
Improved property type split for stratum weights; 2020
Present findings from investigation into stock and flow measures of rental equivalence; 2019
3.3.5 Regional indices
Overview
Relative Regional Consumer Price Levels (RRCPL) are an example of a spatial price index, which can be used to compare relative price levels to the UK for the nine regions of England, as well as Scotland, Wales and Northern Ireland. We publish RRCPLs every six years using data collected to calculate purchasing power parity (PPP) spatial adjustment factors (SAF). The last SAF collection took place in 2016 and the data may potentially be used to publish the RRCPL in early 2018.
The regular collection of prices for consumer price inflation statistics is optimised for measuring inflation at the UK level. Prices are collected locally in 141 locations spread across Scotland, Wales, Northern Ireland and the nine regions of England. As a result, the number of locations visited per region is small, making the data less suitable for regional indices. Additionally, the prices for many products are collected centrally with no regional breakdown. The viability of using the existing price data to produce more geographically-disaggregated price indices was assessed in a feasibility report published in November 2017. We aim to build on the findings of this report to work towards more robust regional price indices for the UK.
Implementation
Ongoing development work towards the production of regional price indices; 2019
3.3.6 Location boundary review
Overview
The current sample frame used to select locations for the local price collection was drawn over 10 years ago. While the sample has been updated using rotation of locations and selection of outlets, the location boundaries need to be updated to reflect changing expenditure patterns.
Eight new location boundaries are being piloted in 2017 and in 2018 another 15 new location boundaries will be piloted. The new boundaries will be rolled-out over a five-year period starting in January 2019.
Implementation
Roll-out of new boundaries; January 2019
3.4 Low priority items
The delivery of low priority items may be delayed or even stopped to ensure the delivery of high and medium priority items. Low priority items are listed in order of implementation (of the first deliverable).
3.4.1 Discounts
Overview
Retailers are offering an increasing array of discounts to attract customers. Single product discounts (available to all consumers without conditions) are captured in consumer price statistics. However, many other types of discounts, such as multi-buy offers or loyalty schemes are excluded. The Johnson Review recognised the difficultly of accurately reflecting all discounts in consumer price statistics and recommended that ONS carry out more work in this area, ultimately seeking to reflect a wider range of discounts in its consumer prices statistics.
ONS has contracted TNS, the company that collects price information used to compile consumer price inflation statistics, to collect additional discounts metadata for some items that are already collected locally. Field collectors are asked to record information on discounts (including multibuy discounts) on the handheld devices. The pilot will be run on all food and drink items, with the facility to expand to other product groups in the future. Web-scraped data are also being used to explore the prevalence of discounts.
Implementation
Analysis of discounts in alternative data sources; late 2018
Analysis of discount data collected locally; early 2019
Implement outcome of pilot; early 2020
3.4.2 Weights
Overview
The Johnson Review made a number of recommendations to improve the weights used in consumer price inflation statistics. In early 2014, we improved the commentary in the annual weights article to explain why weights differ and the publication was also brought forward to coincide with the implementation of the annual weights in the Consumer price inflation publication. The review also recommended that ONS consider:
whether the stratification of items by shop type can be improved15
whether weights for some items should be based on more than one year of data to smooth irregular movements (and what causes those movements)16
We will also seek to introduce an appropriate stratification where weights for different types of shops are available and can be updated.
We have developed a proposal to use a three-year moving average to smooth the weights for three volatile items with irregular movement in the CPIH and CPI baskets. The Advisory Panel for Consumer Prices – Technical considered these proposals in May 2016 and again in September 2017, and advised against using this method. Therefore we will not be pursuing this workstream further.
Implementation
Update shop type weights in the CPI and CPIH; March 2019
3.4.3 Develop alternatives to the use of RPI data
Overview
Following the 2015 consultation on consumer price statistics, the National Statistician decided that ONS would publish the bare minimum of RPI-related data necessary to ensure the critical and essential needs of existing users are met. To aid users in finding alternatives to the use of RPI data we will:
- develop a new method for calculating average prices using CPIH
- shift the long run (1750 onwards) inflation series from RPI to CPIH
- update the personal inflation indicator (PIC) to CPIH
- develop and publish a hierarchy of historical indices
Implementation
Alternatives developed to the use of RPI data; mid 2018
3.4.4 Improvements to OOH(NA)
Overview
We currently produce an experimental net acquisitions index for Eurostat, as part of a pilot to incorporate owner occupiers’ housing costs (OOH) costs into the HICP. Currently there is no weight for the component “existing dwellings new to the household” sector, which means that it is given a zero weight in the aggregation. Moreover, the weight for the “acquisition of new dwellings” component includes new dwellings outside the OOH sector (that is, the weight is gross acquisitions, rather than net). We will explore data sources that could be used to improve this experimental index.
Implementation
Improved methodology for the net acquisitions index; 2020
3.4.5 The extent to which consumers substitute between outlets
Overview
The Johnson Review recommended that ONS should research the extent to which consumers substitute between outlets. For example, this would capture how prices for the same goods have changed with the move from corner shops to supermarkets and from supermarkets to online providers.
Implementation
Report on the extent to which consumers substitute between outlets; 2020
3.4.6 Inclusion of FISIM in CPIH
Overview
Financial intermediation services indirectly measured (FISIM) are included in the national accounts measure of household final consumption expenditure (HHFCE) but are not currently included in consumer price indices. The scope of CPI, which is governed by European legislation, is drawn from the same source as HHFCE and the exclusion of FISIM is one of the biggest differences between the two. As CPIH is not bound by the same legislation, we will consider the suitability of including FISIM as a proxy for the service charge that households pay to banks. A review will include consideration of conceptual appropriateness, international practice and methodology used to calculate a price index for FISIM.
Implementation
Feasibility study on the inclusion of FISIM in CPIH: early 2019
Notes for: Work programme
- Letter from John Pullinger to Andrew Dilnot in which he sets out his emerging thoughts on the future of consumer price statistics.
- 2015 consultation on consumer price statistics.
- Details of the Johnson review and the final report.
- In July 2015, the Chancellor of the Exchequer commissioned Professor Sir Charles Bean to conduct an independent review of the quality, delivery and governance of UK economic statistics. The terms of reference, final and interim reports from the Bean review can be found on the GOV.UK website.
- Ibid, Recommendation 11.
- Towards a Household Inflation Index.
- Developing an Index of Household Payments.
- Developing an Index of Household Payments, summary of responses.
- Variation in the inflation experience of UK households: 2003 to 2014.
- CPI and RPI: increased impact of the formula effect in 2010.
- Modelling a Back Series for the Consumer Prices Index, 1950 to 2011.
- UK Compliance Report.
- Details of the Bean review and the final report.
- Details of the Johnson review and the final report.
- Ibid, Recommendations 17.
- Ibid, Recommendations 15-16.
4. Resources
The Office for National Statistics (ONS) Prices division has allocated resources to deliver the business as usual production of CPIH and CPI, as well as the projects for improvement and development that form the work programme. Prices division is led by a Deputy Director and consists of a number of teams that contribute to the production and development of Consumer Price Indices.
CPI production branches conduct work to enable the publication of the suite of Consumer Price Indices, which includes CPIH and CPI. These consist of two teams, one focusing on commodity analysis and the other on user engagement. Both are led by a Grade 7.
Housing Market Indices conduct work to enable the publication of the suite of housing statistics (HPI and IPHRP). This team is led by a Grade 7 and has recently acquired a permanent AO position to assist with production.
Systems support process the monthly CPI index and provide systems support. It is led by a Grade 7.
Prices development undertakes work to improve the development and maintenance of Consumer Price Indices. The team is led by a Grade 7.
Prices economic analysis is a relatively new team, which provides economic support to the division and conducts economic analysis. This team is led by a Grade 7.
Figure 1: Organisational chart for prices division

Download this image Figure 1: Organisational chart for prices division
.png (15.5 kB)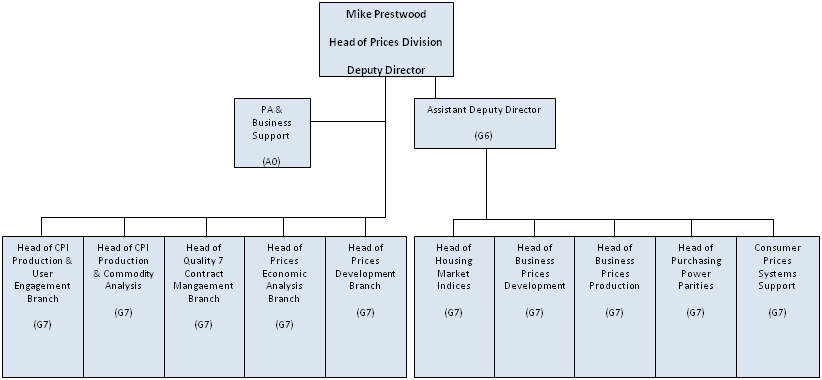
The Quality and Contract Management team regularly reviews risks associated with the work programme, resources and how these align with the business plan. These risks are documented and assigned a status dependent on the severity of the risk and the appropriate actions are detailed and assigned to relevant owners.
Back to table of contents5. Conclusion
This work plan has been published to give you a greater understanding of the planned development work associated with consumer price statistics. The work has been prioritised in line with regulatory requirements and known user needs.
We welcome your communication both in terms of this development work plan and more widely in relation to the Consumer price statistics publication and outputs.
Email: cpi@ons.gov.uk
Back to table of contents