Table of contents
- Main points
- Things you need to know about this release
- What’s changed in this release?
- Are our figures likely to change over time?
- How much is the public sector borrowing?
- How much does the public sector owe?
- Revisions since the previous release
- How do our figures compare with official forecasts?
- International comparisons of borrowing and debt
- Quality and methodology
- Looking ahead
- Links to data and related publications
1. Main points
Borrowing (public sector net borrowing excluding public sector banks) in May 2019 was £5.1 billion, £1.0 billion more than in May 2018; borrowing in May 2018 remains the lowest for that month since 2002.
Borrowing in the current financial year-to-date (April 2019 to May 2019) was £11.9 billion, £1.8 billion more than in the same period last year; the financial year-to-date April 2018 to May 2018 remains the lowest borrowing for that period for 12 years (April 2007 to May 2007).
Borrowing in the latest full financial year (April 2018 to March 2019) was £24.0 billion, £17.8 billion less than in the same period the previous year; the lowest financial year borrowing for 17 years.
Borrowing in the latest full financial year was £1.2 billion more than the £22.8 billion forecast by the Office for Budget Responsibility (OBR) in its Economic and Fiscal Outlook – March 2019.
Debt (public sector net debt excluding public sector banks) at the end of May 2019 was £1,806.1 billion (or 82.9% of gross domestic product (GDP)); an increase of £25.0 billion (or a decrease of 1.4 percentage points of GDP) on May 2018.
Debt at the end of May 2019 excluding Bank of England (mainly quantitative easing) was £1,622.2 billion (or 74.4% of GDP); an increase of £35.1 billion (or a decrease of 0.7 of a percentage point of GDP) on May 2018.
Central government net cash requirement was £9.2 billion in the latest financial year-to-date; £8.0 billion more than in the same period last year.
Central government net cash requirement excluding both UK Asset Resolution Ltd and Network Rail was £6.8 billion in the latest financial year-to-date; £6.0 billion more than in the same period last year.
2. Things you need to know about this release
In the UK, the public sector consists of five sub-sectors: central government, local government, public non-financial corporations, Bank of England and public financial corporations (or public sector banks).
Unless otherwise stated, the figures quoted in this bulletin exclude public sector banks (that is, currently only Royal Bank of Scotland (RBS)), as the reported position of debt (and to a lesser extent borrowing) would be distorted by the inclusion of RBS's balance sheet (and transactions). This is because government does not need to borrow to fund the debt of RBS, nor would surpluses achieved by RBS be passed on to government, other than through any dividends paid as a result of government equity holdings.
Public sector net borrowing excluding public sector banks (PSNB ex) measures the gap between revenue raised (current receipts) and total spending (current expenditure plus net investment (capital spending less capital receipts)). Public sector net borrowing is often referred to by commentators as “the deficit”.
The public sector net cash requirement (PSNCR) represents the cash needed to be raised from the financial markets over a period of time to finance the government’s activities. This can be close to the deficit for the same period but there are some transactions, for example, loans to the private sector, which need to be financed but do not contribute to the deficit. It is also close but not identical to the changes in the level of net debt between two points in time.
Public sector net debt excluding public sector banks (PSND ex) represents the amount of money the public sector owes to private sector organisations including overseas institutions, largely as a result of issuing gilts and Treasury Bills, less the amount of cash and other short-term assets it holds. Public sector net debt is often referred to by commentators as “national debt”.
While borrowing (or the deficit) represents the difference between total spending and receipts over a period of time, debt represents the total amount of money owed at a point in time.
The debt has been built up by successive government administrations over many years. When the government borrows (that is, runs a deficit), this normally adds to the debt total. So reducing the deficit is not the same as reducing the debt.
Back to table of contents3. What’s changed in this release?
This section presents information on aspects of data or methodology that have been introduced or improved since the publication of the previous bulletin (22 May 2019), along with supporting information users may find useful.
Accounting for student loans
In December 2018, we announced our decision to replace the current treatment of student loans in the public sector finances (PSF) statistics with a treatment that better reflects the government’s financial position.
In Section 11, Looking ahead, of this bulletin we have published our initial estimates of the impacts of the changes to our student loan methodology on both public sector net borrowing and net financial liabilities.
Further, we have presented our initial estimates of all the methodology changes planned to be introduced in September 2019, in Tables 3 and 4 in Section 11 of this release, with the intention of increasing the detail of these data changes further each month as more data become available.
Bank of England Asset Purchase Facility Fund
In last month’s bulletin, we announced that in conjunction with HM Treasury we would be reviewing our recording of the public sector neutral dividends transferred from the Bank of England Asset Purchase Facility Fund (BEAPFF) to HM Treasury.
This has shown that interest payments on the outstanding Asset Purchase Facility (APF) loan have been overestimated in months when dividends are transferred to HM Treasury, as a result of a misinterpretation of the underlying administrative data.
Previously, in months when the Bank of England Monetary Policy Committee (MPC) did not meet, a cash interest payment was imputed on the loan, deducting it from the dividend payment to central government. We have revised our dividend payments from April 2016 onwards, adjusting these payments up by the previously imputed interest payments (which are now recorded as zero in months when the MPC does not meet).
This month we have therefore increased the dividend payments from BEAPFF to HM Treasury by £0.2 billion, £0.7 billion and £1.7 billion in the financial years ending March 2017, 2018 and 2019 respectively.
As with other such transfers, central government net borrowing in this period was reduced by an amount equivalent to the transfer, while the net borrowing of Bank of England was increased by an equal and offsetting amount, with no impact on public sector net borrowing.
International Monetary Fund’s Government Finance Statistics framework in the public sector finances
In July 2018, we announced our intention to publish supplementary tables compliant with the International Monetary Fund’s (IMF) Government Finance Statistics framework. This is to provide users with a wider view of public sector assets and liabilities in accordance with the recommendation in the IMF’s Fiscal Transparency Evaluation for the UK and as described in HM Treasury’s Managing Fiscal Risks Report. Alongside this bulletin, we have introduced new supplementary tables that are compliant with the Government Finance Statistics Manual 2014: GFSM 2014 (PDF, 4.54MB) presentation.
This month, we have introduced the balance sheet, statement of operations and statement of other economic flows. These tables are published as an appendix to this release, titled International Monetary Fund’s Government Finance Statistics Framework in the public sector finances: Appendix E. We will continue to refine these statements and further align the underlying methodology with the GFSM 2014.
Our methodological article, International Monetary Fund’s Government Finance Statistics Framework in the public sector finances accompanies these tables. It provides an overview of the IMF’s framework, explains differences to the national accounts framework, provides information on data sources and quality, and details our future plans.
Back to table of contents4. Are our figures likely to change over time?
Data for the most recent months
The data for the latest month of every release contain some forecast data. The initial outturn estimates for the early months of the financial year, particularly April, contain more forecast data than other months, as profiles of tax receipts, along with departmental and local government spending are still provisional. This means that the data for these months are typically more prone to revision than other months and can be subject to sizeable revisions in later months.
Data for the most recent financial year
Borrowing in the latest full financial year (April 2018 to March 2019) was £24.0 billion, a £0.7 billion reduction on our first estimate of £24.7 billion (published on 24 April 2019). These are not final figures and will be revised over the coming months as we replace our initial estimates with provisional and then final outturn data.
Revisions to the first reported estimate of public sector net borrowing: Appendix F summarises revisions to the first estimate of public sector borrowing (excluding public sector banks) by sub-sector for the last six financial years. Revisions are shown at 6 and 12 months after year-end.
For example, when we first published our estimate of public sector net borrowing (PSNB ex) for the financial year ending March 2018 (April 2017 to March 2018) in April 2018, we estimated it as £42.6 billion. In April 2019, or 12 months later, we presented a revised estimate of £41.8 billion, £0.8 billion lower than our initial estimate.
We have published an article, Public sector finances – sources summary and their timing (PDF, 22.8KB), which provides a brief summary of the different sources used and the implications of using those data in the monthly Public sector finances (PSF) statistical bulletin.
Figures expressed as a ratio of gross domestic product
At the end of each financial year, while data for current budget deficit, net investment and net borrowing for the final quarter of the financial year (January to March) are first published, gross domestic product (GDP) for the corresponding period is not yet finalised. To enable us to publish estimates of these figures as ratios of GDP for the latest full financial year, the final quarter of the GDP denominator is estimated based on forecasts produced by the Office for Budget Responsibility (OBR).
This estimate of GDP is used in the March, April and May datasets and revised in the June dataset published in July.
Back to table of contents5. How much is the public sector borrowing?
In May 2019, the public sector spent more money than it received in taxes and other income, meaning it had to borrow £5.1 billion, £1.0 billion more than in May 2018.
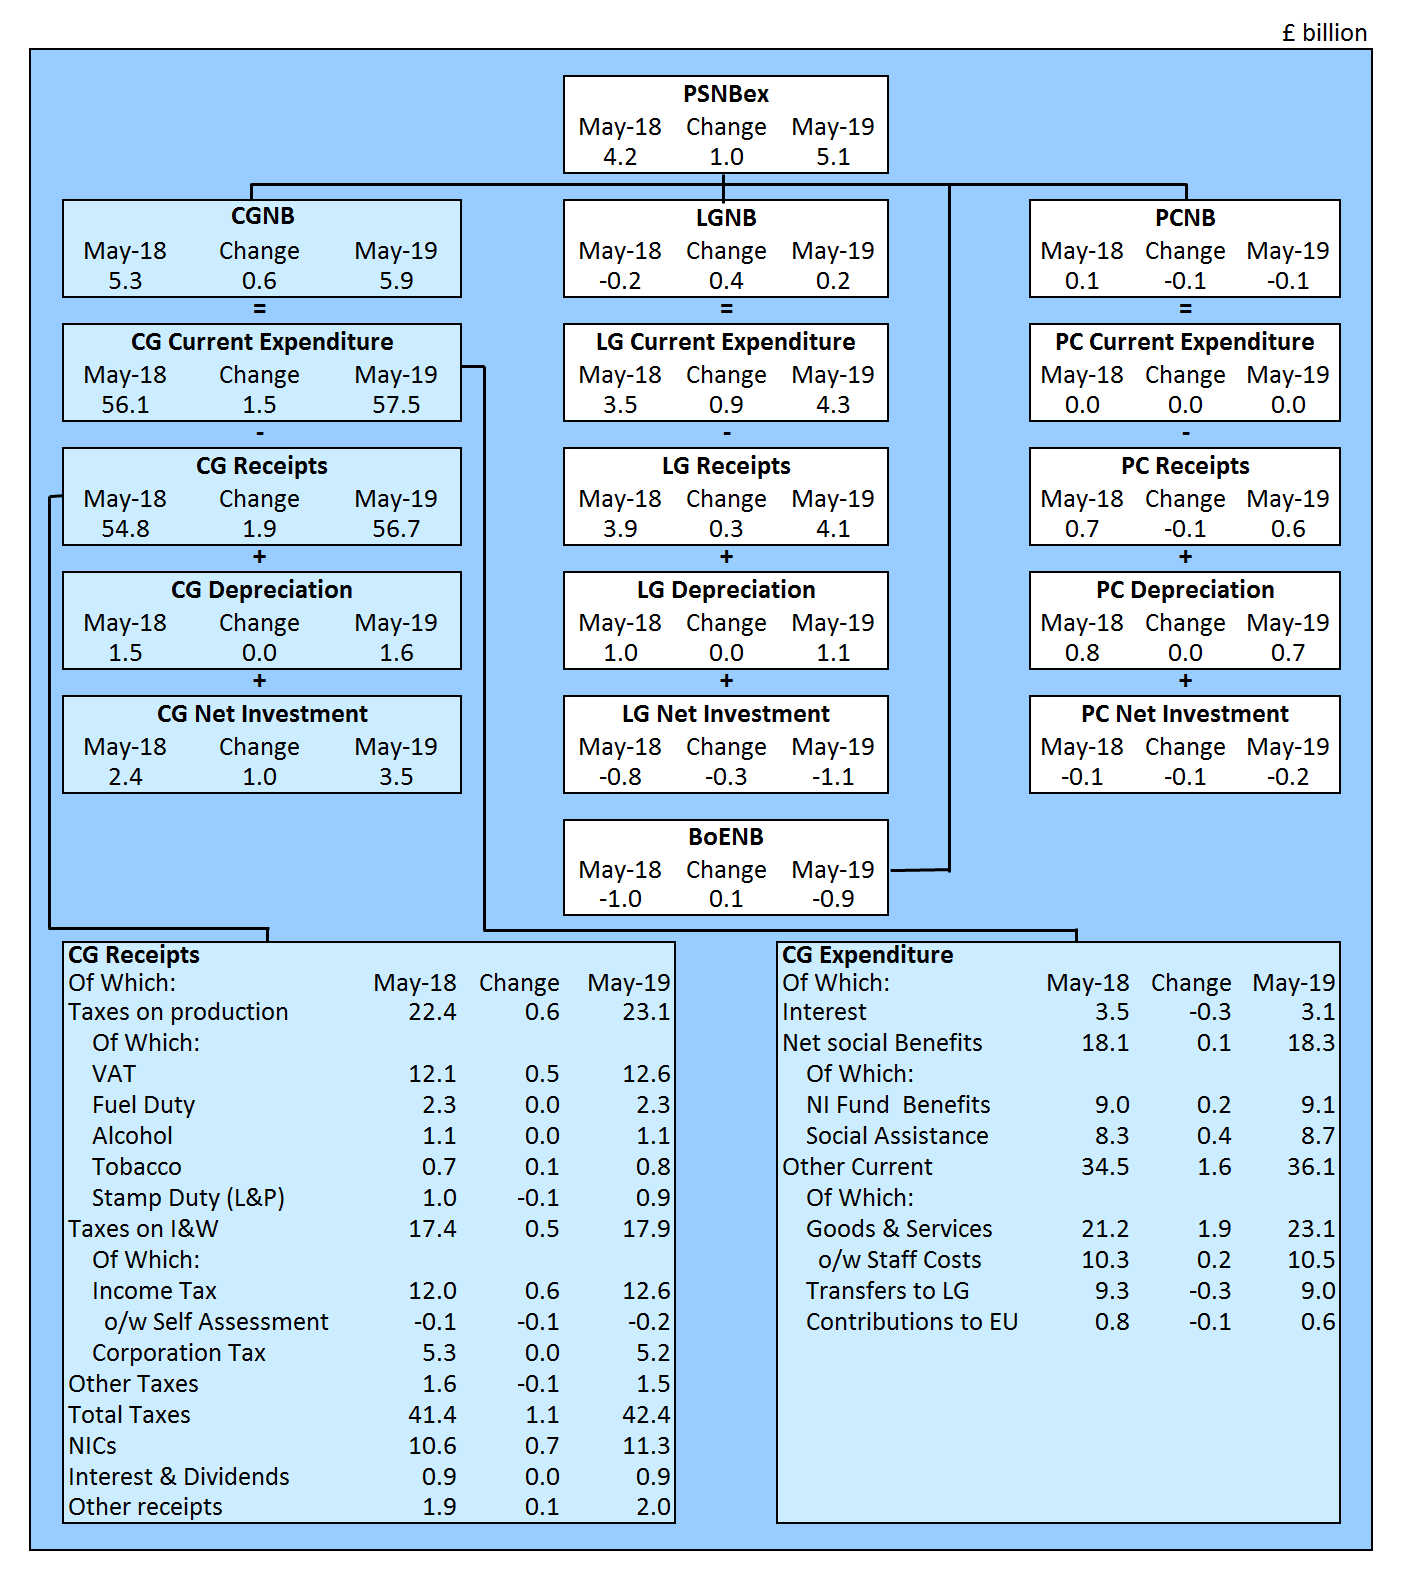
Figure 1 summarises public sector borrowing by sub-sector in May 2019 and compares this with the equivalent measures in the same month a year earlier (May 2018). This presentation splits public sector net borrowing excluding public sector banks (PSNB ex) into each of its four sub-sectors: central government, local government, public corporations and Bank of England.
Central government receipts in May 2019 increased by £1.9 billion (or 3.5%) compared with May 2018, to £56.7 billion, while total central government expenditure increased by £2.5 billion (or 4.2%) to £61.0 billion.
Much of this annual growth in central government receipts in May 2019 came from Income Tax-related revenue, with Income Tax and National Insurance contributions increasing by £0.6 billion and £0.7 billion respectively compared with May 2018.
This month, accrued receipts of Value Added Tax (VAT) increased by £0.5 billion compared with May 2018, while Corporation Tax (CT) receipts fell by £0.1 billion over the same period. It is important to note that both of these taxes contain forecast cash receipts data and are liable to revision as actual cash receipts data are received.
Over the same period, there was a notable increase in expenditure on goods and services of £1.9 billion.
Interest payments on the government’s outstanding debt decreased by £0.3 billion compared with May 2018, due largely to movements in the Retail Prices Index (RPI) to which index-linked bonds are pegged. The relationship between the RPI and the valuation index-linked bonds is explored further in the public sector finances Quality and Methodology Information report.
Both the local government and public corporations data for May 2019 are initial estimates, based largely on the Office for Budget Responsibility (OBR) forecasts. While both current and capital transfers between these sectors and central government are based on administrative data supplied by HM Treasury.
Figure 1: How each sector contributes to the growth in monthly borrowing
May 2019, compared with May 2018, UK
Source: Office for National Statistics – Public Sector Finances
Notes:
- PSNBex - Public sector net borrowing excluding public sector banks.
- CGNB - Central government net borrowing.
- LGNB - Local government net borrowing.
- PCNB - Non-financial public corporations' net borrowing.
- BoENB - Bank of England net borrowing.
- L&P - Land and property.
- I&W - Income and wealth.
- Contributions to EU - UK VAT, GNI and abatement contributions to the EU budget.
- NICs - National Insurance contributions.
Download this image Figure 1: How each sector contributes to the growth in monthly borrowing
.png (130.0 kB) .xls (93.7 kB)
Because of the volatility of the monthly data, the cumulative financial year-to-date borrowing figures often provide a better indication of the position of the public finances than the individual months.
In the current financial year-to-date (April 2019 to May 2019), public sector spending exceeded the money received in taxes and other income. This meant the public sector had to borrow £11.9 billion; that is, £1.8 billion more than the same period last year.
Of this £11.9 billion borrowed by the public sector in this period, £8.0 billion related to the cost of the “day-to-day” activities of the public sector (the current budget deficit), while £3.9 billion was capital spending (or net investment), such as on infrastructure.
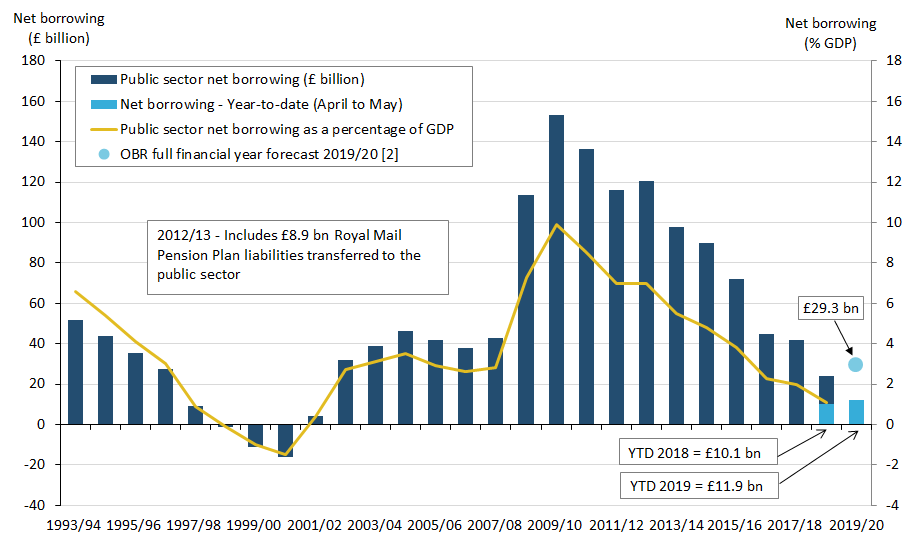
Figure 2 presents both monthly and cumulative public sector net borrowing (excluding public sector banks) in the current financial year-to-date (April 2019 to May 2019) and compares these with the same period in the previous financial year.
Figure 2: The Office for Budget Responsibility expects borrowing to increase to £29.3 billion in the financial year ending March 2020
Cumulative financial year-to-date (April 2019 and May 2019) compared with the FYE March 2019 (April 2018 to March 2019), UK
Source: Office for National Statistics – Public Sector Finances
Notes:
- OBR forecast for public sector net borrowing excluding public sector banks from March 2019 Economic and Fiscal Outlook (EFO).
Download this chart Figure 2: The Office for Budget Responsibility expects borrowing to increase to £29.3 billion in the financial year ending March 2020
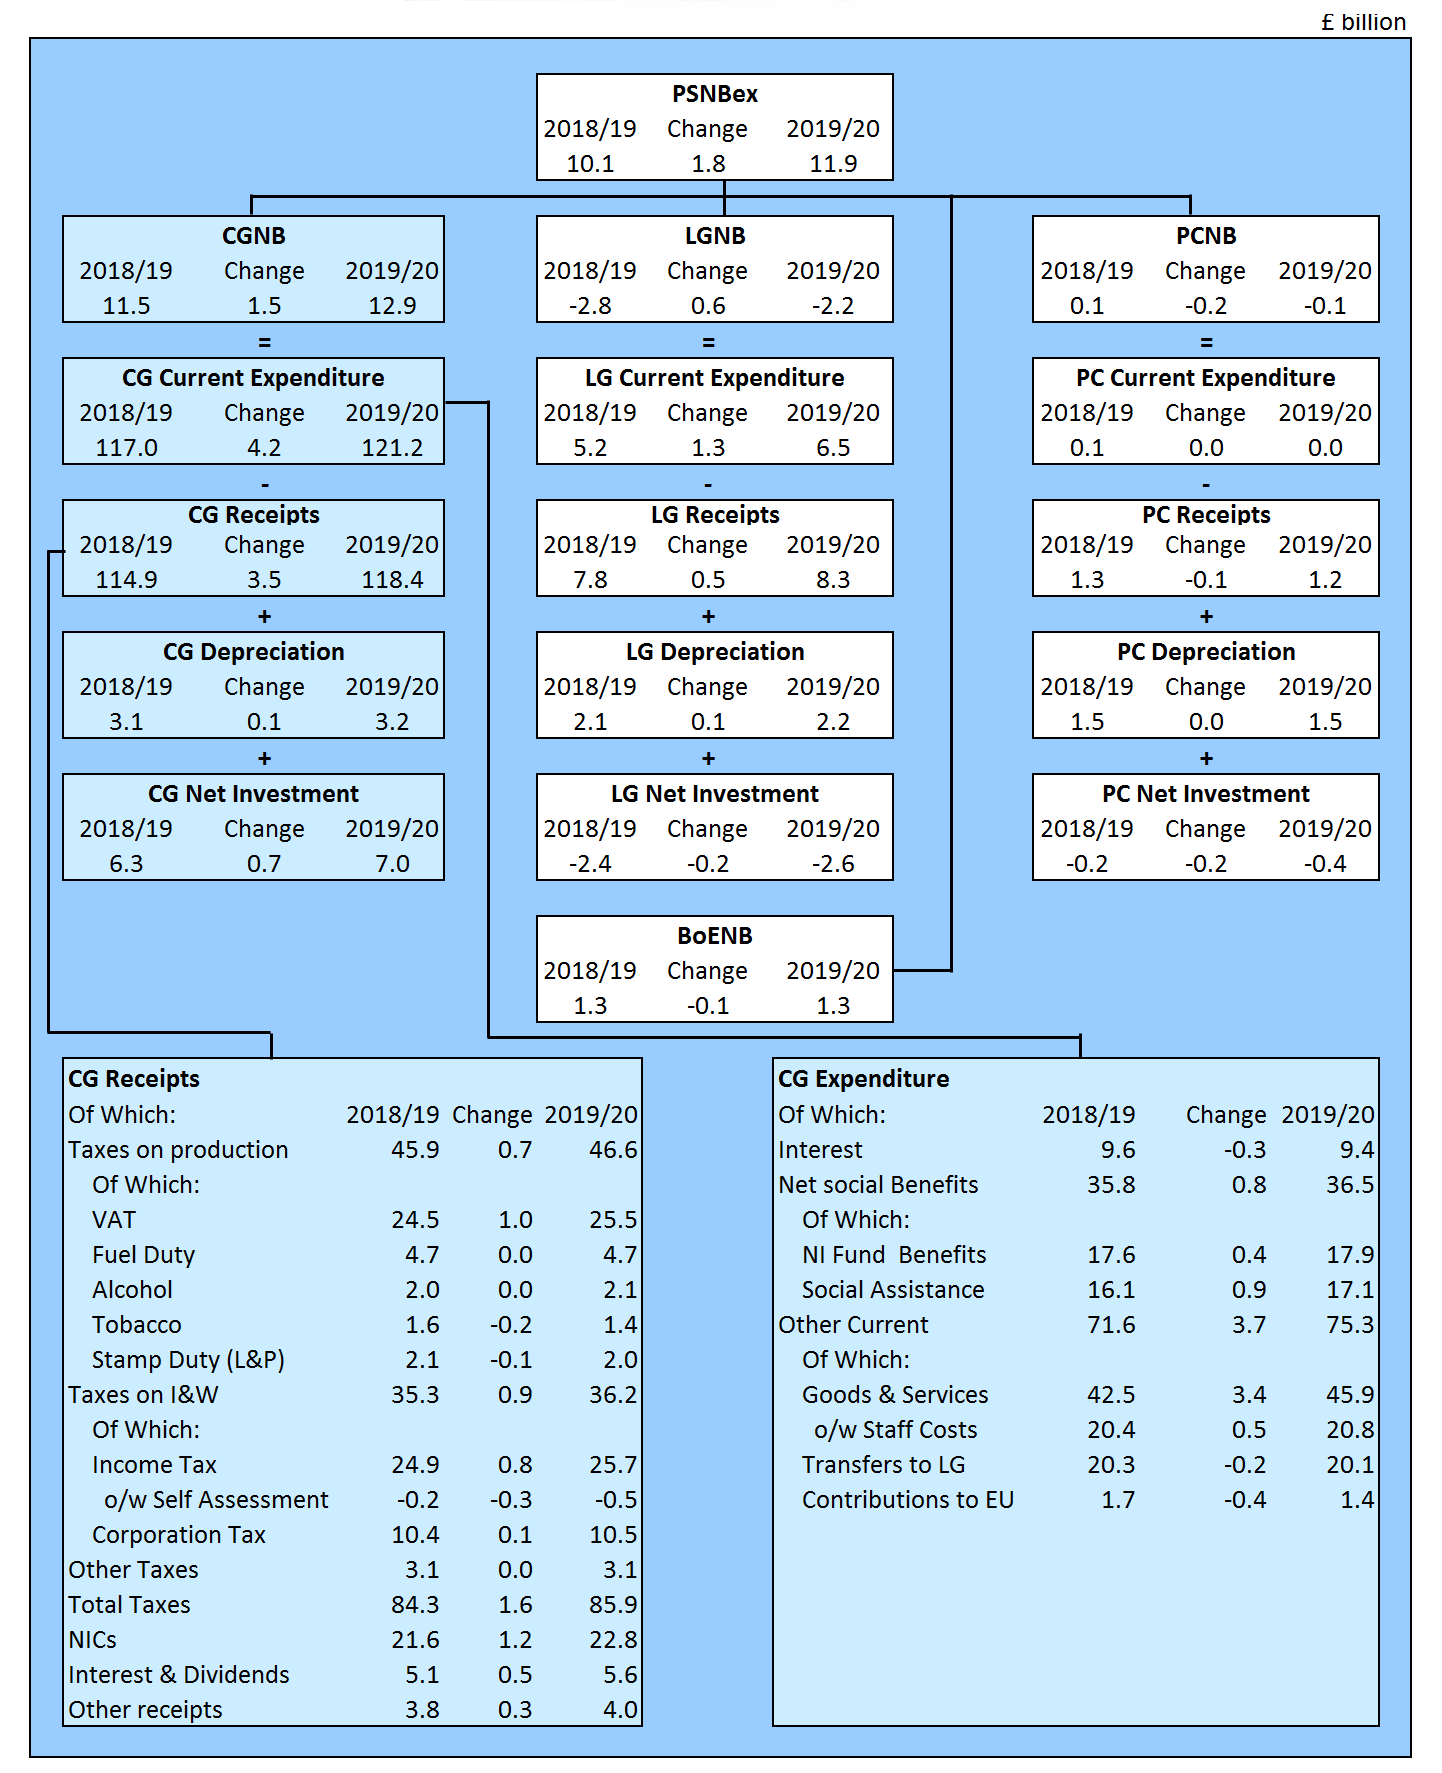
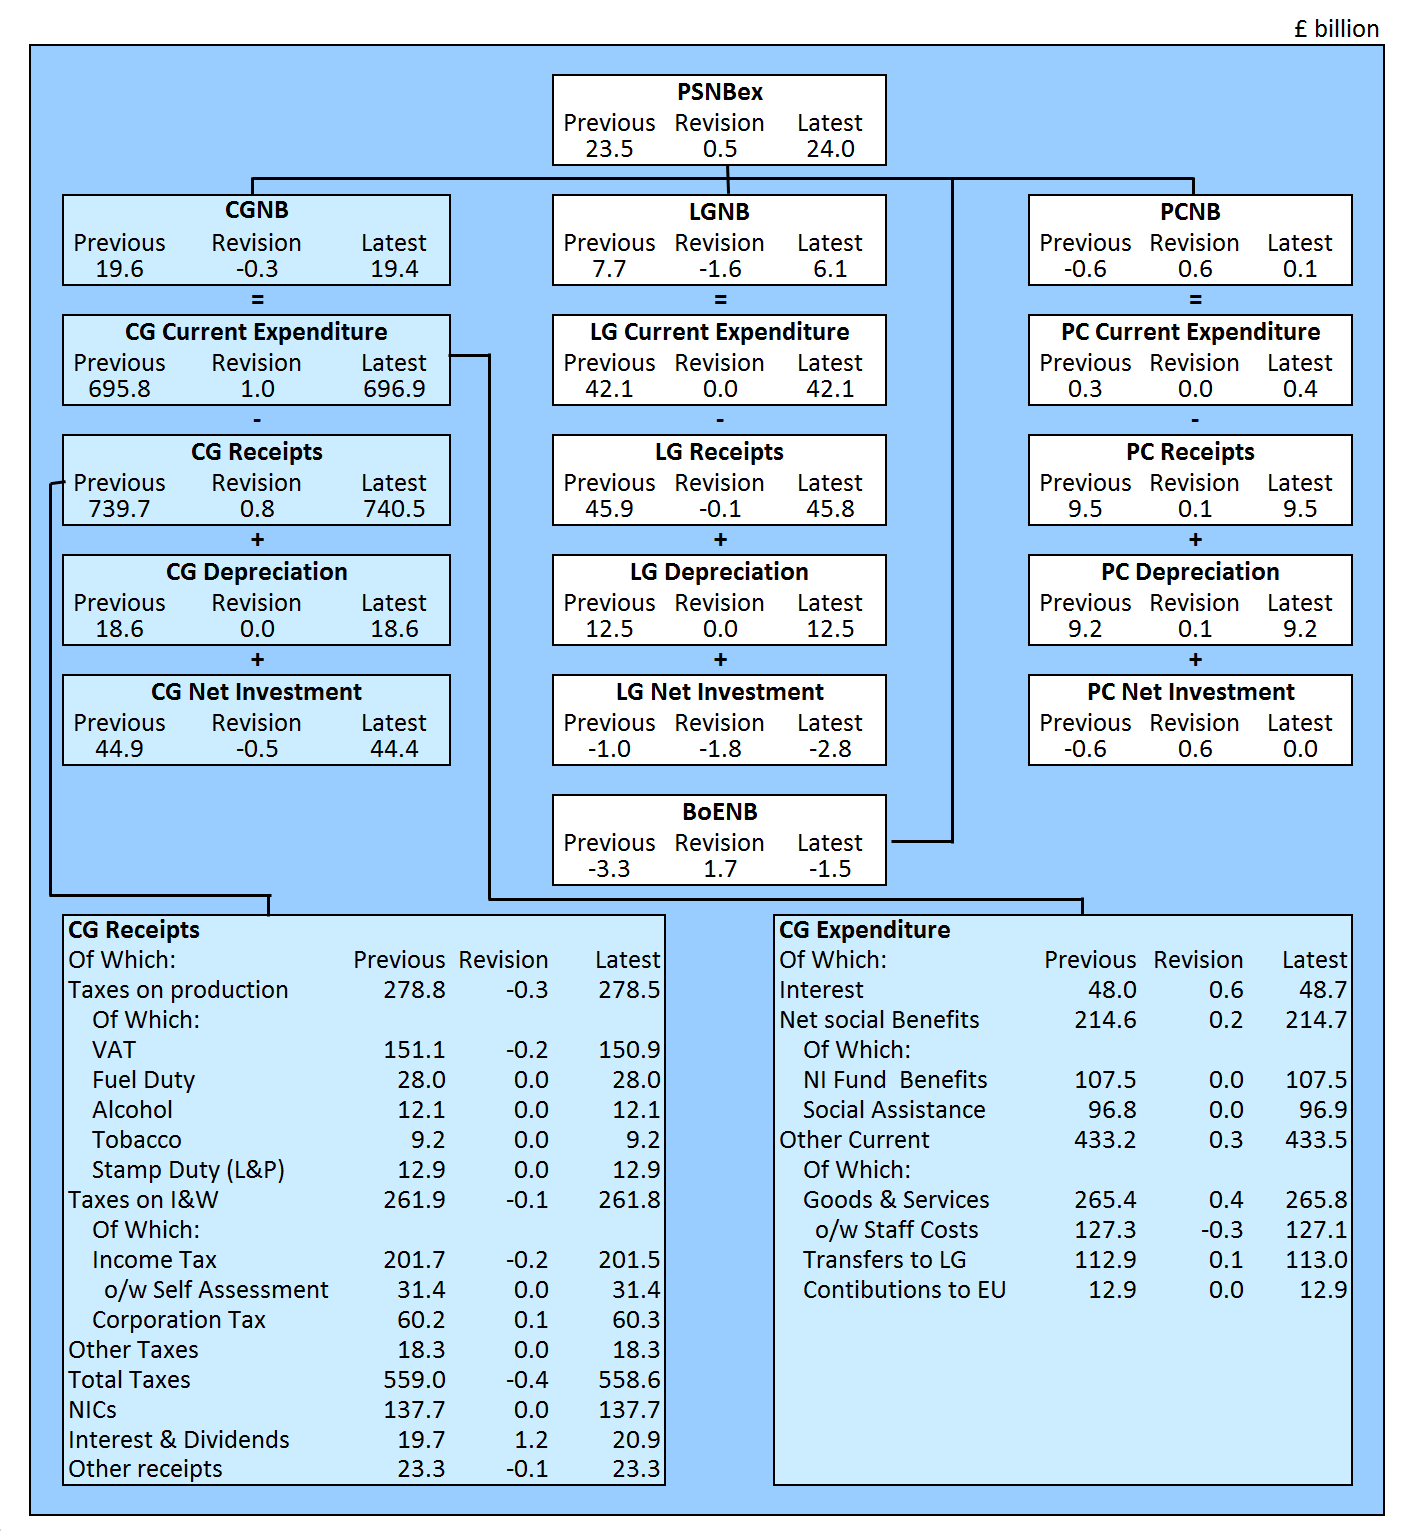
Image .csv .xlsFigure 3 summarises the contributions of each sub-sector to public sector net borrowing (excluding public sector banks) in the latest financial year-to-date (April 2019 to May 2019) and compares these with the same period last year.
The difference between central government's income and spending makes the largest contribution to the amount borrowed by the public sector. In the latest financial year-to-date, of the £11.9 billion borrowed by the public sector, £12.9 billion was borrowed by central government and £1.3 billion was borrowed by the Bank of England, while local government and public corporations were in surplus by £2.2 billion and £0.1 billion respectively.
In the latest financial year-to-date, central government received £118.4 billion in income, including £85.9 billion in taxes. This was 3.0% more than in the same period last year.
Over the same period, central government spent £128.1 billion, an increase of 3.9%. Of this amount, around two-thirds was spent by central government departments (Education, Defence, Health and Social Care), just below one-third was spent on social benefits (such as pensions, unemployment payments, Child Benefit and Maternity Pay), with the remainder being spent on capital investment and interest on government’s outstanding debt.
Figure 3: How each sector contributes to the growth in borrowing
Current financial year-to-date (April 2019 to May 2019) compared with the previous financial year-to-date, UK
Source: Office for National Statistics – Public Sector Finances
Notes:
- PSNBex - Public sector net borrowing excluding public sector banks.
- CGNB - Central government net borrowing.
- LGNB - Local government net borrowing.
- PCNB - Non-financial public corporations' net borrowing.
- BoENB - Bank of England net borrowing.
- L&P - Land and property.
- I&W - Income and wealth.
- Contributions to EU - UK VAT, GNI and abatement contributions to the EU budget.
- NICs - National Insurance contributions.
Download this image Figure 3: How each sector contributes to the growth in borrowing
.png (138.7 kB) .xls (84.0 kB)
Figure 4 illustrates that annual borrowing has been generally falling since the peak in the financial year ending (FYE) March 2010 (April 2009 to March 2010).
In the latest full financial year (April 2018 to March 2019), the £24.0 billion (or 1.1% of gross domestic product (GDP)) borrowed by the public sector was less than one-fifth (15.7%) of the amount seen in the FYE March 2010, when borrowing was £153.1 billion (or 9.9% of GDP).
Figure 4: Borrowing has been generally falling since its peak in financial year ending March 2010
Public sector net borrowing (excluding public sector banks), UK, April 1993 to May 2019
Source: Office for National Statistics – Public Sector Finances
Notes:
- Office for Budget Responsibility (OBR) full financial year forecast of £29.3 billion for public sector net borrowing excluding public sector banks in the financial year ending March 2020 (March 2019 Economic and Fiscal Outlook).
- Financial year 2018/19 represents the financial year ending 2019 (April 2018 to March 2019).
- YTD equals year-to-date (April to May).
Download this image Figure 4: Borrowing has been generally falling since its peak in financial year ending March 2010
.png (42.6 kB) .xls (93.7 kB)
6. How much does the public sector owe?
Public sector net debt (PSND ex) represents the amount of money the public sector owes to private sector organisations (including overseas institutions), that has built up by successive government administrations over many years.
When the government borrows, this normally adds to the debt total, but it is important to remember that reducing the deficit is not the same as reducing the debt.
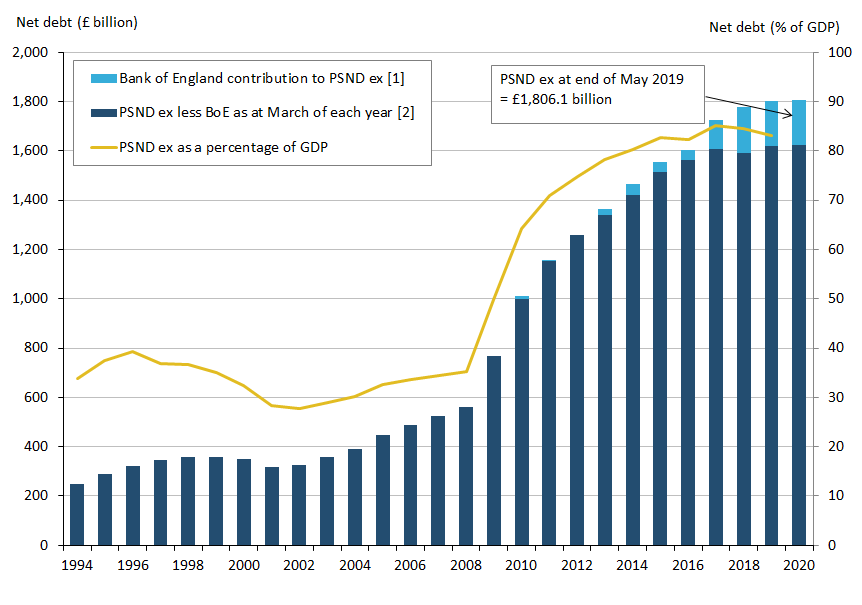
At the end of May 2019, the amount of money owed by the public sector to the private sector stood at around £1.8 trillion (Figure 5), which equates to 82.9% of the value of all the goods and services currently produced by the UK economy in a year (or gross domestic product (GDP)).
Figure 5: Debt as a percentage of gross domestic product (GDP) has been falling in recent financial years
Public sector net debt (excluding public sector banks), UK, March 1994 to the end of May 2019
Source: Office for National Statistics – Public Sector Finances
Notes:
- Includes Asset Purchase Facility (APF), which includes the Term Funding Scheme (TFS).
- Public sector net debt excluding public sector banks (PSND ex) is the combination of PSND ex Bank of England (BoE) plus BoE contribution to PSND ex.
Download this image Figure 5: Debt as a percentage of gross domestic product (GDP) has been falling in recent financial years
.png (46.9 kB) .xls (71.7 kB)
The Bank of England’s (BoE) contribution to net debt is largely a product of their quantitative easing measures, namely the Bank of England Asset Purchase Facility Fund (APF) and the Term Funding Scheme (TFS). If we were to exclude BoE from our calculation of public sector net debt (excluding public sector banks), it would reduce by £183.9 billion, from £1,806.1 billion to £1,622.2 billion, or from 82.9% of GDP to 74.4%.
Figure 6 breaks down outstanding public sector net debt at the end of May 2019 into the sub-sectors of the public sector. In addition to public sector net debt excluding public sector banks (PSND ex), this presentation includes the effect of public sector banks on debt.
Figure 6: How each sector contributes to debt, UK
At end of May 2019
Source: Office for National Statistics – Public Sector Finances
Notes:
- PSND - Public sector net debt.
- PSNDex - Public sector net debt excluding public sector banks.
- PSNDex less BoE - Public sector net debt excluding both public sector banks and Bank of England.
Download this chart Figure 6: How each sector contributes to debt, UK
Image .csv .xlsFigure 7 incorporates the borrowing components detailed in Figure 2 to illustrate how the differences between income and spending (both current and capital) have led to the accumulation of debt in the current financial year-to-date (April 2019 to May 2019).
The reconciliation between public sector net borrowing and net cash requirement is presented in more detail in Table REC1 in the Public sector finances Tables 1 to 10: Appendix A dataset.
Figure 7: How the differences in expenditure and receipts affect public sector net debt (excluding public sector banks), UK

Source: Office for National Statistics – Public Sector Finances
Notes:
- Cash transactions in (non-financing) financial assets which do not impact on net borrowing.
- Timing differences between cash and accrued data.
- Revaluation of foreign currency debt (for example, foreign currency) Debt issuances or redemptions above or below debt valuation (for example, bond premia/discounts and capital uplifts). Changes in volume of debt not due to transactions (for example, sector reclassification).
Download this image Figure 7: How the differences in expenditure and receipts affect public sector net debt (excluding public sector banks), UK
.png (133.1 kB) .xls (63.0 kB)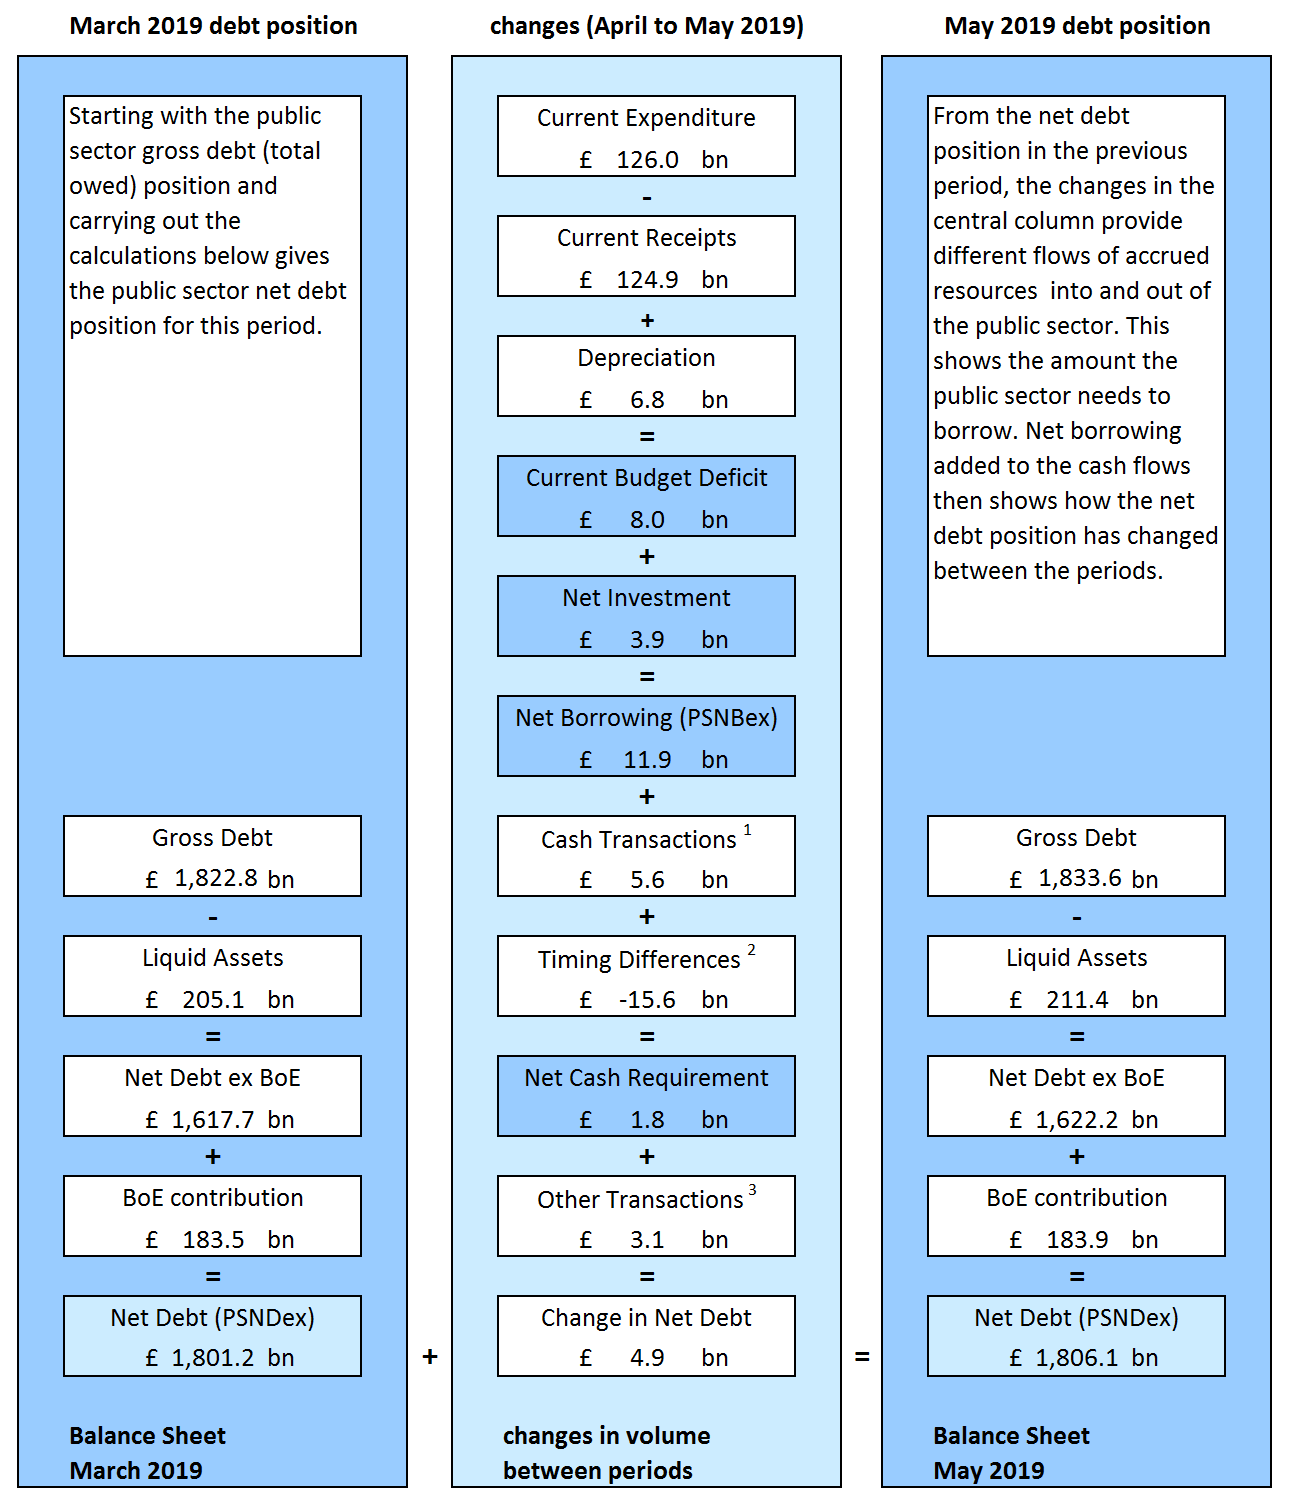
7. Revisions since the previous release
Revisions can be the result of both updated data sources and methodology changes. This month, revisions to public sector net borrowing are a result of updated data.
Table 1 presents the revisions to the headline statistics presented in this bulletin compared with those presented in the previous publication (published on 22 May 2019).
| £ billion¹ (not seasonally adjusted) | ||||||||
|---|---|---|---|---|---|---|---|---|
| Net borrowing | ||||||||
| Period | CG² | LG³ | NFPCs⁴ | BoE⁵ | PSNB ex⁶ | PSND ex⁷ | PSND % of GDP | PSNCR ex⁸ |
| 2015/16 | 0.0 | 0.0 | 0.0 | 0.0 | 0.0 | 0.0 | 0.0 | 0.0 |
| 2016/17 | -0.2 | 0.0 | 0.0 | 0.2 | 0.0 | 0.0 | 0.0 | 0.0 |
| 2017/18 | -0.7 | 0.0 | 0.0 | 0.7 | 0.0 | 0.0 | 0.0 | 0.0 |
| 2018/19 | -0.3 | -1.6 | 0.6 | 1.7 | 0.5 | 0.4 | 0.0 | 0.1 |
| 2019 Apr | 0.2 | 0.4 | 0.0 | 0.4 | 1.0 | 0.2 | 0.0 | 0.2 |
Download this table Table 1: Revisions to main aggregates
.xls .csvRevisions to public sector net borrowing (excluding public sector banks) in April 2019
The data for the latest month of every release contain some forecast data. The initial outturn estimates for the early months of the financial year, particularly April, contain more forecast data than other months, as profiles of tax receipts, along with departmental and local government spending are still provisional. This means that the data for these months are typically more prone to revision than other months and can be subject to sizeable revisions in later months.
Public sector net borrowing excluding public sector banks (PSNB ex) in April 2019 has been revised up by £1.0 billion compared with figures presented in the previous bulletin (published on 22 May 2019). Of this, the central and local government borrowing increased by £0.2 billion and £0.4 billion respectively, while the borrowing of the Bank of England (BoE) increased by £0.4 billion.
In the central government sector, current transfer receipts from BoE increased by £0.4 billion. This increase in central government revenue is offset at a public sector level by a corresponding increase in BoE expenditure, increasing BoE borrowing by £0.4 billion.
Over the same period, estimates for central government current expenditure increased by £1.2 billion, due in part to a £0.7 billion increase in current transfers paid abroad. Capital expenditure (net investment) decreased by £0.6 billion, due largely to both a decrease in gross capital formation of £0.2 billion and a £0.2 billion decrease in capital transfers to the private sector.
Local government net borrowing was revised up by £0.4 billion, because of changes in transfer data received from central government. These revisions were offset at a public sector level.
Figure 8 breaks down the revision to PSNB ex in April 2019 by each of its four sub-sectors: central government, local government, non-financial public corporations and BoE.
Figure 8: How each sector contributes to the revision in monthly borrowing
Latest data covering the month of April 2019, compared with that presented in the previous bulletin (22 May 2019), UK

Source: Office for National Statistics – Public Sector Finances
Notes:
- PSNBex - Public sector net borrowing excluding public sector banks.
- CGNB - Central government net borrowing.
- LGNB - Local government net borrowing.
- PCNB - Non-financial public corporations' net borrowing.
- BoENB - Bank of England net borrowing.
- L&P - Land and property.
- I&W - Income and wealth. 8 Contributions to EU - UK VAT, GNI and abatement contributions to the EU budget.
- NICs - National insurance contributions.
Download this image Figure 8: How each sector contributes to the revision in monthly borrowing
.png (119.6 kB) .xls (93.7 kB)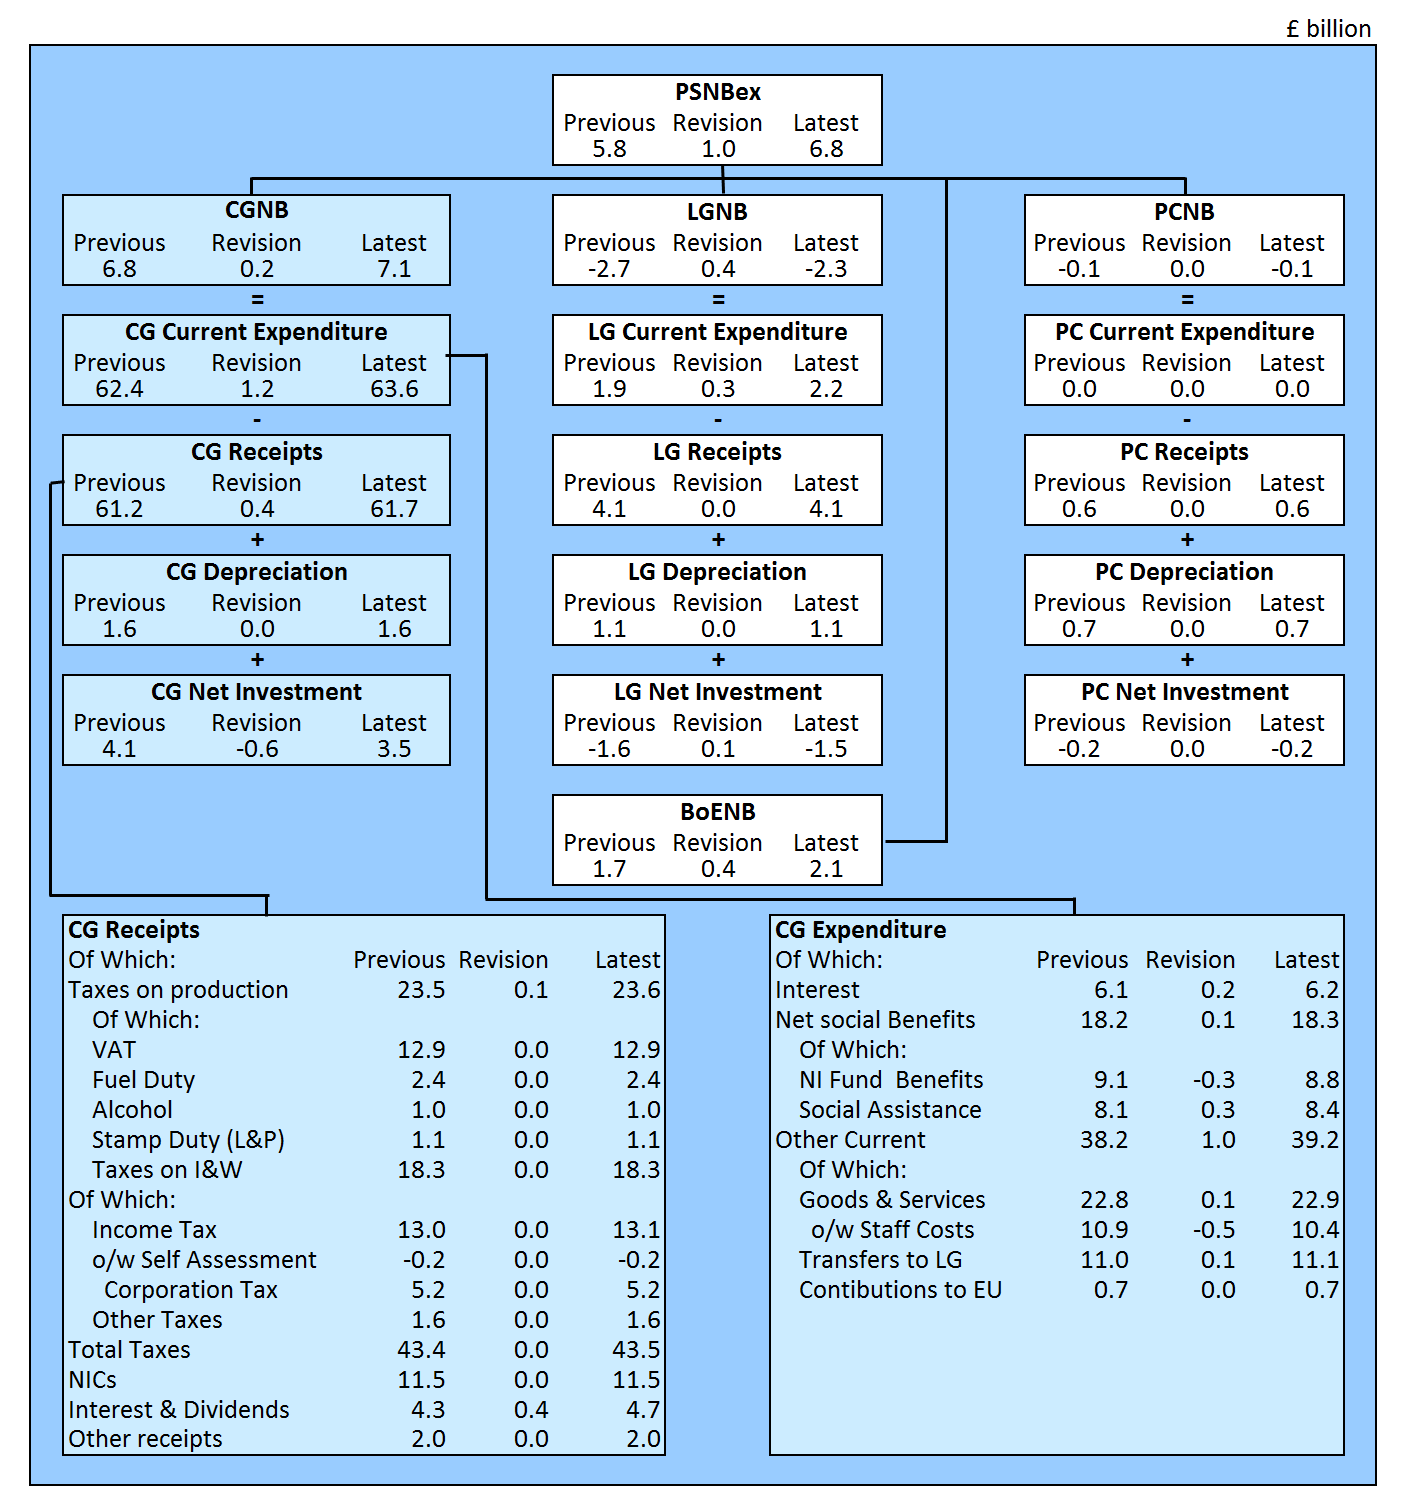
Revisions to public sector net borrowing (excluding public sector banks) in the financial year ending March 2019 (April 2018 to March 2019)
This bulletin presents the third estimate of UK public sector finances for the financial year ending March 2019; these are not final figures and will be revised over the coming months as we replace our initial estimates with provisional and then final outturn data.
Public sector net borrowing excluding public sector banks (PSNB ex) in the period April 2018 to March 2019 has been revised up by £0.5 billion compared with figures presented in the previous bulletin (published on 22 May 2019). Of this, the central and local government borrowing decreased by £0.3 billion and £1.6 billion respectively, while the borrowing of public corporations and the Bank of England (BoE) increased by £0.6 billion and £1.7 billion respectively.
Again, in the central government account there was a £1.7 billion increase in current transfer receipts from BoE. This increase in central government revenue is offset at a public sector level by a corresponding increase in BoE expenditure, increasing BoE borrowing by £1.7 billion. This £1.7 billion increase to central government interest and divided receipts was partially offset by a £0.5 billion fall in other interest and divided receipts.
Looking at the central government account in more detail, since our last publication, central government receipts have increased by £0.8 billion, with accrued VAT receipts decreasing by £0.2 billion, as forecast cash data are replaced by cash revenue. Further, taxes on both tobacco and income have reduced by £0.1 billion and £0.2 billion respectively.
Previous estimates of current expenditure on central government debt interest, expenditure on goods and services, and net social benefits have been increased by £0.6 billion, £0.3 billion and £0.2 billion respectively against previous estimates. On the capital expenditure side, a £1.4 billion decrease to the estimate of net capital transfers between central government and the private sector has been partially offset by a £0.6 billion increase to gross capital formation. Our data for capital transfers between central government and the private sector remain provisional and we expect further revisions in the coming months.
Local government borrowing across the financial year ending March 2019 has fallen by £1.6 billion, due largely to a reduction of £1.2 billion to gross fixed capital formation in the final quarter of the financial year. A reduction of £0.5 billion in capital transfers from local government to public corporations has resulted in a reduction in local government net investment and a corresponding equal and offsetting increase to public corporations’ net investment.
Figure 9 breaks down the revision to PSNB ex in the latest full financial year (April 2018 to March 2019) by each of its four sub-sectors: central government, local government, non-financial public corporations and BoE.
Figure 9: How each sector contributes to the revision in financial year borrowing
Latest full financial year (April 2018 to March 2019), compared with that presented in the previous bulletin (22 May 2019), UK
Source: Office for National Statistics – Public Sector Finances
Notes:
- PSNBex - Public sector net borrowing excluding public sector banks.
- CGNB - Central government net borrowing.
- LGNB - Local government net borrowing.
- PCNB - Non-financial public corporations' net borrowing.
- BoENB - Bank of England net borrowing.
- L&P - Land and property.
- I&W - Income and wealth. 8 Contributions to EU - UK VAT, GNI and abatement contributions to the EU budget.
- NICs - National insurance contributions.
Download this image Figure 9: How each sector contributes to the revision in financial year borrowing
.png (126.8 kB) .xls (91.1 kB)
Revisions to public sector net debt excluding public sector banks
Public sector net debt excluding public sector banks (PSND ex) at the end of April 2019 has been revised up by £0.2 billion compared with that presented in the previous bulletin (published on 22 May 2019), due largely to a £0.2 billion reduction in local government liquid assets.
Revisions to public sector net borrowing, net cash requirement and net debt including public sector banks
Estimates of the net borrowing, net cash requirement and net debt of public sector banks are derived from both the profit and loss account and balance sheet of these organisations, supplied to us by the Bank of England twice annually.
This month we received the profit and loss, and balance sheet data covering the period January to June 2018 for the first time. These data have enabled us to update previous estimates of the net borrowing, net cash requirement and net debt associated with public sector banks. Further, our estimates covering the period July 2018 to date have been updated to reflect this new information.
As a consequence of receiving these data, our estimate of:
public sector net borrowing including public sector banks for the financial year ending March 2019 (April 2018 to March 2019) has increased by £2.5 billion
public sector net cash requirement including public sector banks for the financial year ending March 2019 has increased by £5.3 billion
while our estimate of public sector net debt including public sector banks at the end of May 2019 has increased by £8.8 billion
Back to table of contents
8. How do our figures compare with official forecasts?
The independent Office for Budget Responsibility (OBR) is responsible for the production of official forecasts for government. These forecasts are usually produced twice a year, in spring and autumn.
On 13 March 2019, the government published its Spring Statement 2019. On the same day the OBR published updated forecasts for debt and borrowing, on which the Spring Statement 2019 are based.
The OBR forecasts used in this bulletin are based on those published in its Economic and Fiscal Outlook – March 2019. In this publication OBR expects public sector net borrowing (excluding public sector banks) to be £22.8 billion in the financial year ending March 2019, increasing to £29.3 billion in the financial year ending March 2020.
Table 2 compares the current outturn estimates for each of our main public sector (excluding public sector banks) aggregates for the current financial year-to-date with corresponding OBR forecasts for the following financial year. Further, it compares the latest full financial year (April 2018 to March 2019) outturn estimates with those of the previous financial year.
Caution should be taken when comparing public sector finances data with OBR figures for the full financial year. Data are not finalised until some time after the financial year ends, with initial estimates made soon after the end of the financial year often subject to sizeable revisions in later months as forecasts are replaced with audited outturn data.
There may also be known methodological differences between OBR forecasts and outturn data.
| Excluding public sector banks | £ billion¹ (not seasonally adjusted) | |||||
|---|---|---|---|---|---|---|
| Financial year-to-date⁷ | Full financial year | |||||
| 2018/19 | 2019/20 | % change | 2018/19⁸ Outturn | 2019/20 OBR Forecast⁹ | % change | |
| Current budget deficit² | 6.4 | 8.0 | 25.4 | -17.6 | -17.7 | 0.5 |
| Net investment³ | 3.8 | 3.9 | 4.9 | 41.7 | 47.0 | 12.8 |
| Net borrowing⁴ | 10.1 | 11.9 | 17.8 | 24.0 | 29.3 | 22.2 |
| Net debt⁵ | 1,781.1 | 1,806.1 | 1.4 | 1,801.2 | 1,838.2 | 2.1 |
| Net debt as a percentage of GDP⁶,¹⁰ | 84.3 | 82.9 | -1.4 | 83.1 | 82.2 | -0.9 |
Download this table Table 2: Latest outturn estimates compared with Office for Budget Responsibility forecasts
.xls .csv9. International comparisons of borrowing and debt
The UK government debt and deficit statistical bulletin is published quarterly (in January, April, July and December each year), to coincide with when the UK and other EU member states are required to report on their deficit (or net borrowing) and debt to the European Commission.
On 17 April 2019, we published UK government debt and deficit: December 2018, consistent with Public sector finances, UK: February 2019 (published on 21 March 2019). In this publication we stated that:
general government gross debt was £1,837.5 billion at the end of December 2018, equivalent to 86.7% of gross domestic product (GDP); 26.7 percentage points above the Maastricht reference value of 60%
general government deficit (or net borrowing) was £32.3 billion in the calendar year ending December 2018, equivalent to 1.5% of GDP; 1.5 percentage points below the Maastricht reference value of 3%
This month we publish largely unchanged data to those published on 17 April 2019, with the estimate of general government debt as a percentage of GDP in the calendar year ending December 2018 increasing by 0.1 percentage points.
It is important to note that the GDP measure used as the denominator in the calculation of the debt ratios in the UK government debt and deficit statistical bulletin, differs from that used within the Public sector finances statistical bulletin.
Back to table of contents10. Quality and methodology
The public sector finances Quality and Methodology Information report contains important information on:
the strengths and limitations of the data and how it compares with related data
uses and users of the data
how the output was created
the quality of the output including the accuracy of the data
The Public sector finances methodological guide provides comprehensive contextual and methodological information concerning the monthly Public sector finances statistical bulletin.
The guide sets out the conceptual and fiscal policy context for the bulletin, identifies the main fiscal measures and explains how these are derived and inter-related. Additionally, it details the data sources used to compile the monthly estimates of the fiscal position.
Local government forecasts
In recent years, planned expenditure initially reported in local authority budgets has systematically been higher than the final outturn expenditure reported in the audited accounts. We therefore include adjustments to reduce the amounts reported at the budget stage.
Further information on these and additional adjustments can be found in the public sector finances Quality and Methodology Information report.
Back to table of contents11. Looking ahead
This section presents information on aspects of data or methodology that are planned but not yet included in the public sector finances.
Looking ahead – developments in public sector finance statistics
On 31 May 2019, we published the second in our series of development articles, Looking ahead – developments in public sector finance statistics: 2019. In this article we listed a number of short-term areas of work that we aim to implement in public sector finances (PSF) statistics within 18 months from the date of this publication, including:
treatment of student loans
presentation of pension data on a gross basis
International Monetary Fund’s Government Finance Statistics framework
treatment of depreciation
continuous development of public sector net financial liabilities
recording of leases
The article also provides some detail on the areas of planned medium and longer-term development.
Developments in public sector finances statistics: planned for September 2019
This section presents information on aspects of data or methodology that are planned for implementation in September 2019. We have also presented our initial estimates of revisions to public sector net borrowing, net debt and net financial liability.
Student loans in public sector finances: A methodological guide
In December 2018, we announced our decision to replace the current treatment of student loans in the PSF statistics with a treatment that better reflects government’s financial position. This new approach, described in our methodology article Student loans in public sector finances: a methodological guide, published on 21 June 2019, recognises that a significant proportion of student loan debt will never be repaid by recording government expenditure related to the cancellation of student loans in the period that loans are issued rather than decades afterwards.
When we announced our initial decision, we estimated (based on Office for Budget Responsibility (OBR) calculations) that introducing the new treatment would increase public sector net borrowing (PSNB) by approximately £12 billion in the financial year ending March 2019. Since December 2018, we have worked with the Department for Education to develop and refine the modelling that underlies these estimates. Following this work our latest estimate of the impact on PSNB in the financial year ending March 2019 is that it will be increased by £10.6 billion.
Public sector net financial liabilities (PSNFL) at the end of March 2019 are also expected to increase by £59.2 billion, reflecting the lower value of the loan asset held by government. On the other hand, public sector net debt (PSND) is invariant to the student loan treatment, being affected only by the levels of cash extended to borrowers at inception and repaid by them in consequent time periods.
Presentation of pension data
In September 2019, we will be changing the way in which we present funded public employment-related pension schemes in our PSF statistics. In addition to our current presentation, which recognises the public sector’s liability for the pension scheme deficit, we will extend to include pension schemes themselves (and all their assets and liabilities) and the Pension Protection Fund within the public sector boundary.
While the change is mainly of presentational nature, we expect public sector net debt (PSND) at the end of March 2018 to decrease by £31 billion as a result of the consolidation of pension schemes’ gilt holdings and liquid assets. Public sector net financial liabilities (PSNFL) at the end of March 2018 will also decrease by around £9 billion, owing to the conventions followed in the valuation of government debt.
When recognised as a government liability, debt securities are recorded on a face value basis, which represents the amount due to be repaid. However, in the pension fund’s balance sheet, the recording of debt securities issued by government is done on a market value basis. As a result, the consolidation process is not completely neutral in its impact on public sector net financial liabilities.
Finally, public sector net borrowing (PSNB) will be affected by a wider range of transactions related to pensions, including instances when pensions schemes enter the Pension Protection Fund.
Impact tables for changes to be implemented in September 2019
This section presents our initial estimates of revisions to public sector net borrowing (Table 3) and net financial liability (Table 4) from our planned methodology and data changes due to be introduced in September 2019.
The impact of these changes is still being assessed and it is our intention to further populate these tables over the coming months as further detail becomes available
| £ billion (not seasonally adjusted) | |||||||
|---|---|---|---|---|---|---|---|
| Public sector net borrowing ex | Student loans¹,² | Public sector funded pension schemes³ | Capital Consumption³ | Other³ | Public sector net borrowing ex | Public sector net borrowing ex as a %of GDP | |
| 1997/98 | 9.1 | 0.0 | - | - | - | 9.1 | 0.9 |
| 1998/99 | -1.1 | 0.0 | - | - | - | -1.1 | -0.1 |
| 1999/00 | -11.0 | 0.1 | - | - | - | -10.9 | -1.0 |
| 2000/01 | -16.1 | 0.1 | - | - | - | -16.0 | -1.5 |
| 2001/02 | 4.4 | 0.1 | - | - | - | 4.5 | 0.4 |
| 2002/03 | 32.1 | 0.1 | - | - | - | 32.2 | 2.7 |
| 2003/04 | 38.8 | 0.1 | - | - | - | 38.9 | 3.1 |
| 2004/05 | 46.1 | 0.2 | - | - | - | 46.3 | 3.5 |
| 2005/06 | 41.6 | 0.2 | - | - | - | 41.7 | 2.9 |
| 2006/07 | 38.0 | 0.4 | - | - | - | 38.1 | 2.6 |
| 2007/08 | 42.9 | 0.6 | - | - | - | 43.1 | 2.8 |
| 2008/09 | 113.5 | 0.9 | - | - | - | 114.0 | 7.3 |
| 2009/10 | 153.1 | 1.5 | - | - | - | 154.2 | 10.0 |
| 2010/11 | 136.5 | 1.2 | - | - | - | 137.3 | 8.5 |
| 2011/12 | 116.3 | 1.3 | - | - | - | 117.9 | 7.1 |
| 2012/13 | 120.3 | 2.2 | - | - | - | 122.5 | 7.2 |
| 2013/14 | 97.7 | 3.7 | - | - | - | 101.1 | 5.7 |
| 2014/15 | 89.9 | 5.2 | - | - | - | 94.8 | 5.1 |
| 2015/16 | 71.8 | 6.2 | - | - | - | 76.9 | 4.0 |
| 2016/17 | 44.9 | 7.2 | - | - | - | 51.5 | 2.6 |
| 2017/18 | 41.8 | 8.9 | - | - | - | 49.7 | 2.4 |
| 2018/19 | 24.0 | 10.6 | - | - | - | 34.6 | 1.6 |
Download this table Table 3: Provisional impact of Student loans and public sector funded pension scheme changes on public sector net borrowing excluding public sector banks, UK
.xls .csv
| £ billion (not seasonally adjusted) | ||||||
|---|---|---|---|---|---|---|
| Current basis | Methods changes | New basis | ||||
| Public sector net financial liabilities¹ | Student loans²,³ | Public sector funded pension schemes⁴ | Other⁵ | Public sector net financial liabilities | Public sector net financial liabilities as a % of GDP | |
| 1997/98 | 312.3 | - | - | - | 312.3 | 31.9 |
| 1998/99 | 314.5 | 2.5 | - | - | 317.0 | 31.0 |
| 1999/00 | 282.6 | 2.7 | - | - | 285.3 | 26.5 |
| 2000/01 | 287.0 | 2.9 | - | - | 289.9 | 25.9 |
| 2001/02 | 314.0 | 2.9 | - | - | 316.9 | 27.1 |
| 2002/03 | 366.1 | 2.7 | - | - | 368.8 | 29.9 |
| 2003/04 | 384.6 | 2.8 | - | - | 387.4 | 29.8 |
| 2004/05 | 428.6 | 2.5 | - | - | 431.1 | 31.5 |
| 2005/06 | 432.3 | 2.4 | - | - | 434.7 | 30.0 |
| 2006/07 | 457.8 | 3.1 | - | - | 460.9 | 30.3 |
| 2007/08 | 507.6 | 4.1 | - | - | 511.7 | 32.3 |
| 2008/09 | 707.5 | 5.3 | - | - | 712.8 | 46.3 |
| 2009/10 | 829.9 | 6.4 | - | - | 836.3 | 53.2 |
| 2010/11 | 935.9 | 7.6 | - | - | 943.4 | 57.9 |
| 2011/12 | 1,067.5 | 9.4 | - | - | 1,076.9 | 64.2 |
| 2012/13 | 1,192.4 | 11.7 | - | - | 1,204.1 | 69.1 |
| 2013/14 | 1,271.0 | 16.1 | - | - | 1,287.1 | 70.5 |
| 2014/15 | 1,342.4 | 22.2 | - | - | 1,364.6 | 72.5 |
| 2015/16 | 1,417.8 | 29.3 | - | - | 1,447.1 | 74.3 |
| 2016/17 | 1,452.9 | 38.1 | - | - | 1,491.0 | 73.5 |
| 2017/18 | 1,415.5 | 45.1 | - | - | 1,460.6 | 69.5 |
| 2018/19 | 1,440.6 | 59.2 | - | - | 1,499.8 | 69.2 |
Download this table Table 4: Provisional impact of Student loans and public sector funded pension scheme changes on public sector net financial liabilities (PSNFL), UK
.xls .csvOngoing developments in public sector finance statistics
This section presents information on our current continuous improvement projects and methodological decisions that are planned but not yet included in the public sector finances.
Company tax credits
In conjunction with HM Revenue and Customs (HMRC), we are currently reviewing our recording of company tax credits. We will announce the findings of this review and introduce any data revisions at the earliest opportunity.
Clinical Negligence Indemnity Cover
On 1 April 2019, the government announced the Clinical Negligence Scheme for General Practice (CNSGP), operated by NHS Resolution on behalf of the Secretary of State for Health and Social Care.
The scheme provides comprehensive cover to all General Practitioners (GPs) and their wider practice team for clinical negligence relating to NHS services occurring from 1 April 2019. In parallel, the government has agreed commercial terms with the Medical Protection Society covering claims for historic NHS clinical negligence incidents of their GP members occurring at any time before 1 April 2019.
We are currently assessing the implications of this scheme on the public sector finances and will announce our findings at the earliest opportunity.
EU withdrawal agreement
Although the Office for Budget Responsibility (OBR) discusses the EU settlement in their Economic and Fiscal Outlook – March 2019 report, the details in the report are still subject to negotiation.
There is insufficient certainty at this stage for us to complete a formal assessment of impact on the UK public sector finances.
On 28 January 2019, National Statistician John Pullinger released a statement outlining our legislative preparations for a possible no-deal EU exit.
East Coast Mainline
On 16 May 2018, the government announced that from 24 June 2018, London North Eastern Railway (LNER) will take over the running of East Coast Mainline services. On 31 August 2018, we announced that LNER would be classified to the public non-financial corporations sub-sector, effective from 14 February 2018. We are currently investigating the implications of this decision and our conclusions will be announced in due course.
Carillion insolvency
Following Carillion Plc declaring insolvency on 15 January 2018, the UK government announced that it would provide the necessary funding required by the Official Receiver, to ensure continuity of public services through an orderly liquidation. The Official Receiver has been appointed by the court as liquidator, along with partners at PwC that have been appointed Special Managers. The defined benefit pension schemes of former Carillion employees are currently being assessed by the Pension Protection Fund (PPF) prior to any transition into the PPF scheme.
We are currently investigating the various impacts of the liquidation of Carillion on the public sector finances, including in relation to the public-private partnership projects in which Carillion was involved and the additional funding that the government has provided to maintain public services. We will announce our findings in due course.
Prior to liquidation, Carillion held approximately 450 contracts with government, representing 38% of Carillion’s 2016 reported revenue.
The sale of railway arches
On 11 September 2018, Network Rail announced they had agreed terms for the sale of their Commercial Estate business in England and Wales. On 4 February 2019, the National Audit Office confirmed that Network Rail had completed a £1.46 billion sale of its commercial property portfolio consisting of approximately 5,200 properties across England and Wales, mainly railway arches.
Public sector net debt at the end of February 2019 and the central government net cash requirement in February 2019 were each reduced by an amount equivalent to the cash received by central government from the sale.
We are currently investigating the nature of the transaction to ensure that the impacts will be fully reflected in the public sector finances and so it has yet to be determined whether public sector net borrowing is affected and therefore it remains unchanged.
Back to table of contents