In this section
- Disclaimer
- Main points
- Things you need to know about this release
- What is our overall aim?
- Where are we now?
- What do the Income Research Outputs measure and which population groups do they cover?
- How do our outputs compare with other sources of data on income?
- What do the outputs show?
- Method
- Annex A – Components of income
- Annex B – Information on benefits
- Annex C – Comparison with existing data sources on income and earnings
1. Disclaimer
These Research Outputs are NOT official statistics on income. Rather they are published merely as outputs from research into a different methodology to that currently used in the production of income statistics.
It is important that the information and research presented here be read alongside the outputs to aid interpretation and avoid misunderstanding. These outputs must not be reproduced without this disclaimer and warning note.
Back to table of contents2. Main points
These are the first Administrative Data Census Research Outputs on income. They are the start of the research to assess if it is feasible to produce income outputs from administrative data.
We have produced local authority level individual gross1 annual income distributions for England and Wales from personal level income and benefits data.
At this stage the Research Outputs are limited to income from the Pay As You Earn (PAYE) system and benefits (which include tax credits). Therefore, a number of components of income are missing, for example, income from self-employment and investments taxed via Self Assessment.
This publication focuses on the coverage and statistical quality of these initial Income Research Outputs from administrative sources.
Over time the Income Research Outputs will be expanded in coverage and geographical breakdown to produce multivariate outputs, such as income by ethnicity, for small areas.
We would like your feedback on this publication and our future plans. Please email Admin.Data.Census.Project@ons.gov.uk (and include the subject line "Research Outputs feedback").
Notes for Main points
- Gross income is income before deductions such as National Insurance contributions and tax.
3. Things you need to know about this release
These Research Outputs are NOT official statistics. They should not be interpreted as an indicator of poverty or living standards. Rather they are published as outputs from research into a different methodology to that currently used in the production of income statistics.
The outputs presented in this report accompany the small area model-based income estimates, which are the official estimates of overall household income for the tax year ending 2014.
The term “income” used throughout this report refers to income estimated from Pay As You Earn (PAYE) and benefits (which includes tax credits) data only.
Income recorded via Self Assessment (which includes income received from self-employment, property rental and investments) and some benefits is not included in these Research Outputs.
The outputs refer to income received during the tax year ending 2014 measured in nominal1 terms.
Notes for Things you need to know about this release
- Nominal income is not adjusted for the effects of inflation.
4. What is our overall aim?
Income is a variable that users repeatedly ask to be included on the census. The 2007 Census Test showed that the inclusion of income questions reduced overall response rates by a statistically significant 2.7 percentage points. These results were consistent with findings from the 1997 Census Test. There were also concerns raised about the quality of income data collected using the census test questionnaire and whether respondents understood, and were content to answer, income questions. As a result, an income question has never been included in UK censuses.
The 2021 Census Topic Consultation outlined our intention to explore administrative data on income. The aim is to produce income as an additional census topic by linking administrative data and surveys to the census. We also need to test whether an income variable is possible for the Administrative Data Census project. This would provide evidence to inform any recommendation we make about the future of the census in England and Wales. This initial research is currently within this Administrative Data Census context (that is, using the administrative data as the population base); however, it is also applicable for use with a census population base.
There are a number of income outputs published across the Government Statistical Service (GSS), which are discussed in the Office for National Statistics (ONS) Guide to Sources of Data on Earnings and Income. Most of these statistics are produced directly from surveys except for the ONS small area model-based income estimates (SAIE), which are produced from census, administrative and survey data. Outputs that exist across the GSS are all valuable, but they have limited scope for multivariate analysis, particularly at lower levels of geography, such as income by ethnicity or income by social class, for small areas.
Responses to the 2021 Census Topic Consultation highlighted this information gap within official statistics. A number of respondents use univariate commercial data to identify small areas of disadvantage, which may be hidden when looking at data for larger areas. The 2021 Census Income Topic Report said:
“Evidence identifies uses of income data at OA (Output Area) level; for example, Royal Borough of Kensington and Chelsea said: ‘The council also uses this data to gain an estimate of the resources required for an area and uses OA level data in most of its bespoke research. For example, a particular housing estate or a travellers site.'
Other organisations use income data at OA or LSOA (Lower Layer Super Output Area) level and require information for specific groups.
The London Borough of Camden said: 'Inequality and disadvantage are often found clustered in small areas (hence the local nature of the Indices of Deprivation at LSOA level), which are otherwise hidden, averaged out among larger areas. It could definitely help pinpoint some of the people most in need of assistance.'”
A need for multivariate (cross-tabulations) of income data with other topics was shown and there was some evidence of using commercial data combined with official data to achieve this. The 2021 Census Income Topic Report said:
“East Riding of Yorkshire Council said: 'Income data currently purchased from Experian is combined and cross-referenced with census topics such as demography, housing, economic activity, and travel flows to assist in the monitoring of income deprivation in small geographical areas.'
The Equality and Human Rights Commission (EHRC) said: ‘Income information is needed for comparison between different groups of people who share protected characteristics as identified within the Equality Act 2010 and by NS-SEC classes.’”
A need for this type of information to be provided by official statistics is highlighted through the need for comparable data. The 2021 Census Income Topic Report said:
“Users also explained about the lack of coherence between different measures. Tower Hamlets Council said: ‘...No single data source is able to supply what we need, so in practice we have to rely on a wide variety of different measures as proxy/ partial measures... we would like ONS to revisit the issue of including an income question on the census and to explore the potential of administrative data...'”
The Census Transformation Programme is conducting research to see if it is feasible to fill this gap in official statistics by using administrative data. This is the first publication towards producing multivariate, small area income outputs. Each year we hope to expand the coverage and geographical breakdown of these outputs (subject to statistical data quality and access). These outputs have been published to share initial research and collect feedback on our definitions and methods. This will help us to establish if it is feasible to produce income outputs from administrative data in the 2021 Census and, in the future, through an Administrative Data Census.
It is important to note that the outputs included in this publication are NOT official statistics on income. They should not be interpreted as an indicator of poverty or living standards. Rather they are published here merely as outputs from research to test the feasibility of a different methodology to that currently used in the production of income statistics. The outputs have been developed to keep you up to date with our assessments of administrative data and, long-term, to show progress towards an Administrative Data Census in the future. It is important that the information and research presented here is read alongside the outputs to aid interpretation and avoid misunderstanding. These outputs must not be reproduced without this warning note.
Readers wishing to see the official small area income estimates can view the small area model-based income estimates (SAIE) for the tax year ending 2014 published on the same day as this report. This publication provides official statistics below the local authority level to be used in analysis and decision making. The SAIE statistics provide an estimate of the average (mean) weekly household income. They are produced using a model-based method to combine data from the Family Resources Survey with published census and administrative data.
What are our aspirations?
Figure 1 outlines our plans for our first 3 years of publications. These plans reflect our aspirations and are dependent on data access and statistical quality as well as developments in our population estimates methodology. This year our Income Research Outputs are produced directly from administrative data. There are limitations in terms of coverage and they have been produced only down to local authority level (represented by the grid at the bottom of Figure 1).
In 2017, dependent on improvements in our population estimates methodology, we are planning to produce these outputs for households, rather than just individuals. Next year we also aim to publish initial research into combining administrative data and survey data. This will be our first exploration into an “integrated sources” output. Our aspiration is to use these developments to expand the coverage of the Income Research Outputs and to produce statistics to a lower geographic level. These improvements are dependent on methodological development and statistical data quality and access.
During 2016 to 2018, we aim to increase the use of administrative data. An important milestone for this is when new legislation will allow more detailed Pay As You Earn (PAYE) and Self Assessment data to be shared with ONS. The aim is to use this additional data to increase our coverage and produce statistics at a small area level. These plans are dependent on this substantial increase in administrative data being available for research. This additional detail should also help us produce components of income for some geographic levels.
Figure 1: Plans for Income Research Outputs

Source: Office for National Statistics
Notes:
Pay As You Earn
Small area model-based income estimates
Local Authority
Lower Layer Super Output Area
Output Area
Download this image Figure 1: Plans for Income Research Outputs
.png (65.5 kB)Alongside the development of the Income Research Outputs we are also developing our administrative data population estimates methodology. The Research Outputs on the population are estimates of the size of the population, produced by pseudonymously1 linking multiple administrative datasets to produce a Statistical Population Dataset (SPD).
Last year we published population estimates from a Statistical Population Dataset (SPD) V1.02 methodology, which was primarily based on linking records from: the NHS Patient Register; Department for Work and Pensions (DWP) Customer Information System; and data from the Higher Education Statistics Agency (HESA). In addition, we use aggregate statistics for home and foreign armed forces personnel, supplied by the Ministry of Defence.
This year we presented an analysis of population estimates produced from a new, improved SPD V2.0 methodology. This gives improved coverage of SPD estimates by using 3 new components: the school census records; improvements to the matching methodology; and the use of “activity”3 data from the NHS, DWP and HM Revenue and Customs (HMRC) to assign records on the SPD to the most likely address.
In this year’s Income Research Outputs publication we have used SPD V1.0. In future Income Research Outputs it is likely that we will use the most recent SPD available.
While we plan to eventually produce small area income estimates for households using administrative data, this first publication is limited to distributions of annual individual income at local authority level. These distributions are available by age and sex and are presented for the tax year ending 2014. The figures refer to the resident population aged 16 and over in England and Wales (that are present on SPD V1.0 at 30 June 2013). The figures are based on 4 administrative data sources supplied to ONS by the DWP and HMRC. As the outputs are limited to these 4 datasets there are a number of income components that are missing from the outputs, for example, Self Assessment. For further details on what is included in the Income Research Outputs see section 6.
Definition of income
The definition of income we are working towards is gross income. Using the descriptions outlined in the Canberra Group Handbook (the United Nations Economic Commission for Europe standards for measuring income), we are working towards a definition of gross income as:
income from employment (which includes employee income and income from self-employment)
property income (which includes income from financial and non-financial assets)
current transfers received (which includes social security schemes and pensions)
Annex A includes detailed descriptions of these components. The feedback survey includes questions to assess whether this is the definition required by users.
Notes for What is our overall aim?
Pseudonymisation is a procedure by which identifying fields (that is, names, dates of birth and addresses) within a data record are replaced by 1 or more artificial identifiers to protect the privacy of individuals.
A Statistical Population Dataset (SPD) is a single, coherent dataset that forms the basis for estimating the population. It is produced by linking records across multiple administrative data sources and applying a set of inclusion and distribution rules.
“Activity” can be defined as an individual interacting with an administrative system, for example for National Insurance or tax purposes, when claiming a benefit, attending hospital appointments or updating information on government systems in some other way. Only demographic information (such as name, date of birth and address) and dates of interaction are needed from such data sources to improve the coverage of our population estimates.
5. Where are we now?
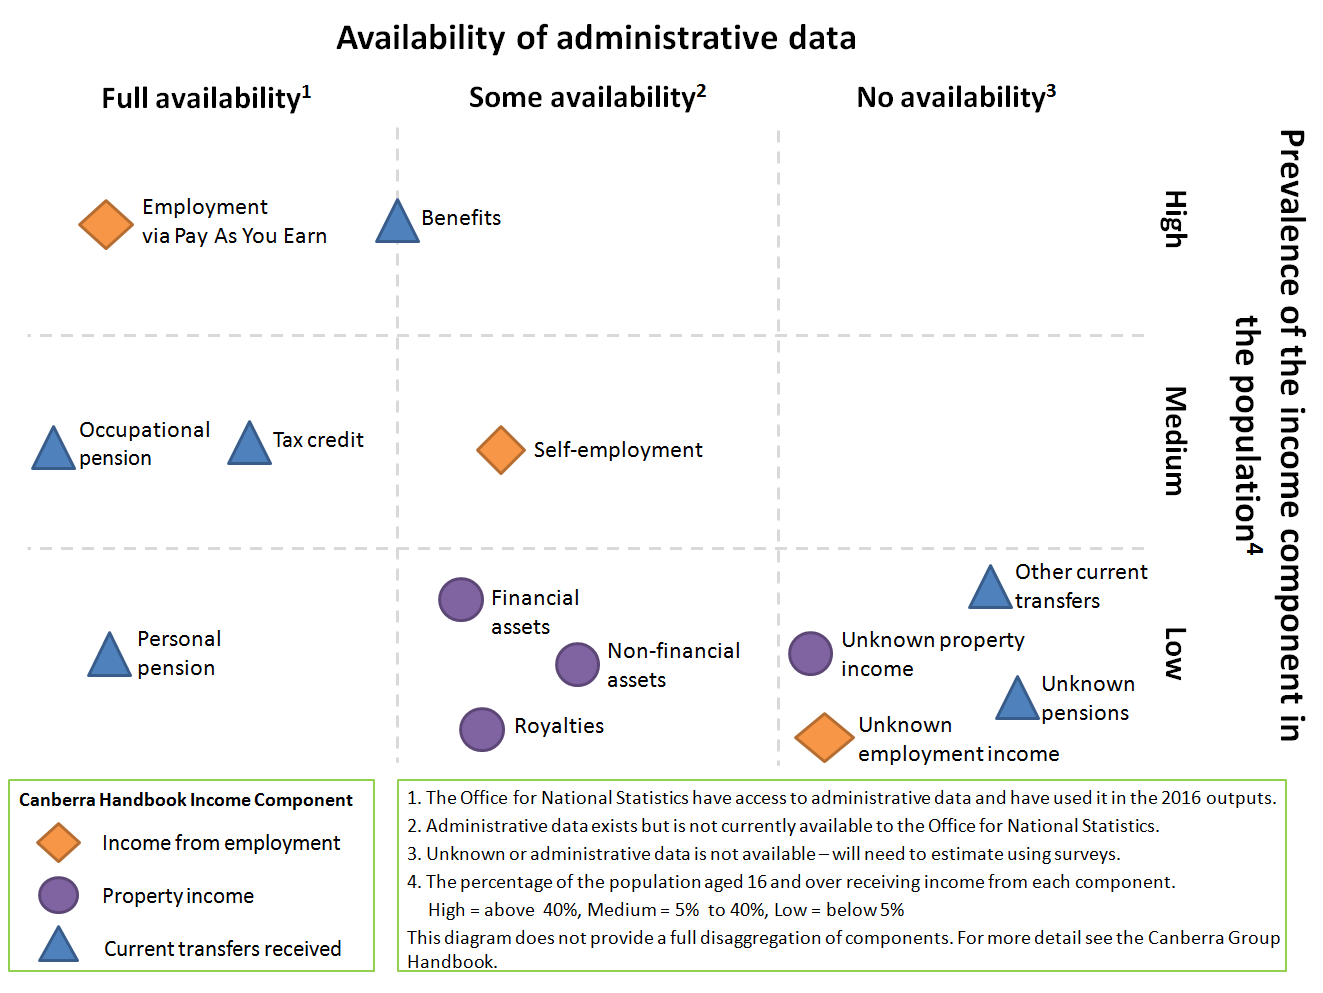
Figure 2 shows where administrative data sources exist for the different components of gross income. It also shows the prevalence of these components in the population. This refers to the percentage of the population that are in receipt of the income component.
On the left side of the figure, “full availability”, are components where we know administrative data exists and the Office for National Statistics (ONS) have access to limited variables within the data. These are the components currently included in the Income Research Outputs. See section 6 for further information on what is or is not included in the Income Research Outputs. We are working with the Department for Work and Pensions (DWP) and HM Revenue and Customs (HMRC) to expand the level of detail received from these sources. This is dependent on new legislation, which may be met through the Digital Economy Bill.
The middle column, “some availability”, indicates where we know that administrative data exists but we do not have access. The benefits component is between the columns as some benefits are not covered in the data we received (for example, Child Benefit and Universal Credit). The Self Assessment data held by HMRC would provide information on the income from self-employment and property income components that are not taxed through the Pay As You Earn (PAYE) system. There would still be some missing data where individuals’ income is below the relevant tax threshold so they may not be expected to file a Self Assessment tax return.
Finally, in the “no availability” column are components such as other current transfers (for example, financial support from family) and unknown income (for example, income from employment that is not reported to HMRC) where administrative data are not available. These are the components that we will likely have to estimate using surveys. Population prevalence of these components is unknown but we expect it to be lower than for other income components.
Figure 2: Access to administrative data on income components
Source: Office for National Statistics
Download this image Figure 2: Access to administrative data on income components
.png (97.6 kB)In 2015, DWP shared 4 administrative datasets with ONS. These datasets represent a subset of personal income and benefits information, which could be shared under current legislation. Of these datasets, 2 contained DWP data on time spent receiving benefits. The other 2 contained data that were originally sourced from HMRC and were provided to DWP and passed to ONS with HMRC agreement. These datasets have been used to create these Income Research Outputs. The 4 datasets were as follows.
Pay As You Earn (PAYE)
The PAYE system is administered by HMRC and is a method of paying Income Tax and National Insurance contributions. Employers or pension providers deduct tax and National Insurance contributions (NICs) as appropriate before payments are made to an individual. Payments made via PAYE include wages and salaries, occupational pensions, personal pensions and some taxable benefits. Self-employment is not processed through the PAYE system.
The PAYE dataset supplied to ONS contained individuals’ total money earned or paid during the tax year after pension contributions and before other deductions such as tax, NICs and student loan payments.
Tax credits
Tax credits are state benefits administered by HMRC. They provide extra money to those responsible for children (Child Tax Credit), disabled workers and other workers on lower incomes (Working Tax Credit). Further information on Child Tax Credit and Working Tax Credit can be found in Annex B.
The tax credits dataset supplied to ONS contained the total amount of tax credits (including both Child Tax Credit and Working Tax Credits combined) paid to claimants and partners in a tax year.
Single Housing Benefit Extract (SHBE)
SHBE contains information on Housing Benefit claims provided to DWP by local authorities. Housing Benefit is available to those on a low income to help pay towards rent. Further information on Housing Benefit can be found in Annex B.
The SHBE dataset supplied to ONS contained Housing Benefit information at individual claim level. This included information on the claimant, their partner and the rate of benefit awarded.
National Benefits Database (NBD)
The NBD contains information on a number of different benefits administered by DWP: Jobseeker’s Allowance, Income Support, Incapacity Benefit, Severe Disablement Allowance, Employment and Support Allowance, Carer’s Allowance, Widow’s benefits or bereavement benefits, Disability Living Allowance, Pension Credit, State Pension and Attendance Allowance. Further information on each of these benefits can be found in Annex B.
The NBD dataset supplied to ONS contained information at individual benefit claim level. This included information on the claimant, other household members (where appropriate) and main components of the benefit claim.
Further information on these datasets can be found in “Data Source Overview: Income and benefits”.
Back to table of contents6. What do the Income Research Outputs measure and which population groups do they cover?
This section covers details of the income measure used in the Income Research Outputs and discusses the outputs with reference to both coverage of population and coverage of income sources. Where possible, gaps in the coverage have been quantified. Important coverage issues affecting different age and sex groups are also discussed. This section helps to inform interpretation of the outputs and identify limitations of their use.
Main coverage points
The Income Research Outputs cover some income information for 87% of people aged 16 and over.
The outputs underestimate many individuals’ true income.
Many students and young people (aged 16 to 24) are likely to be correctly recorded as having no income information in these outputs. This is because they do not receive a salary or benefits and their student loan income is not included in the definition of gross income.
Income earned through self-employment or investments (along with other income collected via Self Assessment) is missing from the outputs.
Some income information is available for almost 99% of the 65 and over population.
Income measure
The Income Research Outputs measure individual gross annual income comprising income from a limited number of sources. At present the income definition used in the Research Outputs does not meet the internationally agreed definition of gross income (as defined in the Canberra Group Handbook). However, we aim to work towards this definition with improved methods and availability of administrative data in the future.
The income measure used in the Income Research Outputs includes:
gross earnings (net of pension contributions) from employment including any benefits in kind paid through Pay As You Earn (PAYE)
state support – most benefits, including tax credits (see Annex B for more information)
income from occupational and personal pensions included on the PAYE dataset
Excluded from the income measure used in the Income Research Outputs – but included in the international gross income definition – are:
income from self-employment or income from an employer not paid via PAYE
investment income including interest from Individual Savings Accounts (ISAs) and other saving accounts, bonds, stocks and shares
some state support – some benefits including Child Benefit, Winter Fuel Payment, Universal Credit and Personal Independence Payment
Excluded from the income measure used in the Income Research Outputs – and excluded from the international gross income definition – are:
maintenance payments
income from educational grants, scholarships and student loans
the cash value of certain forms of income in kind (free school meals, free school breakfast, free school milk, free school fruit and vegetables, Healthy Start vouchers and free television licence for those aged 75 and over)
Further information on the inclusion and exclusion of the components of income as defined in the Canberra Group Handbook is given in Annex A.
Coverage of income sources
The Income Research Outputs do not currently include all sources of gross income in the definition we are working towards.
Figure 3 shows the main sources of income in England and Wales in the tax year ending 2014 and the proportion of income accounted for by each source. The figures refer to weekly household gross income and were taken from the Department for Work and Pensions (DWP) Family Resources Survey (FRS). Almost two-thirds of the average household’s income came from wages and salaries. Self-employed income and pensions were the next largest contributors.
These figures are not directly comparable with the Income Research Outputs because they refer to weekly household income, rather than individual annual income. However, the sources of household income are the same as for individual income and a similar distribution across sources is expected. Based on the FRS, it is estimated that on average the Income Research Outputs cover at least 80% (wages and salaries, tax credits, State Pension, disability benefits, other benefits and most private pensions) of individual annual gross income. This figure will be unevenly distributed between individuals with no income information and individuals with some or all of their income information included. The Income Research Outputs will therefore tend to underestimate an (anonymised) individual’s true gross annual income.
Figure 3: Sources of total weekly household gross income in England and Wales
Tax year ending 2014
Source: Family Resources Survey, Department for Work and Pensions
Notes:
- State Pension includes any Income Support or Pension Credit paid with it.
Download this chart Figure 3: Sources of total weekly household gross income in England and Wales
Image .csv .xlsCoverage of the England and Wales population
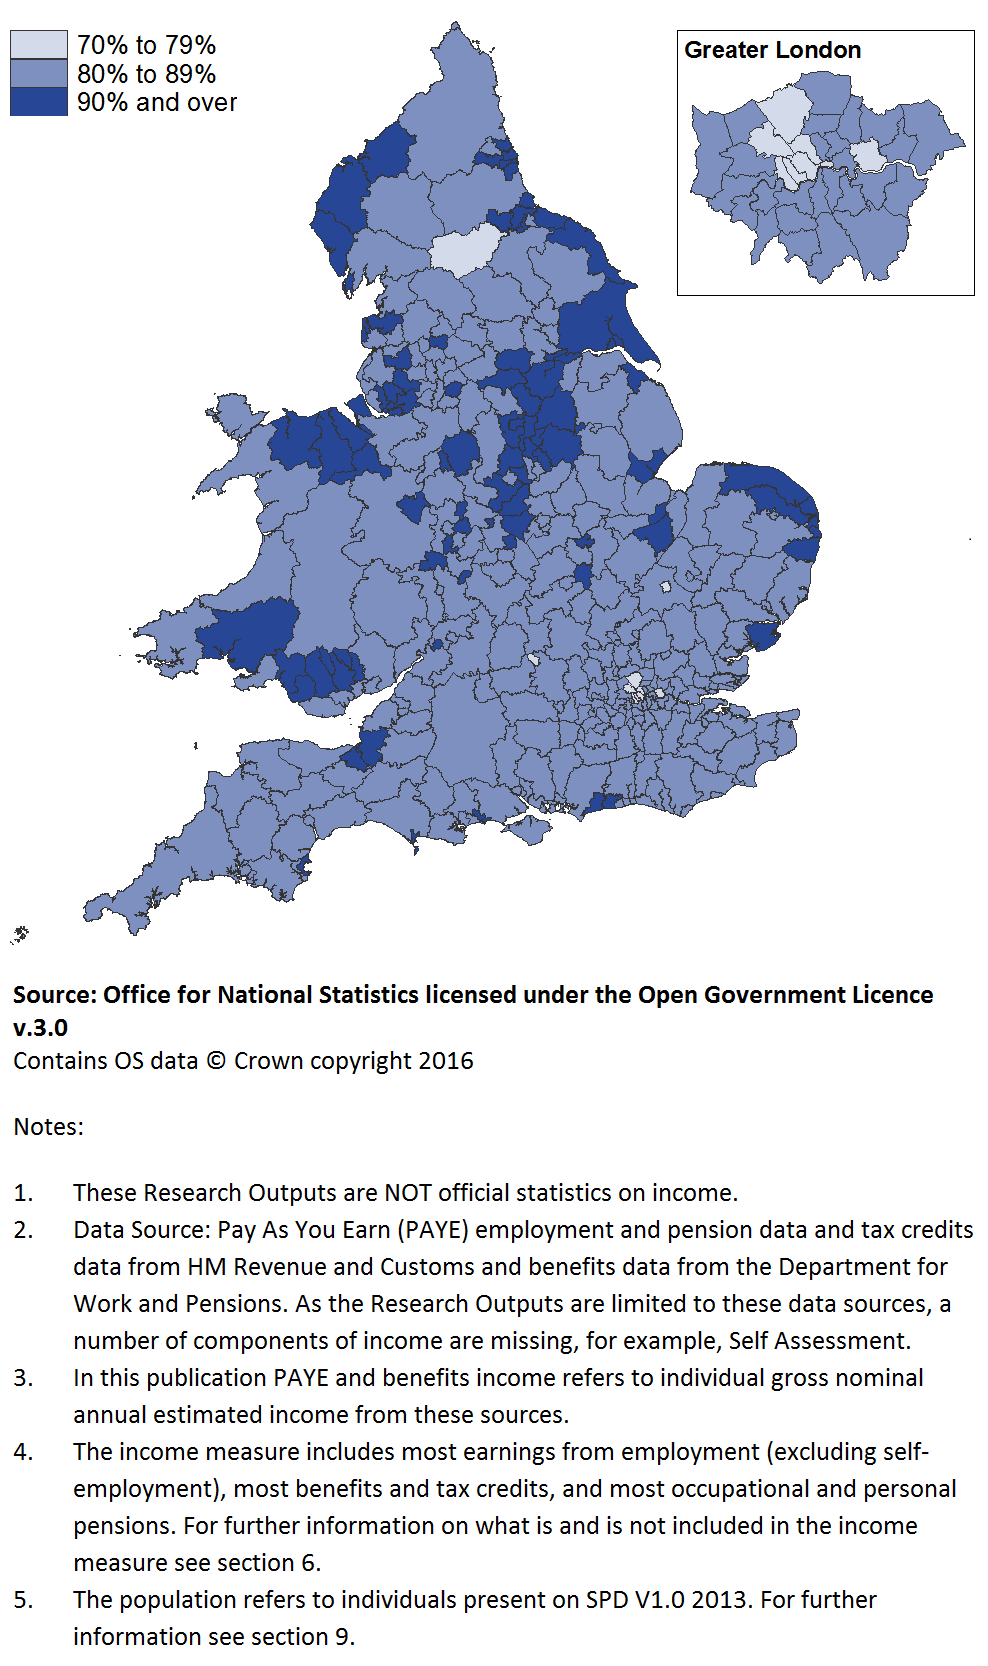
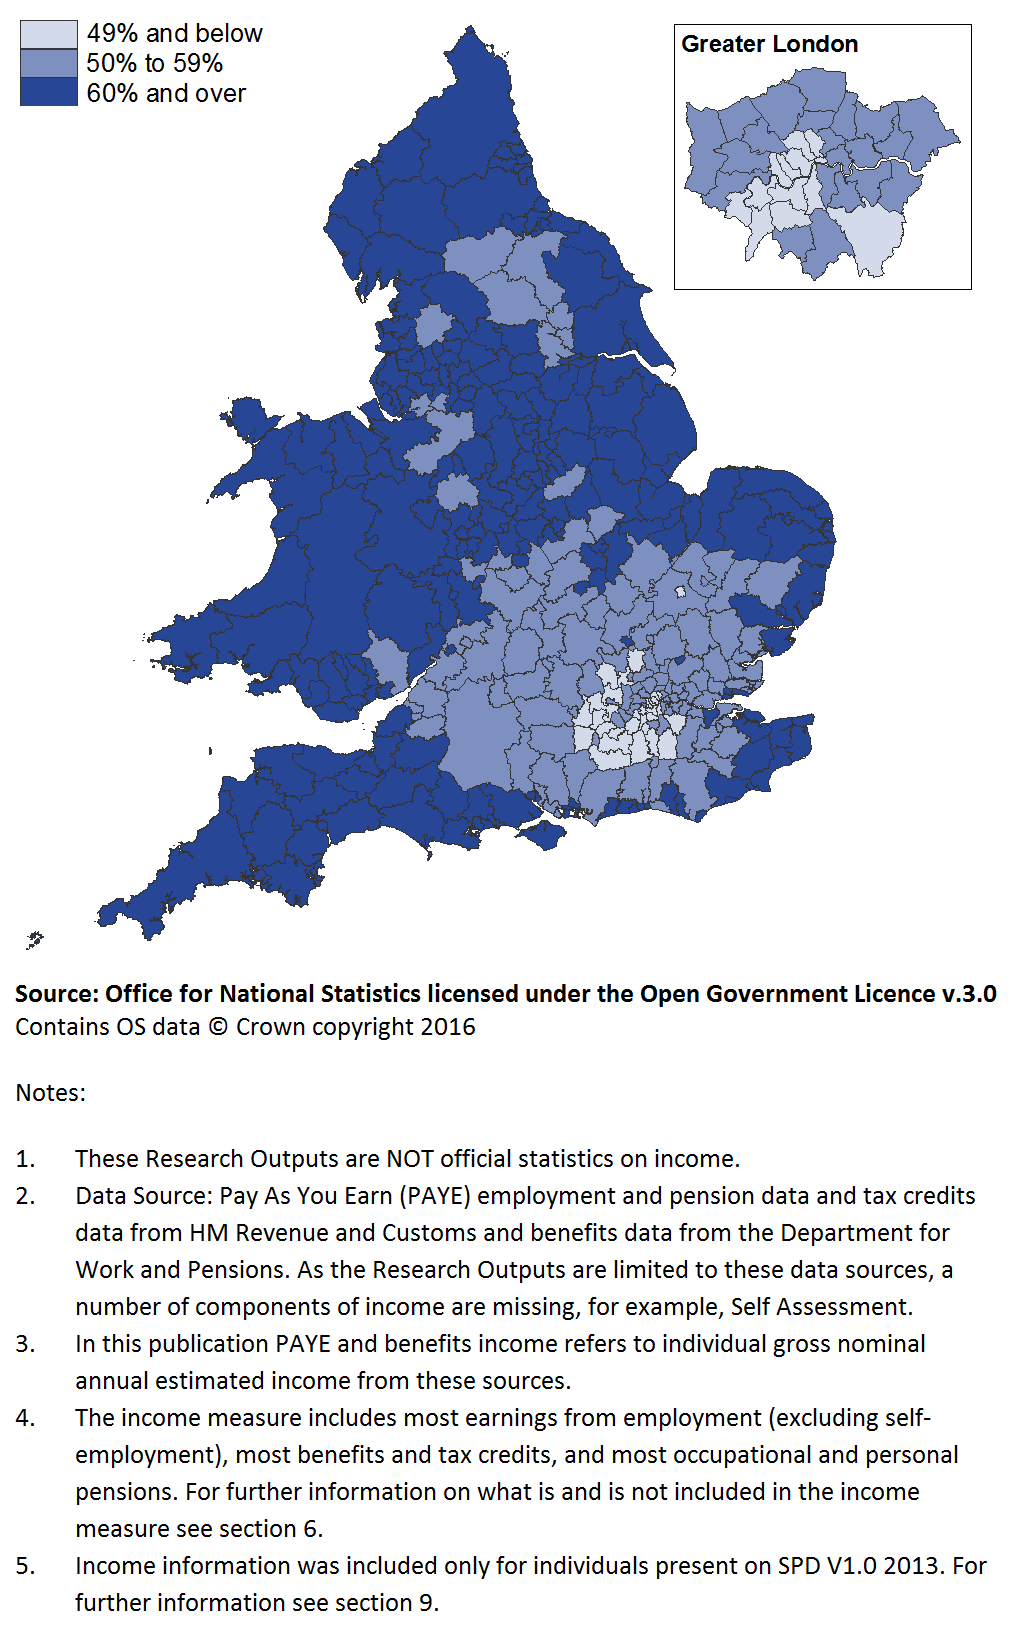
The Income Research Outputs cover some income information for 87% of people aged 16 and over in England and Wales on Statistical Population Dataset (SPD) V1.0. This means that some income information was available for approximately 40 out of 46 million people. At local authority (LA) level, this percentage varied from 74% to 93%. The majority of LAs had some income information available for over 80% of their 16 and over population (Figure 4).
Figure 4 shows that many of the LAs with population coverage below 80% are in London. This might be due to the higher levels of international migration in London compared with other areas of England and Wales. These higher migration levels may lead to the inclusion of people in SPD V1.0 who were no longer in the country (see page 67 of Administrative Data Research Report). These individuals would not be expected to have income information1. In addition, there are high levels of self-employment in London and large student populations. Both these population groups are more likely to have no income information available in these outputs.
Richmondshire also had income information available for less than 80% of its 16 and over population. Home armed forces comprise a significant proportion of the population of Richmondshire and, as discussed in section 9, income information is not included in the outputs for many of the armed forces. Therefore lower coverage in Richmondshire is to be expected.
The final 2 LAs where income information was available for less than 80% of their 16 and over population were Oxford and Cambridge. Similarly to London, these LAs have large student populations. Oxford and Cambridge Universities discourage students from working while studying, making their students even less likely to have an income compared with other student populations (Cambridge guidance and Oxford guidance).
Figure 4: Percentage of the population with some PAYE and benefits income information, England and Wales
Tax year ending 2014, males and females, aged 16 and over
Download this image Figure 4: Percentage of the population with some PAYE and benefits income information, England and Wales
.png (133.3 kB) .xls (70.1 kB)Coverage of the Income Research Outputs for different age and sex groups
Figure 5 shows that the coverage of the SPD V1.0 population with some income information available varied greatly by age.
From age 16 to 19 coverage increased for both sexes, from 14% at age 16 to over 70% by age 19.
From age 20 to 24, coverage continued to increase for both sexes. However, coverage for females increased to over 88% while coverage for males increased to 82%.
From age 25 to 60, coverage remained fairly level for both sexes, with income information unavailable for just over 10% of females and 15% of males.
Above age 60, coverage of both sexes increased again, with females peaking at a slightly younger age than males. By age 64 for females and age 67 for males, some income information was available for over 99% of the population.
Figure 5: Percentage of the population with some PAYE and benefits income information by age and sex, England and Wales
Tax year ending 2014, males and females, aged 16 and over

Source: Office for National Statistics
Notes:
These Research Outputs are NOT official statistics on income.
Data Source: Pay As You Earn (PAYE) employment and pension data and tax credits data from HM Revenue and Customs and benefits data from the Department for Work and Pensions. As the Research Outputs are limited to these data sources, a number of components of income are missing, for example, Self Assessment.
In this publication PAYE and benefits income refers to individual gross nominal annual estimated income from these sources.
The income measure includes most earnings from employment (excluding self-employment), most benefits and tax credits, and most occupational and personal pensions. For further information on what is and is not included in the income measure see section 6.
The population refers to individuals present on SPD V1.0 2013. For further information see section 9.
Download this image Figure 5: Percentage of the population with some PAYE and benefits income information by age and sex, England and Wales
.PNG (14.9 kB) .xls (24.6 kB)We now discuss differences in the coverage by age and sex by exploring the main income sources and coverage gaps of different age groups. To support this, Figure 6 shows the main sources of weekly household income by age of the head of household for England and Wales in the tax year ending 2014 according to the Family Resource Survey (FRS).
For households where the head of the household was of working age (age 16 to 64) the highest source of income was from wages and earnings. In comparison, for households where the head was aged 65 and over, the main source of income was pensions. Although this information relates to household income rather than individual income, it is expected that the patterns observed would be similar for the Income Research Outputs.
Figure 6: Sources of total weekly household income by age of head of household, England and Wales
Tax year ending 2014
Source: Family Resources Survey, Department for Work and Pensions
Notes:
- State Pension includes any Income Support or Pension Credit paid with it.
Download this chart Figure 6: Sources of total weekly household income by age of head of household, England and Wales
Image .csv .xlsThe next sections discuss the coverage of the Income Research Outputs using the age groups outlined in Figure 6. Each section includes fictional examples of how specific types of individual would be covered in these outputs. These examples are followed by detailed information about the coverage.
Students and young people (16 to 24)
Example 1: Chris is a 17-year-old student studying for A Levels at college. He lives at home with his parents and his only income source is parental contributions. As we do not have data on “other current transfers” such as this, Chris would appear in the “no income information” category of our Research Outputs.
Example 2: Priya is a 22-year-old full-time university student. She receives a student loan. She also works part-time. Priya’s employer processes her pay through PAYE and therefore this income is captured in our Research Outputs. However, Priya’s student loan will not be included. Student loans do not fall under our gross income definition and therefore missing this information does not affect coverage of the Research Outputs. All components of Priya’s income that fall within the income definition are therefore included in the Income Research Outputs.
Note: These are fictional descriptive examples to aid understanding and are not representative of the whole age group.
As shown in Figure 5, coverage of the 16 to 24 population with some income information is relatively low (69% on average). This is not a uniform pattern because those in the younger end of this age group have much less income information than those closer to 24. For example, for 16-year-olds income information is available for only 14% of males and females. This rises rapidly to around 82% for males and 89% for females aged 24.
Figure 6 shows that for households where the head was aged below 25, the main source of weekly household income in the tax year ending 2014 was wages and salaries (56% of household income). The second largest income source for this age group was “other sources” (24% of household income), which includes student loans. However, as the FRS samples only private households (and so excludes students living in, for example, halls of residence), the inclusion of student loans in this category will not be representative of the whole population. The gross income definition used in the Income Research Outputs excludes student loans and therefore the distribution of income sources for this age group will differ from the FRS.
The high proportion of students within the 16- to 24-year age group can partially explain the lower coverage of this age group. A high proportion of students will not have an income because many are in full-time education (student loans are not considered as income under our income definition). This will be particularly true for younger students aged 16 to 18.
The Office for National Statistics (ONS)’s Labour Force Survey (LFS) showed that almost 69% of full-time male UK students and over 61% of full-time female UK students aged 16 to 24 were economically inactive from April to June 2013 (Table A06). These students do not have income from employment and are therefore likely to have no income information in the Income Research Outputs. These LFS figures equate to over 2 million 16- to 24-year-olds in the UK, which explains the large proportion of individuals in this age group with no income information (Figure 6).
The LFS also shows that just over a quarter of full-time students aged 16 to 24 in the UK were in part-time employment from April to June 2013. This percentage was higher for females than males (30% compared with 22% respectively) (Table A06). The majority of earnings from such part-time employment will be included in the Income Research Outputs as most medium and large employers submit information to PAYE on all employees irrelevant of the amount paid. However, some of this income will not go through the PAYE system and will be missing from the Income Research Outputs. For example, cash-in-hand earnings will not be included and earnings below the personal allowance tax threshold of £9,440 may not always be included.
Investment income and earnings via Self Assessment are also excluded from the Income Research Outputs. However, for 16- to 24-year-olds these income sources account for a small proportion of the total income for this age group. According to the LFS, from April to June 2013, approximately 152,000 people aged 16 to 24 were self-employed in the UK (Self-employment by age). This equates to approximately 2% of the 16 to 24 mid-2013 UK population (Mid-year population estimates).
Overall, the Income Research Outputs are missing income information for some individuals within the 16- to 24-year age group. However, the majority of individuals who have no income information within this age group are unlikely to have an income that falls within the gross income definition. Lower population coverage of this age group is therefore to be expected.
People aged 25 to 64
Example 1: Angela is 45-years-old and works full-time. She has a daughter and receives Child Benefit. Angela has also been saving to move house and has invested money in several places. Angela’s earnings from work are processed through PAYE so are included in the Research Outputs. Income from investments and Child Benefit are not currently included in the Income Research Outputs because data was not available on these income sources. Angela’s income is therefore underestimated.
Example 2: Emmanuel is 31 and is self-employed. He has no other income sources. As data on self-employed income were not included in the current data sources available to ONS, this is missing from the Income Research Outputs. Emmanuel will therefore fall in the “no income information" category.
Example 3: Jordan is 50 and is currently looking for a job. He is therefore in receipt of Jobseeker’s Allowance and this is his only source of income. Benefits such as Jobseeker’s Allowance are included in the Research Outputs and therefore all components of Jordan’s income are captured.
Note: These are fictional descriptive examples to aid understanding and are not representative of the whole age group.
Figure 5 shows that the Research Outputs include some income information for the majority of the population aged 25 to 64. Coverage is generally higher for females aged 25 to 64 (90%) than males aged 25 to 64 (85%).
Figure 6 shows wages and salaries were the main source of weekly household income in the tax year ending 2014 for households where the head was aged 25 to 64 (76%). The majority of income from wages and salaries is included in these outputs as it is paid through PAYE. Income below the tax threshold may not be processed through PAYE and therefore may be excluded from the outputs. This is likely to affect a small proportion of people as most medium and large employers submit information to PAYE on all employees irrelevant of the amount paid.
Income from self-employment is not included in these outputs. This is an important contributor to gaps in both coverage and income totals for the population aged 25 to 64. Figure 6 shows that self-employed income equated to 8% of household income for the population aged 25 to 64 in the tax year ending 2014. According to ONS’s LFS, from April to June 2013, approximately 3.7 million adults aged 25 to 64 were self-employed in the UK (Self-employment by age). This equates to approximately 11% of the 25- to 64-year-old mid-2013 UK population (Mid-year population estimates).
The LFS also shows that between April and June 2013, more than twice as many males as females were self-employed (Table EMP01). This may partially explain the larger coverage gap in the Income Research Outputs for males aged 25 to 64 than for females. Self-employment rates also vary by other characteristics and this may further explain some of the differences in coverage.
It is important to note that some self-employed individuals will be recorded as having income in the Research Outputs. This is because some individuals will still be in receipt of income from other sources that are included in the outputs. This could be income from benefits or if the individual has been both employed and self-employed during the tax year.
The ONS publication “Effects of Taxes and Benefits on Household Income” explores the relationship between total household income and the different sources of household income. It also shows differences in this relationship between retired and non-retired households. Although this publication studies equivalised2 household income, we can still compare the general patterns with the Income Research Outputs.
Figure 7 shows that wages and salaries were the greatest source of income for high-, average- and low-income non-retired households. However, self-employment income accounted for a higher percentage in high-income households compared with average and low-income households. All income from self-employment is currently excluded from the Income Research Outputs. Therefore, the income of individuals from high-income households is likely to be underestimated by more than the income for individuals from low-income households. Additionally, cash benefits contribute a greater proportion of income to average- and low-income households than high-income households. The majority of income from cash benefits is included in the Income Research Outputs.
Figure 7: Income sources as a percentage of gross annual equivalised household income for low-, average- and high-income non-retired households, UK
Tax year ending 2014
Source: Effects of Taxes and Benefits on Household Income, Office for National Statistics
Notes:
Low-, average- and high-income households are the households in the bottom, third, and top quintiles respectively with regards to their equivalised disposable income derived from the Living Costs and Food Survey.
Private pensions, annuities include all occupational pensions, individual personal pensions and annuities.
Cash benefits exclude Child Benefit.
Download this chart Figure 7: Income sources as a percentage of gross annual equivalised household income for low-, average- and high-income non-retired households, UK
Image .csv .xlsIncome received through Child Benefit is currently missing from the Income Research Outputs. In the tax year ending 2014, a family with 2 children would have received over £1,700 in Child Benefit. In August 2013, approximately 6.7 million families in England and Wales were receiving Child Benefit (Child Benefit Statistics). If an individual’s only income is from Child Benefit they will currently have no income information in the Income Research Outputs. However, if an individual receiving Child Benefit has another source of income via PAYE or other benefits, including tax credits, they will have income information in the outputs, but it will be lower than in reality.
The Income Research Outputs are also missing any income received from Universal Credit and Personal Independence Payment. These benefits were introduced during the tax year ending 2014 and were initially rolled out in a limited number of areas. Therefore, the absence of this information is expected to have a small impact on the overall coverage of the outputs.
Income through investment is not included in the Income Research Outputs. It accounted for 1% of household income in the tax year ending 2014 for households where the head of household was aged 25 to 64 (Figure 6). Other income sources such as property investments, business partnerships and hedge funds that are processed via Self Assessment rather than PAYE are also not included in the outputs. Figure 7 shows that high-income non-retired households received a greater percentage of their income in the tax year ending 2014 from investments than low- and average-income households.
Overall, taking into account the income likely to be missing for this age group, Figure 6 suggests that for the average household, where the head of household was aged 25 to 64, 11% of weekly household income would be missing (self-employment income, investments and other sources). Although the definition of income being measured here is different to that of the Income Research Outputs, it provides an indication of the amount likely to be missing.
Pensioners (65 and over)
Example 1: Molly is 73 and is in receipt of both an occupational and State Pension. Molly’s occupational pension scheme is processed through PAYE and this income is therefore included in the Income Research Outputs. State Pension is provided by the government and is included in the National Benefits Database so this is also included in Molly’s income in the outputs. As Molly has no other income sources, all components of her income are captured in the Income Research Outputs.
Example 2: Brian is 69 and is self-employed. He is also in receipt of a State Pension. Income from Brian’s State Pension is included in the Income Research Outputs because State Pension is included in the National Benefits Database. Brian’s self-employment income however, is not included in the Income Research Outputs, because data on Self Assessment were unavailable. Brian’s income is therefore underestimated.
Note: These are fictional descriptive examples to aid understanding and are not representative of the whole age group.
As shown in Figure 5, the Research Outputs include some income information for most of the 65 and over population (almost 99%). Figure 6 shows that the main sources of income for the 65 and over age group were state and private pensions. These accounted for over 70% of weekly household income in the tax year ending 2014. The same pattern is also likely to be seen for individual annual income as measured by the Income Research Outputs.
The data used in the Income Research Outputs covers the majority of private pensions (which includes both occupational and personal pensions). Occupational pensions are employee pensions associated with an employer or workplace and cover both the public and private sector. Personal pensions are provided through a contract between an individual and the pension provider.
Income from registered pension schemes (of any type) is taxed under PAYE and therefore is included in the Income Research Outputs, with the exception of some non-UK pensions which are not taxed through PAYE.
In the UK the receipt of occupational pensions is more common than personal pensions, and hence tends to dominate the overall results for private pensions. According to data from the FRS, in the UK in the tax year ending 2014, 62% of pensioner units3 were in receipt of income from an occupational pension and only 19% received income from a personal pension (Pensioners' Income Series). In addition, the Pensioners’ Income Series for the tax year ending 2014 also stated that for pensioner units aged 65 and over, almost 87% of their average weekly gross income that came from pensions was from occupational pensions, with the remaining 13% from personal pensions (Pensioners' Income Series).
As shown by Figure 6, for the 65 and over age group, the Income Research Outputs are likely to be missing small amounts of income from investments, self-employed income and some other sources. For the average household where the head of household was 65 or over, approximately 9% of weekly household income would be missing. Although the definition of income being measured here is different to that of the Income Research Outputs, it provides an indication of the amount of income likely to be missing.
The amount of income missing for those aged 65 and over will differ greatly by other characteristics. Figure 8 shows how different sources of income contributed to gross annual equivalised household income for low-, average- and high-income retired households based on information from the Effects of Taxes and Benefits on Household Income publication. For low-income retired households, the majority of their income was received from cash benefits (which includes State Pension), with the second highest source being private pensions and annuities. Comparatively, high-income retired households received the majority of their income from private pensions, with the second-highest source being cash benefits. In addition, investments accounted for a greater proportion of income for high-income households. As the Income Research Outputs do not include income from investments, this will result in a greater coverage gap for those individuals.
Figure 8: Income sources as a percentage of gross annual equivalised household income for low-, average- and high-income retired households, UK
Tax year ending 2014
Source: Effects of Taxes and Benefits on Household Income, Office for National Statistics
Notes:
Low-, average- and high-income households are the households in the bottom, third, and top quintiles respectively with regards to their equivalised disposable income derived from the Living Costs and Food Survey.
Private pensions, annuities include all occupational pensions, individual personal pensions and annuities.
Download this chart Figure 8: Income sources as a percentage of gross annual equivalised household income for low-, average- and high-income retired households, UK
Image .csv .xlsIn addition to the coverage of the income sources already discussed there are some other coverage issues that are specifically relevant to those aged 65 and over. Although the majority of benefits are covered by the Income Research Outputs, there are some that are not included. A benefit that is not included is Winter Fuel Payment. This is a tax-free lump sum of between £100 and £300 available to the majority of those aged 65 and over. In the tax year ending 2014, almost 9.5 million people aged 65 and over in England and Wales received a Winter Fuel Payment of on average £172 (Winter Fuel Payment Statistics). Although this is a significant coverage gap for the Income Research Outputs in terms of the proportion of the population it affects, it is a relatively small amount of income and is therefore unlikely to significantly affect the overall income distributions.
Notes for What do the Income Research Outputs measure and which population groups do they cover?
Alternatively some new migrants may appear on the SPD but not yet have an income.
Equivalisation takes into account the number of people living in the household and their ages to account for the fact that households with many members are likely to need a higher income to achieve the same standard of living as households with fewer members.
Pensioner units include both single pensioners (individuals over State Pension age) and pensioner couples (married or cohabiting pensioners where 1 or more are over State Pension age).
7. How do our outputs compare with other sources of data on income?
The Office for National Statistics (ONS) and other government departments, such as the Department for Work and Pensions and HM Revenue and Customs, already publish data on earnings and income. In comparison with the Income Research Outputs, many of these data sources are survey-based and none combine administrative data sources to produce gross income. Table 1 describes the Income Research Outputs against a number of income dimensions and makes comparisons with other existing data sources on earnings and income. For a more detailed comparison of data sources, see Annex C.
| Dimension | Income Research Outputs | Comparison with existing publications |
|---|---|---|
| Population | England and Wales 16 and over population who were resident on the Statistical Population Dataset (SPD1) V1.0 at the end of June 2013. | No other publication uses SPD1 V1.0 as the base. Most publications have UK coverage except for a few that cover Great Britain (Average Weekly Earnings, the Wealth and Assets Survey and the Quarterly Statistical Summaries) and the Small Area Model-Based Income Estimates, which cover England and Wales. The Annual Survey of Hours and Earnings and the Labour Force Survey publish earnings for the 16 and over population. Publications with household as the unit level include household members of all ages. |
| Lowest geography level | Local authority (LA). We will look at producing statistics at lower levels in future releases. | Most publications are not available at LA level. Some surveys (such as the Family Resources Survey) are not designed to produce analysis below regional level. Publications including the Annual Survey of Hours and Earnings, the Survey of Personal Incomes and the Small Area Model-Based Income Estimates go below regional level. |
| Summary measure | Distributions | Summary measures vary between publications and include means, medians, distributions and counts. Mean weekly income is published from the Small Area Model-Based Income Estimates. |
| Units of analysis | Individuals – where Housing Benefit and tax credits were allocated to a claimant and a partner the benefit was split between them. We will look at developing other measures in future releases (for example, household level, but this is dependent on the development of a household base). | Publications of earnings tend to be at individual level (for example, the Annual Survey of Hours and Earnings, the Labour Force Survey and the Survey of Personal Incomes). Publications that include benefit information tend to be at household or benefit unit level (for example, the Family Resources Survey, the Wealth and Assets Survey, the Pensioners’ Incomes Series and the Small Area Model-Based Income Estimates). |
| Income reference period | Annual | This is similar to existing publications with some also covering weekly income (for example, the Annual Survey of Hours and Earnings, the Labour Force Survey, the Small Area Model-Based Income Estimates and the Family Resources Survey). The Annual Survey of Hours and Earnings and the Labour Force Survey also publish some hourly figures. |
| Time period | Tax year ending 2014 (6 April 2013 to 5 April 2014) | Other publications also use tax year, for example, the Effects of Taxes and Benefits on Household Income. The Wealth and Assets Survey uses July to June. |
| Type of income | As much of the gross income definition as possible (see section 6 for further information) with the data available. We will look at including additional sources of income in future releases. | Other publications cover a range of income components including gross and net household income, weekly earnings, income after housing costs and income from benefits. Some publications also take into account the household size. |
| Source of income | Pay As You Earn earnings (employment and occupational pensions), Child Tax Credit and Working Tax Credit, Housing Benefit and many benefits from the Department for Work and Pensions (see Annex B for more detail). | There are some publications based solely on benefits but none which combine administrative sources from HM Revenue and Customs and the Department for Work and Pensions. Many existing publications use survey information to determine income (for example, the Annual Survey of Hours and Earnings and the Family Resources Survey). The Small Area Model-Based Income Estimates combine census, administrative and survey data on income. |
| Off-shore earnings | We will include only the Pay As You Earn pay that is reported to HM Revenue and Customs – this could include some money earned abroad (employees may be taxed via Pay As You Earn but might be able to claim the tax back). | Off-shore earnings are not discussed in other publications. |
| Accrual or receipt | Receipt – administrative data on income and benefits is recorded on receipt of the income or benefit. | Due to the nature of surveys and the respondent’s ability to recall income information, it is assumed that these are also receipt-based. |
Download this table Table 1: A comparison of the Income Research Outputs to existing sources of data on earnings and income
.xls .csv8. What do the outputs show?
It is important to note that the outputs included in this publication are NOT official statistics on income. They should not be interpreted as an indicator of poverty or living standards. Rather they are published here merely as outputs from research to test the feasibility of a different methodology to that currently used in the production of income statistics. The outputs have been developed to keep users up-to-date with our assessments of administrative data and, long-term, to show progress towards an Administrative Data Census in the future. It is important that the information and research presented here is read alongside the outputs to aid interpretation and avoid misunderstanding. These outputs must not be reproduced without this warning note.
A feedback form is published alongside this publication. In particular we welcome feedback that helps to improve and develop our methodology and definitions.
Geographical comparisons
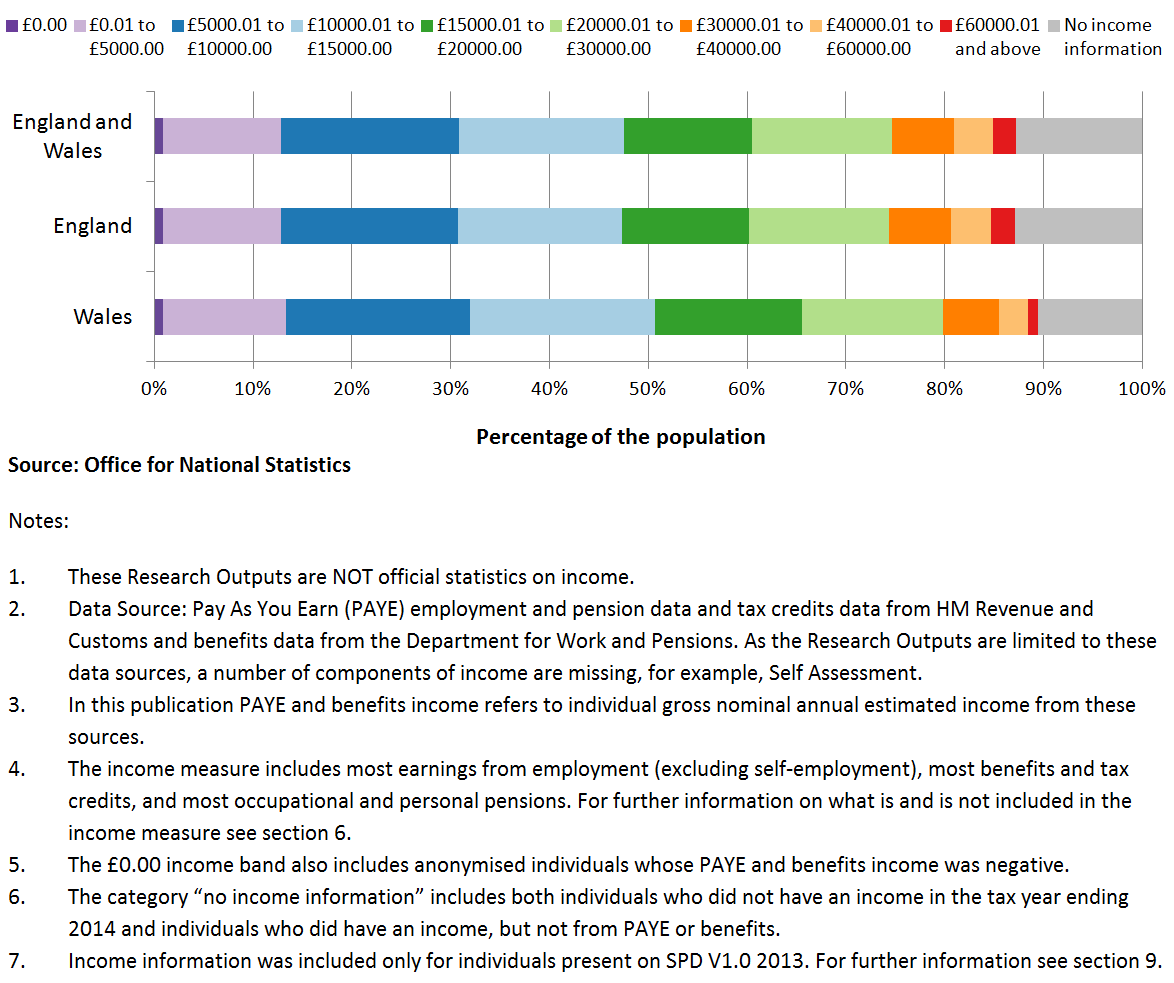
Figure 9 shows the Pay As You Earn (PAYE) and benefits income distribution of the population aged 16 and over in England and Wales.
For England and Wales combined, income of the population aged 16 and over was skewed towards the lower income bands. It is important to note that the Income Research Outputs often underestimate an individual’s income. For more information on the components of income that are not included in the Research Outputs see section 6.
Income information was unavailable for 13% of the 16 and over population in England compared with 11% in Wales.
Higher percentages of the 16 and over population in England fell within the higher income bands in comparison with Wales.
Figure 9: PAYE and benefits income distribution, England and Wales
Tax year ending 2014, males and females, aged 16 and over
Download this image Figure 9: PAYE and benefits income distribution, England and Wales
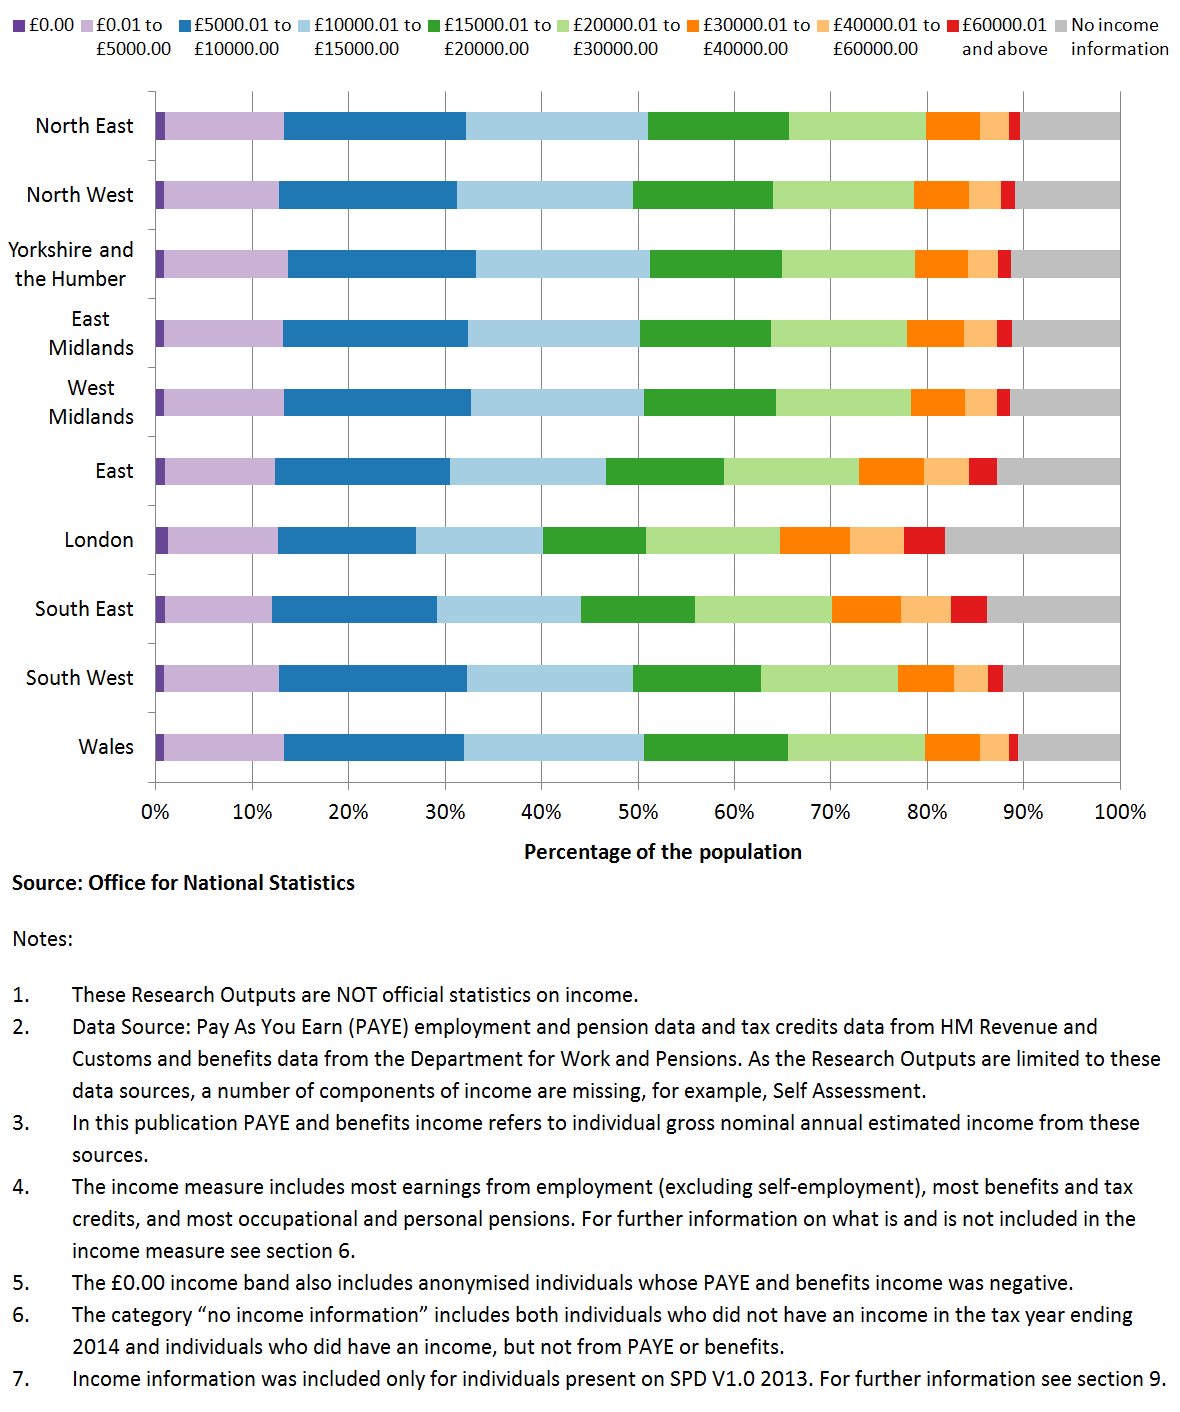
.png (68.2 kB) .xls (29.2 kB)Figure 10 shows the PAYE and benefits income distribution of the population aged 16 and over by region.
Income information was unavailable for 18% of the 16 and over population in London. This was higher than in any other English region and Wales, and was expected because of the high levels of international migration, self-employment and students in London as well as the lower proportion of pensioners. For further information see section 6.
Higher percentages of the 16 and over population in London and the South East fell within the higher income bands compared with other regions.
Figure 10: PAYE and benefits income distribution by region, England and Wales
Tax year ending 2014, males and females, aged 16 and over
Download this image Figure 10: PAYE and benefits income distribution by region, England and Wales
.png (80.1 kB) .png (80.1 kB)Figure 11 shows the percentage of the 16 and over population with PAYE and benefits income in different income bands for the North East and London. These regions had the highest and lowest proportions of their population with an income of £20,000 or below.
A lower percentage of the 16 and over population in London had an income of £20,000 or below compared with the North East.
A higher percentage of the 16 and over population in London had an income above £40,000 compared with the North East.
It is expected that if income from self-employment were included in the Income Research Outputs, the differences between London and the North East would be larger. This is because there are higher levels of self-employment in London and those people who are self-employed are likely to have higher incomes.
Figure 11: Percentage of the population with PAYE and benefits income of £20,000 or below and above £40,000 for the North East and London
Tax year ending 2014, males and females, aged 16 and over
Source: Office for National Statistics
Notes:
These Research Outputs are NOT official statistics on income.
Data Source: Pay As You Earn (PAYE) employment and pension data and tax credits data from HM Revenue and Customs and benefits data from the Department for Work and Pensions. As the Research Outputs are limited to these data sources, a number of components of income are missing, for example, Self Assessment.
In this publication PAYE and benefits income refers to individual gross nominal annual estimated income from these sources.
The income measure includes most earnings from employment (excluding self-employment), most benefits and tax credits, and most occupational and personal pensions. For further information on what is and is not included in the income measure see section 6.
Income information was included only for individuals present on SPD V1.0 2013. For further information see section 9.
Download this chart Figure 11: Percentage of the population with PAYE and benefits income of £20,000 or below and above £40,000 for the North East and London
Image .csv .xlsFigure 12 shows the percentage of the 16 and over population who had an annual income of £20,000 or below in the tax year ending 2014 for each local authority (LA) in England and Wales.
LAs shaded darker on the map indicate areas where a greater percentage of the population had an income of £20,000 or below.
LAs with lower percentages of their population with an income of £20,000 or below were clustered around London and the South East of England.
Figure 12: Percentage of the population with PAYE and benefits income of £20,000 or below by local authority, England and Wales
Tax year ending 2014, males and females, aged 16 and over
Download this image Figure 12: Percentage of the population with PAYE and benefits income of £20,000 or below by local authority, England and Wales
.png (133.8 kB) .xls (80.9 kB)Age and sex comparisons
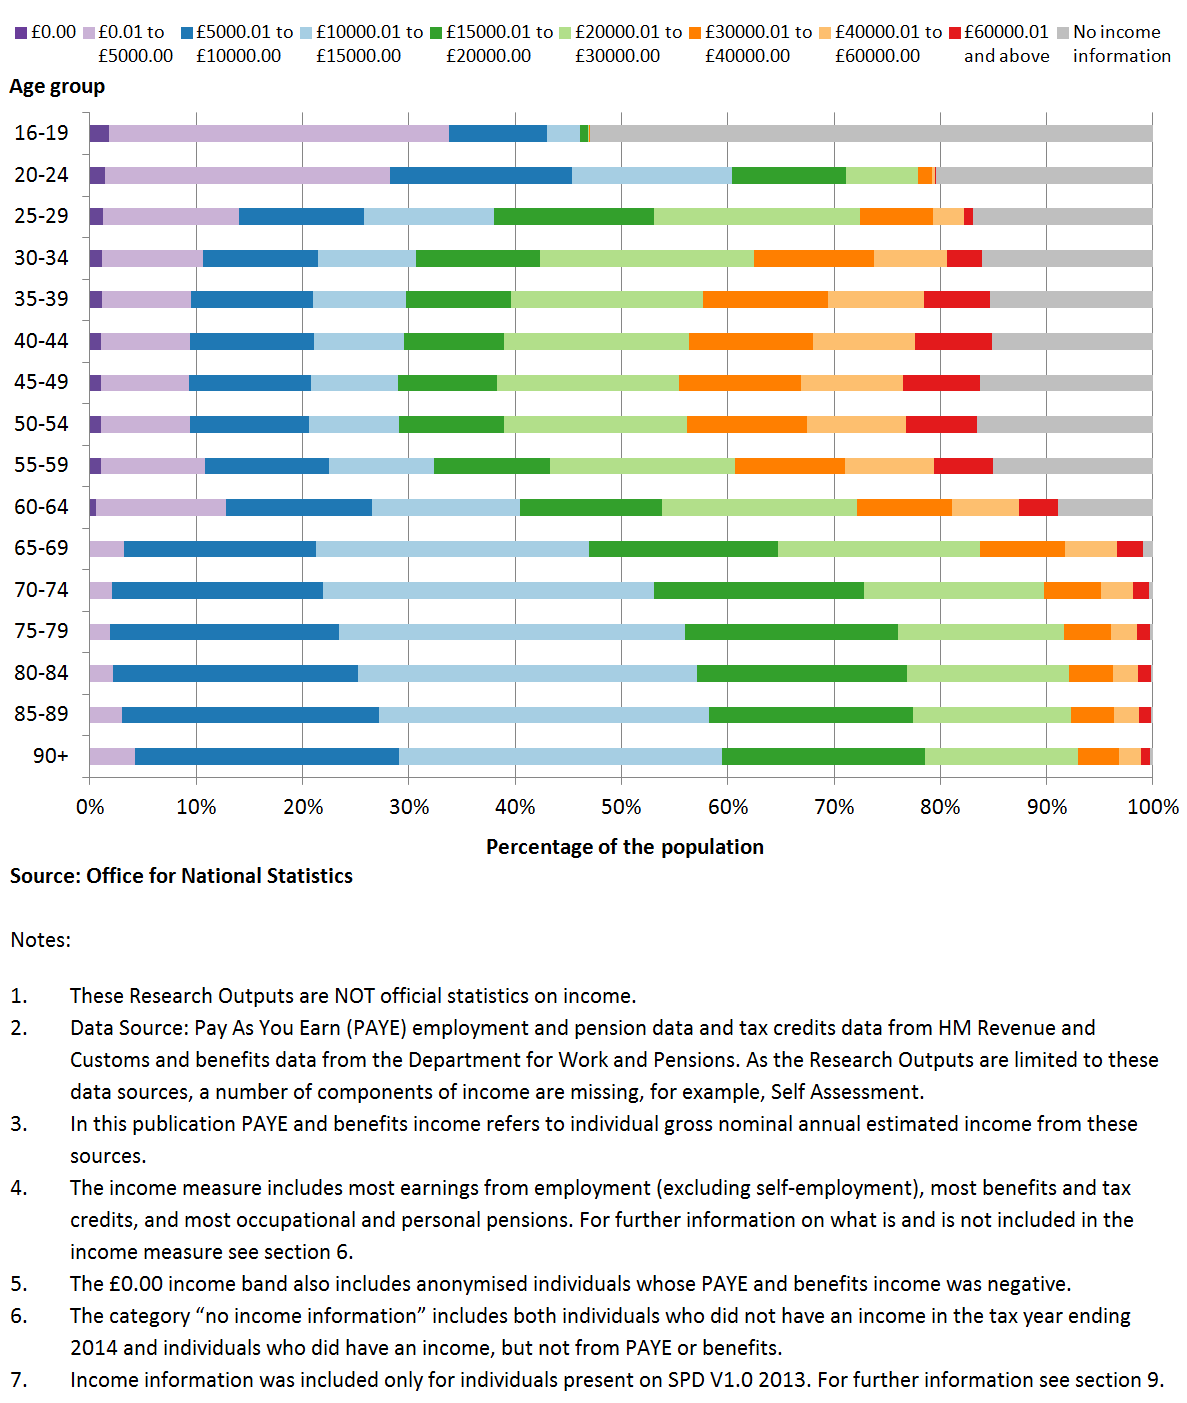
Figure 13 shows the PAYE and benefits income distribution for the male population aged 16 and over by 5-year age group.
Due to the components of income that are not included in these Income Research Outputs, income is underestimated for a large percentage of the population. This results in a distribution biased towards the lower income bands.
Over 50% of 16- to 19-year-olds fell within the “no income information” category. This was a much higher percentage than for any other age group. The 16- to 19-year-old age groups are less likely to have an income than other age groups. Therefore, in reality many of these individuals probably fall within the £0.00 income band.
A lower percentage of 16- to 19-year-olds and 20- to 24-year-olds fell within the higher income bands compared with the other age groups. Many individuals at these younger ages were likely to be studying and therefore may have had an income only from part-time work.
The population aged 30 to 64 had the highest percentage of individuals in the higher income bands.
At ages 65 and above, a lower percentage of individuals fell within the £0.01 to £5,000 band compared with the other age groups. In addition, at these older ages, the percentage of individuals with “no income information” was also much lower. These patterns are likely to be because the majority of individuals aged 65 and over are in receipt of a State Pension (amounting to more than £5,000 if claimed for a full year).
Figure 13: PAYE and benefits income distribution for males by age, England and Wales
Tax year ending 2014, males, aged 16 and over
Download this image Figure 13: PAYE and benefits income distribution for males by age, England and Wales
.png (80.9 kB) .xls (32.3 kB)Figure 14 shows the PAYE and benefits income distribution for the female 16 and over population by 5-year age group.
The pattern is similar to the pattern seen for the male population in Figure 13. For example, a large percentage of 16- to 19-year-olds fall within the “no income information” category.
A lower percentage of females aged 25 and over fall within the higher income bands compared with males.
For females aged 70 and over, the percentage within income bands up to £10,000 decreases with age. The opposite trend is seen for males.
Figure 14: PAYE and benefits income distribution for females by age, England and Wales
Tax year ending 2014, females, aged 16 and over

Download this image Figure 14: PAYE and benefits income distribution for females by age, England and Wales
.png (81.0 kB) .xls (32.8 kB)9. Method
Main method points
Administrative datasets on Pay As You Earn (PAYE) income and benefits (including tax credits) were linked to derive an individual gross annual estimated income amount.
Statistical Population Dataset (SPD) V1.0 was used as the population base and income information was included only for individuals present on SPD V1.0.
Income information refers to receipts during the tax year ending 2014. Demographic characteristics, such as age and geography, are taken from SPD V1.0 as at 30 June 2013.
For many of the armed forces population their income information was not included in the Income Research Outputs. The armed forces were added to SPD V1.0 at aggregate level and therefore it was not possible to link their income information at record level.
Administrative data used to construct an individual annual income amount
The Income Research Outputs were produced by combining income information from 4 administrative data sources provided to the Office for National Statistics (ONS) from the Department for Work and Pensions (DWP).
HM Revenue and Customs’ (HMRC) PAYE dataset contained the individual gross annual income amount processed through the PAYE system for the tax year ending 2014. It contained the total amount paid to an individual in the tax year after pension contributions and before deductions such as tax, National Insurance and student loan payments.
HMRC’s tax credit dataset contained the annual household tax credit amount for the tax year ending 2014. Partner information was also provided.
DWP’s Single Housing Benefit Extract (SHBE) contained information on housing benefit awards for the tax year ending 2014. The start and end dates and the last weekly payment amount for each housing benefit claim were included. Partner information was also provided.
DWP’s National Benefits Database (NBD) contained information on a number of different benefits (for more information see section 6). The start and end dates and the last weekly payment amount for each benefit claim were included. Partner information was also provided.
ONS has assessed each of these datasets and investigated their potential for use in producing income statistics. Further information on these data sources can be found in “Data Source Overview: Income and benefits”.
Method to produce individual annual income amounts
Each dataset was standardised to contain individual annual income amounts for the tax year ending 2014. To achieve this, the following assumptions were made:
to calculate an annual benefit amount rather than a weekly benefit amount for SHBE and NBD it was assumed that the weekly benefit rate (at the end of the claim) was consistent throughout the claim
for ongoing benefit claims the weekly amount was calculated using the benefit rate for the tax year ending 2015
the weekly benefit amount was multiplied by the number of weeks the claim was active in the tax year
for tax credit, Housing Benefit and NBD claims with a partner present, the household amount was split evenly between the main claimant and the partner
These assumptions were necessary due to the nature and structure of the data that were available to ONS and are a limitation of the Income Research Outputs. To make improvements to these assumptions, ONS is working with DWP and HMRC towards expanding the detail and range of administrative data that can be shared. This is dependent on new legislation, which may be met through the Digital Economy Bill.
Once standardised, the 4 administrative datasets were linked via a unique identifier. This unique identifier was created by DWP specifically for ONS purposes.
The individual annual incomes from each dataset were summed to derive an overall annual income amount for each individual (Figure 15). Where an individual’s total annual income was negative this was set to zero. Negative income values can validly occur within the PAYE dataset if an employer adjusts an employee’s pay. For example, if an individual leaves employment and the employer recovers either pay or benefits in kind this can result in an overall negative amount for the tax year. An income of zero can also validly occur in the datasets when an individual appears in the administrative system but has not received a payment within the tax year. For example, individuals on zero hour contracts who have not worked within the tax year of interest.
Figure 15: Method for the production of the Income Research Outputs

Source: Office for National Statistics
Notes:
Pay As You Earn
Single Housing Benefit Extract
National Benefits Database
A Statistical Population Dataset (SPD) is a single, coherent dataset that forms the basis for estimating the size of the resident population. It is produced by linking records across multiple administrative data sources and applying a set of inclusion and distribution rules.
Download this image Figure 15: Method for the production of the Income Research Outputs
.png (50.1 kB)The combined income dataset was then linked to SPD V1.0 2013 via the same unique identifier. An SPD is a single, coherent dataset that forms the basis for estimating the population. It is produced by linking records across multiple administrative data sources and applying a set of “inclusion and distribution rules”. In particular, it should be noted that the armed forces population were added to SPD V1.0 at aggregate level. This is because of differences in the presence of the armed forces population in administrative data sources in comparison with the general population. It was therefore not possible to link income information for many of the armed forces to SPD V1.0 despite their presence in the population base. For more information on SPD creation, the data sources used to build SPDs and how armed forces were included see the Administrative Data Research Report.
After linking the combined income dataset to SPD V1.0, 3 types of record remained: individuals with income information but who were not on SPD V1.0 (11.3%); individuals with income information and who were on SPD V1.0 (77.4%); and individuals without any income information but who were on SPD V1.0 (11.3%). SPD V1.0 2013 was used as the population base for the Income Research Outputs and therefore only individuals present on SPD V1.0 (the last 2 groups) were included. Income information for individuals not present on SPD V1.0 (the first group) was excluded (Figure 15).
Age, sex and local authority (LA) distributions of total annual income were then produced from the linked income and SPD V1.0 dataset. Distributions were produced by counting the number of individuals in each income bracket by demographic group and LA.
SPD V1.0 2013 refers to the resident population in England and Wales on 30 June 2013. Residents with income information for the tax year ending 2014 but who arrived in England and Wales after this date will therefore fall within the first group (individuals with income information but who were not on SPD V1.0) and will be excluded from the Income Research Outputs. Therefore there is a discrepancy between the date used for the population base and the 2013 to 2014 income reference period. This discrepancy will have led to the exclusion of valid income information for the tax year ending 2014. The 2013 SPD V1.0 was used instead of 2014 SPD V1.0 as greater linkage with the income dataset occurred.
SPD V1.0 contains demographic information on the age, sex and address of individuals. Income information was included only for individuals aged 16-years and over on the SPD V1.0 reference date. Therefore, income information will have been included in the Income Research Outputs for individuals aged 15 at the start of the tax year but who had turned 16 by 30 June 2013. In contrast, income information will have been excluded for individuals who turned 16 during the tax year but after 30 June 2013.
During SPD V1.0 construction, some individuals were allocated a weight of 0.5 in 2 different LAs. This occurred for individuals with an address conflict between data sources (for more information on SPD V1.0 distribution rules see Table 5 in Administrative Data Research Report). To produce the Income Research Outputs, the total annual income amount for these individuals was allocated to both LAs but the individual contributed only 0.5 towards the person count. For example, an individual allocated to 2 LAs on SPD V1.0 with an annual income of £12,000 would have been placed within the £10,000.01 to £150,00.00 income band in both of these LAs. However, they would have increased the person count by only 0.5 for this income band in each LA. Their total annual income was not divided by 2 and split between the 2 LAs. During construction of SPD V2.0 address conflicts are resolved and all individuals are allocated to a single LA with a weight of 1.0. Therefore we do not expect this situation to recur in future publications of the Income Research Outputs as we would use SPD V2.0 or the most recent available.
Back to table of contents10. Annex A – Components of income
Gross (total) household income as defined in the UN Economic Commission for Europe (UNECE) Canberra Group Handbook on Household Income Statistics consists of:
Income from employment
Property income
Income from household production of services for own consumption
Current transfers received
While the third component is within the practical definition in the Canberra Group Handbook it is not included in main headline measures of income used for distributional statistics. This is because of concerns about how users would understand this component and the statistical quality of any data. We have followed this general practice and have excluded it from our proposed definition.
Although relating specifically to household income, these components are equally applicable to individual income. The Income Research Outputs do not capture all of these components of gross income. Further details on each of the components (taken from the Canberra Group Handbook) and whether they are included in the Income Research Outputs definition, follow in the remainder of this section.
1. Income from employment
Income from employment covers receipts from participation in economic activities in an employment-related capacity. It consists of the following.
Employee income (most included in our outputs)
Includes direct wages and salaries for time worked and work done, cash bonuses and gratuities, commissions and tips, directors’ fees, profit-sharing bonuses and other forms of profit-related pay, remuneration for time not worked, share entitlements, free or subsidised goods and services from an employer, severance and termination pay, and employers' social insurance contributions.
Income from self-employment (excluded from our outputs)
Consists of the profit or loss that accrues to owners of, or partners in, their own unincorporated enterprises. Income from self-employment excludes profits from capital investments of partners who do not work in these enterprises (silent partners). Income from self-employment includes the estimated value of goods and services produced for barter as well as goods produced for own consumption, less expenses.
2. Property income
Property income, sometimes referred to as investment income, is defined as receipts that arise from the ownerships of assets that are provided to others for their use. They comprise returns from the following.
Financial assets (excluded from our outputs)
Includes both interest and dividends. Interest receipts are payments from accounts with banks, building societies, credit unions and other financial institutions, certificates of deposit, government bonds or loans, securities, debentures and loans to others. Dividends are receipts from investment in an enterprise in which the investor does not work. Pensions and annuities in the form of dividends from voluntary private insurance schemes are also included.
Non-financial assets (excluded from our outputs)
Rents are payments received for the use of both unproduced assets (that is, natural resources), such as land, and for produced assets, such as houses.
Royalties (excluded from our outputs)
Royalties include receipts received from writings and rights to make use of inventions (that is, patented or copyright materials).
3. Income from household production of services for own consumption
Income from household production of services for own consumption include the following.
Owner-occupied housing services (excluded from our definition)
Also known as imputed rent, it is the net value of housing services provided by owner-occupied dwellings.
Unpaid domestic services (excluded from our definition)
Includes the estimated value of own-produced domestic services such as cooking, housekeeping, minor repairs and child care.
Services from household consumer durables (excluded from our definition)
The imputed value of services provided by cars, washing machines and refrigerators.
4. Current transfers received
Transfers are receipts for which the recipient does not provide anything to the donor in direct return for the receipts. Transfers can consist of money, of goods or of services. Current transfers include the following.
Social security pensions or schemes (most included in our outputs)
Social security pensions, insurance benefits and allowances generated from government-sponsored social insurance schemes (compulsory or legal schemes) such as pensions (including military and overseas pensions), unemployment and sickness benefits.
Pensions and other insurance benefits (most included in our outputs)
Pensions and other insurance benefits from employer-sponsored social insurance schemes and private funded schemes not covered by social security legislation (both funded and unfunded).
Social assistance benefits (excluding social transfers in kind) (most included in our outputs)
Social assistance benefits from governments (universal or means-tested), which provide the same benefits as social security schemes, but which are not provided for under such schemes.
Other current transfers (excluded from our outputs)
Current transfers from non-profit institutions (for example, charities and trade unions) in the form of regular gifts and financial support as well as current transfers from other households in the form of family support payments (such as alimony and child support), regular receipts from inheritances and trust funds and financial support.
11. Annex B – Information on benefits
The benefits listed in this annex are those included in the Income Research Outputs. Further information on all benefits can be found on the GOV.UK website.
Attendance Allowance
A benefit for people aged 65 or over who need help with personal care because of a mental or physical disability.
Carer’s Allowance
A benefit for people who are looking after an individual with significant care needs and who fulfil certain criteria.
Child Tax Credit
Provides support to help with the cost of raising a child for those with low incomes.
Disability Living Allowance
A benefit for people who become disabled before the age of 65 and need help with personal care, getting around or both.
Employment and Support Allowance
Financial support and personalised help for those whose illness or disability affects their ability to work.
Housing Benefit
A benefit that is administered by local authorities, which is designed to assist people who rent their homes and have difficulty meeting their housing costs.
Incapacity Benefit
A benefit paid to people assessed as being incapable of work and who meet the contribution conditions (being replaced by Employment Support Allowance).
Income Support
A benefit for adults aged 18 or over on low income. Available only for those not claiming Jobseeker’s Allowance or Employment and Support Allowance.
Jobseeker’s Allowance
A benefit that is payable to people under State Pension age who are both available for and actively seeking work. There are both contribution-based and income-based routes of entry to Jobseeker’s Allowance.
Pension Credit
A benefit paid to those who have reached the Pension Credit qualifying age.
State Pension
A benefit paid to those who have reached State Pension age and have paid enough National Insurance contributions or are covered by their spouse’s contributions.
Severe Disablement Allowance
A benefit for people below State Pension age who are incapable of work and who do not satisfy the contribution conditions for Incapacity Benefit (being replaced by Employment Support Allowance).
Widow’s benefits or bereavement benefits
Financial support for those who have lost a partner.
Working Tax Credit
Support to boost the income of working people who are on a low income.
Back to table of contents12. Annex C – Comparison with existing data sources on income and earnings
Back to table of contents
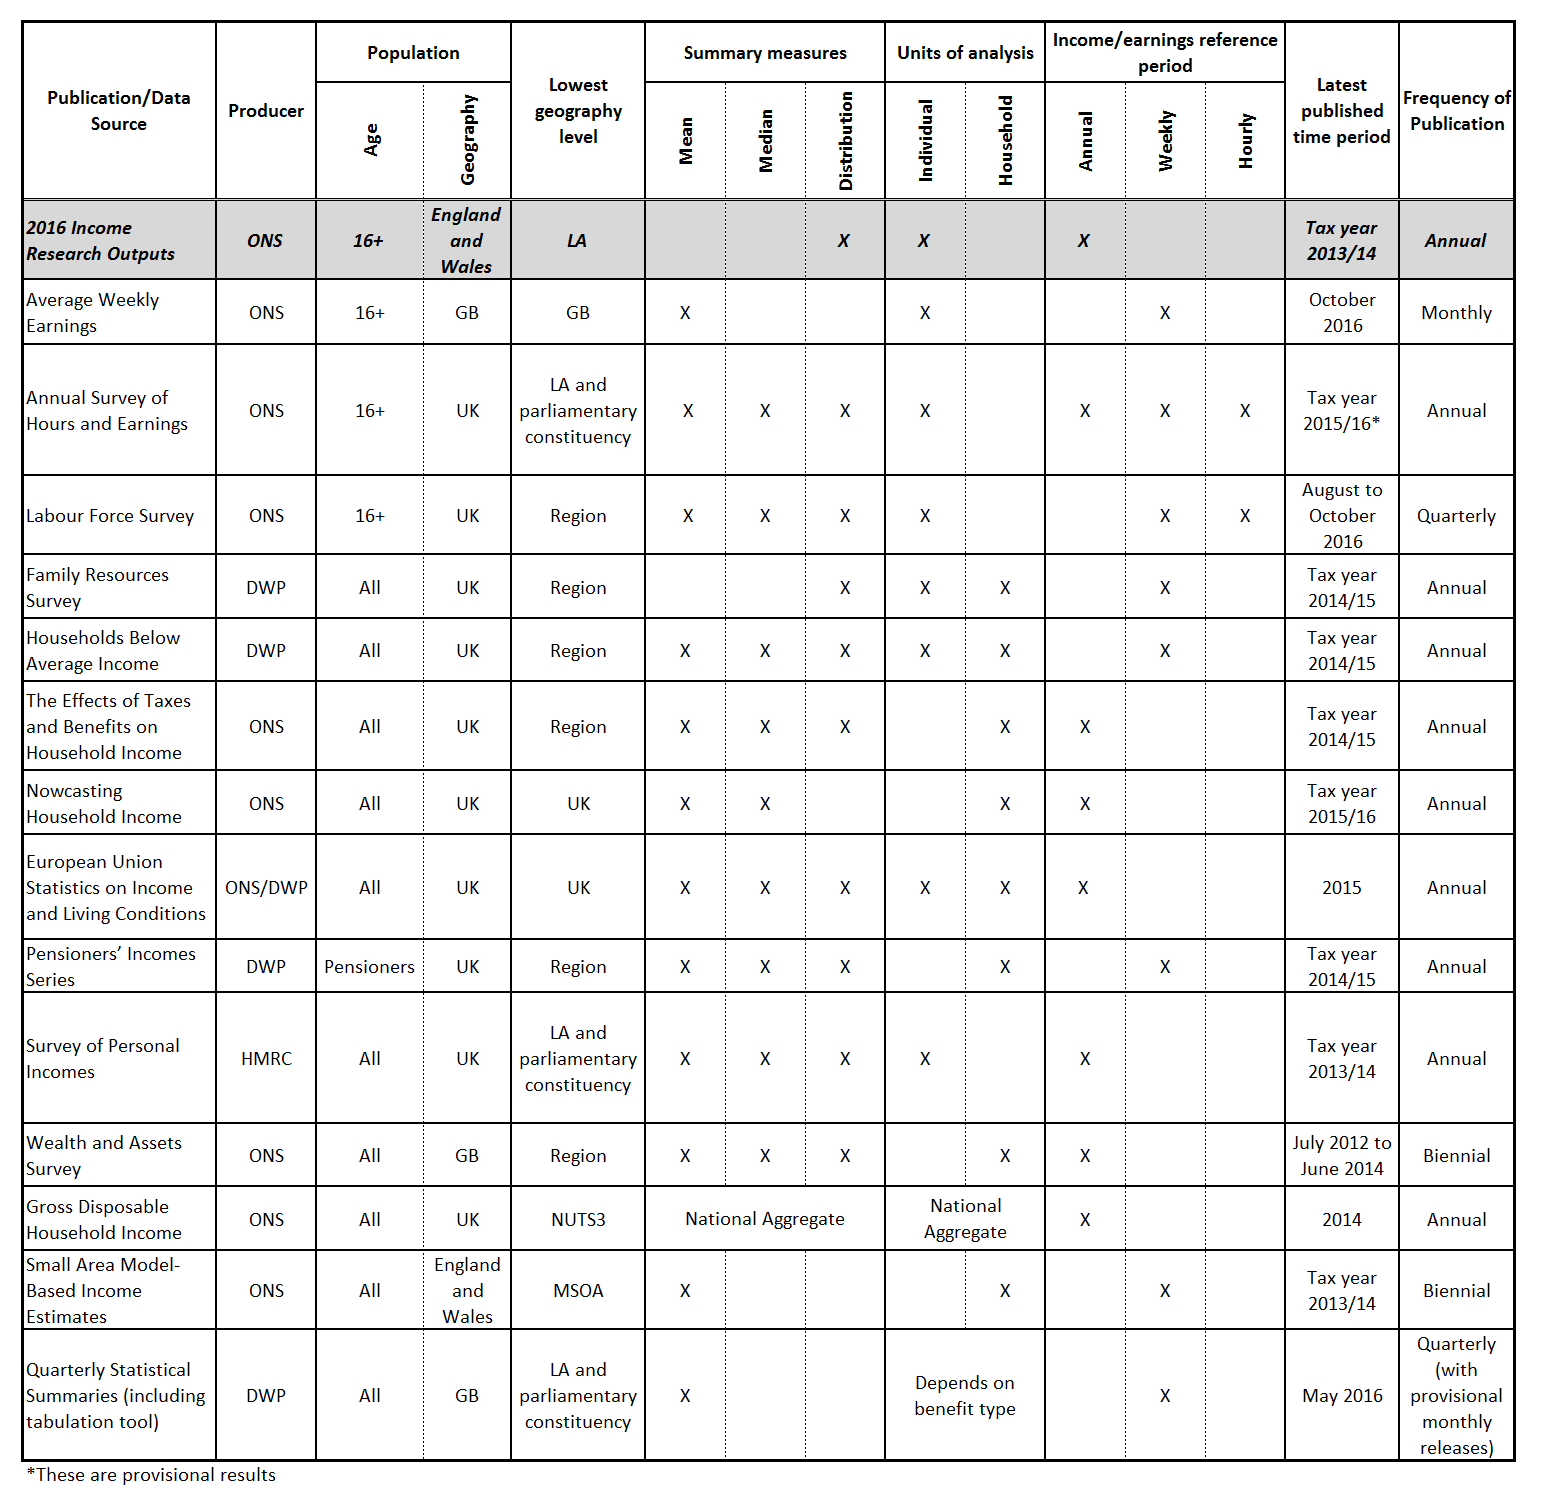
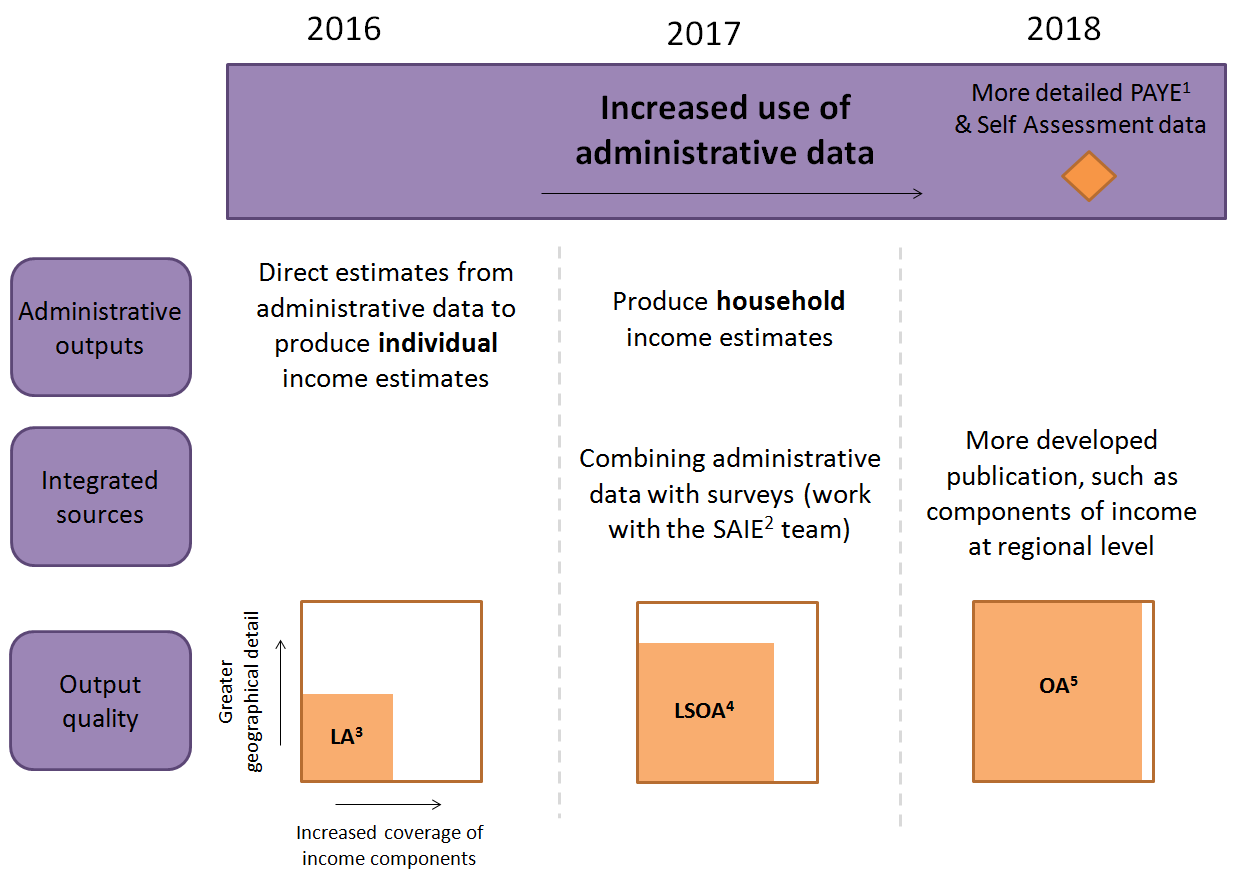
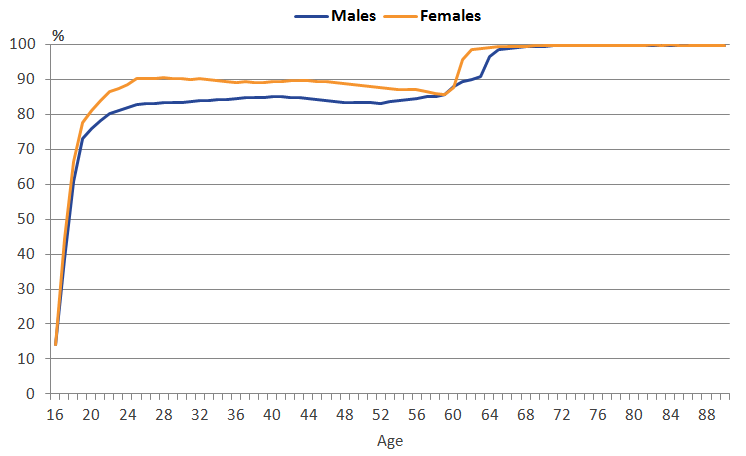
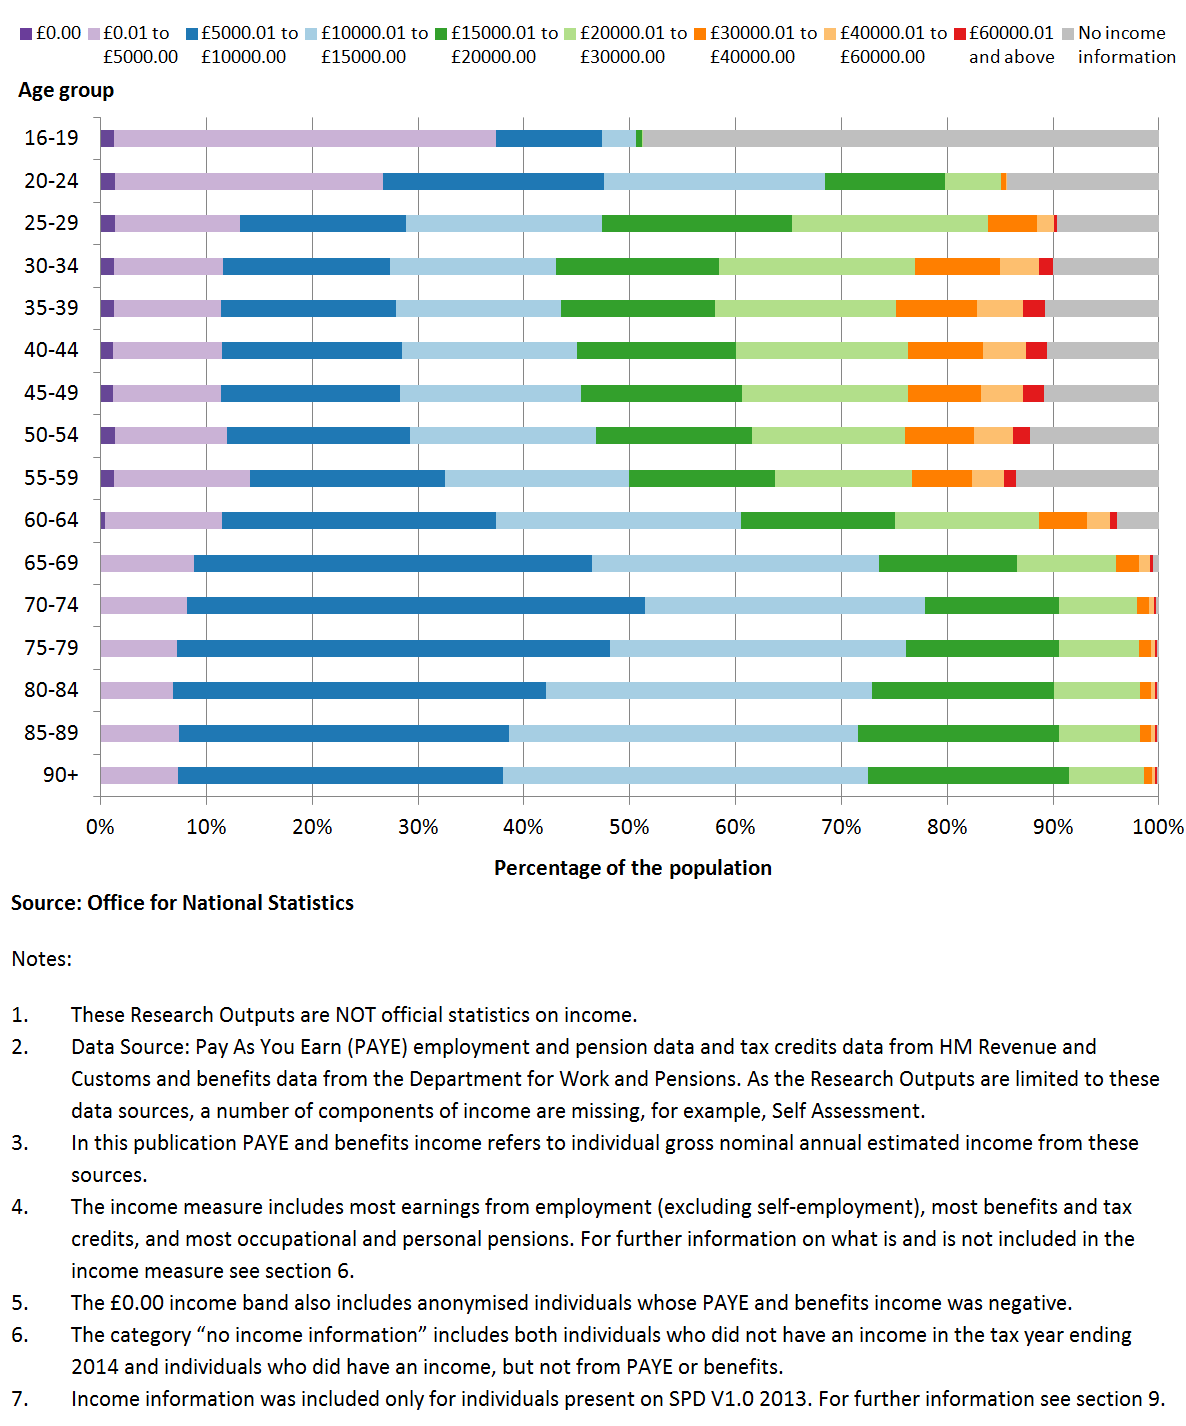
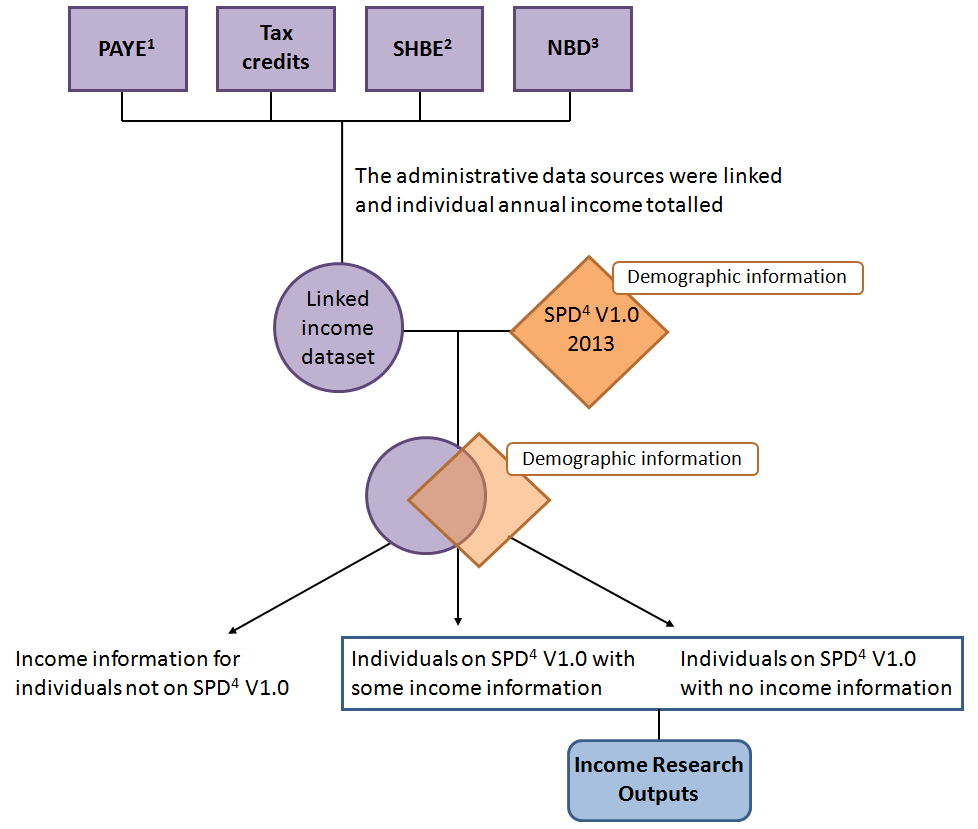
You might also be interested in:
- Research Outputs: Estimating the size of the population in England and Wales, 2017 release
- Research outputs estimating the size of the population in England and Wales: 2016 release
- Progress updates – transforming our population and migration statistics
- Income estimates for small areas, England and Wales: financial year ending 2014