1. Disclaimer and feedback
The Research Outputs are NOT official statistics on the population. Rather they are published merely as outputs from research into a methodology different to that currently used in the production of population statistics.
It is important that the information and research presented on these pages be read alongside the outputs to aid interpretation and avoid misunderstanding. These outputs must not be reproduced without this disclaimer and warning note.
If you have any questions or feedback please email Admin.Data.Census.Project@ons.gov.uk (and include the subject line "Research Outputs feedback"). Many thanks.
Back to table of contents2. Introduction
This report provides an update of our methodology for producing population estimates from administrative data. Last year we published Research Outputs for years 2011, 2013 and 2014 by linking administrative records between three datasets: the NHS Patient Register (PR), the DWP Customer Information System (CIS), and data from the Higher Education Statistics Agency (HESA). This is done using a pseudonymisation approach to preserve privacy of information about individuals and households.
Inclusion and exclusion rules were applied to these linked datasets to establish a version one methodology for constructing a Statistical Population Dataset (SPD V1.0). A detailed description of the SPD V1.0 methodology used to produce population estimates in last year's release is available .
We have since developed these rules to produce population estimates from an SPD V2.0 methodology. These estimates are available for years 2011 and 2015 and can be compared with V1.0 estimates. An analytical report accompanies this methodology report to highlight the main differences observed in the comparison of SPDs V1.0 and 2.0 with official ONS population estimates.
Back to table of contents3. Statistical Population Dataset (SPD) V2.0 methodology
Three new components have been incorporated in the Statistical Population Dataset (SPD) V2.0 methodology to improve the quality of population estimates. These are:
the inclusion of School Census (SC) records to improve the coverage of children aged 5 to 14
the inclusion of additional records that have been linked between the NHS Patient Register (PR), the Department for Work and Pensions (DWP) Customer Information System (CIS), and Higher Education Statistics Agency data (HESA)
the redistribution of "half-weighted"1 records on SPD V1.0 to the address where they are most likely to be resident in SPD V2.0
Table 1 describes the main issues with SPD V1.0 that are addressed in SPD V2.0 and describes the rules implemented to achieve this.
| SPD V1.0 issue | Methods used to address in SPD V2.0 |
|---|---|
| Lower estimates in comparison with official estimates for the number of children aged 5 to 14 in England and Wales | Inclusion of School Census (SC) records matching to either PR or CIS |
| Missing records from SPD V1.0 as a result of failures to make all possible matches between records on PR, CIS and HESA | Use of probabilistic matching methods to link residual unmatched PR and CIS records. |
| Introduce a methodology for resolving three-way matching conflicts between HESA, PR and CIS records | |
| A biased redistribution methodology based on 'half-weighting' records between PR and CIS locations | Combined use of NHS Personal Demographic Service (PDS) movers extract and a modelling approach to determine most likely address |
Download this table Table 1: Issues identified with SPD V1.0 and methodological changes implemented in SPD V2.0
.xls .csvWe now describe each of these methodological changes in more detail and present some high level analysis of the impact on V2.0. For a more detailed understanding of how these methodological changes have improved performance against our official population estimates, refer to the analysis report that accompanies this report.
Notes
- "Half- weighted" SPD records are those that are weighted 0.5 in the PR and CIS location if the individual is registered at different addresses in each source.
4. Inclusion of School Census (SC) records
In our analysis of Statistical Population Dataset (SPD) V1.0 we highlighted that estimates for children aged 5 to 14 were particularly low. In 2011, SPD V1.0 estimates were approximately 2.5% lower than the census estimates for those aged 5 to 9, and around 3.5% lower than census for the 10 to 14 age group. Overall, there was a difference of around 200,700 children aged between 5 and 14 between the 2011 Census and SPD V1.0.
For SPD V1.0, children in these age groups had to be registered on both the Department for Work and Pensions (DWP) Customer Information System (CIS) and the NHS Patient Register (PR) to be included in the estimates. In some circumstances, children who are usually resident1 will not be recorded on both of these datasets. For example, children whose parents have not applied for child benefit may not be registered on the CIS. In addition, children with alternative health care arrangements may not be on the PR.
For SPD V2.0, we have attempted to improve the coverage of these children by including School Census (SC) records on the SPD when there is evidence of a link to either the PR or the CIS. The School Censuses include all children registered with state schools. More information about the English and Welsh School Censuses can be found in the Source Report.
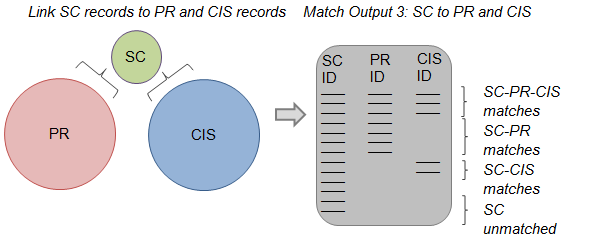
School Census data have been matched separately to the PR and CIS data using the deterministic matching method used to match sources for SPD V1.0. Detailed information about the matching methodology is available. The resulting match outputs are shown in table 2.
| Match type | Number of records (thousands) | Percentage of SC records |
|---|---|---|
| PR-CIS-SC | 7,734 | 97.0 |
| PR-SC | 144 | 1.8 |
| CIS-SC | 52 | 0.7 |
| Unmatched SC records | 47 | 0.6 |
Download this table Table 2: Match outputs from linking SC records to PR and CIS
.xls .csvhe table shows that the majority of SC records (97%) can be matched to both the PR and the CIS. These records will already have been included in SPD V1.0. Records that have been added in SPD V2.0 are the 144,000 links between the SC and PR (and not the CIS), and the 52,000 links between the SC and CIS (and not the PR).
Inconsistencies in the administrative data (for example different names, dates of birth and/or addresses) are more likely to result in matching errors, so the remaining 49,000 (0.6%) of SC records that are not matched to either the PR or CIS will include some instances where a link should have been made between records. However, based on previous assessments of linkage quality, missed matches are estimated to comprise less than 2% of the residual unmatched SC records. The majority of these unmatched records will be for children who do not appear on either the PR or the CIS.
Figure 1 shows the impact of SC inclusions on SPD estimates for England and Wales by single year of age:
Figure 1: Number of additional records added to SPD V2.0 as a consequence of linking SC records, England and Wales, 2011
Notes:
- SPD – Statistical Population Dataset.
Download this chart Figure 1: Number of additional records added to SPD V2.0 as a consequence of linking SC records, England and Wales, 2011
Image .csv .xlsSchool Census (SC) redistributions
SC data is collected annually and it is therefore likely that address information is updated more regularly on the SC than it is on the PR or CIS. For SPD V2.0 we have counted children in their SC address with the expectation that it will improve the accuracy of population estimates for children aged 5 to 14 at local authority level.
Children who are not registered with state schools are still included on SPD V2.0 if they are registered on both the PR and CIS. In circumstances where these sources have conflicting address information, these children are assigned to the address where we determined they are most likely to be resident (see section 6).
Notes:
- Usually resident population – we are currently adopting the UN definition of "usually resident" – that is, the place at which a person has lived continuously for at least 12 months, not including temporary absences for holidays or work assignments, or intends to live for at least 12 months (United Nations, 2008).
5. Improvements to matching methodology
Statistical Population Dataset (SPD) population estimates are produced by linking administrative records. In the absence of a Person Identification Number (PIN), our linkage methodology has been based on matching individuals on their name, date of birth, sex and postcode. We are currently required to link administrative and survey data using a pseudonymisation approach to preserve the privacy of information about individuals and households.
Due to inconsistencies that exist in the capture of this information, two types of error can occur in the matching process. These are: (1) false positives – incorrect matches that have been made between records, and (2) false negatives – missed matches that have not been correctly identified between records.
SPD V1.0 relied on a deterministic matching algorithm comprising 11 match-keys. These keys were designed to accurately identify matching records that have high levels of agreement across name, date of birth, sex and postcode. More information about the match-key methodology is available in a previous Beyond 2011 Matching Anonymous Data paper. SPD V1.0 has been assessed to have very few false positive matches using this deterministic approach (less than 0.5%), but is estimated to be missing between 1% and 2% of possible matches overall. In areas with higher rates of internal migration, missed matches may be higher as a result of address information not being up to date on the NHS Patient Register (PR) and the Department for Work and Pensions (DWP) Customer Information System (CIS). This year, we have introduced two new components to the matching algorithm to reduce the number of missed matches (false negatives) in SPD V2.0:
a probabilistic matching algorithm to link additional records between the PR and CIS that were previously missed in SPD V1.0
a three-way resolution of records that do not match consistently across the PR, the CIS and Higher Education Statistics Agency data (HESA)
SPD V2.0 probabilistic matching
Probabilistic matching is a mathematically formularised approach to calculate agreement scores between candidate pairs of linked records (see Fellegi-Sunter, 1969). For SPD V2.0, we are using this approach to identify further links between PR and CIS records that have not already been matched using deterministic matching in SPD V1.0. Below is a summary of the process:
all residual PR and CIS records that remain unmatched following the deterministic matching are compared with each other; for each single PR record, comparisons are made with all CIS records on forename, surname, date of birth, sex and postcode
PR and CIS records that partially agree on at least two of these five matching fields are retained as potential candidates in the match pool
an Expectation-Maximisation (EM) algorithm is used within the Fellegi-Sunter probabilistic matching framework (Herzog et al, 2007) to calculate agreement scores between all of the candidate pairs in the match pool
an analysis of the score distribution of candidate pairs is used to determine a threshold for accepting or rejecting links in the match pool; those candidate pairs with agreement scores higher than the threshold are accepted as matches to be included in SPD V2.0; those below are excluded
For SPD V2.0, a conservative threshold was set to ensure that additional links made between the PR and CIS were correct matches. This has ensured that false positives (or incorrect matches) have been kept to a minimum on SPD V2.0. Minimising false positives on the SPD is important for our future plans to use a coverage survey for adjusting biases on the SPD. A population estimation methodology that depends on linking persons and households from a coverage survey requires matching to a very high standard (ONS, 2013). The quality of linkage produced by the pseudonymisation method is currently not high enough to make accurate adjustments using a coverage survey. We are reviewing our approach to record linkage and continue with further research into developing methods that minimise both false positive and false negative errors on the SPD.
Inclusion of probabilistic matches
The probabilistic method has resulted in a further 170,000 additional matches between the PR and CIS, which are now included in the SPD V2.0 estimates for 2011.
A high proportion of these matches have been made for individuals whose address information is inconsistent on the PR and CIS. This has the effect of increasing the number of ""half-weighted" records that need to be full-weighted, using the new redistribution methodology included in SPD V2.0 (see section 6).
Figure 2 shows the age and sex distribution of the additional matches made between the PR and CIS in 2011 using probabilistic matching. This shows that the majority of these records are males, with most aged between 20 and 60, peaking in the early to mid-30s. While these additional links have been assessed to be accurate, they have increased the number of working-aged males on the SPD, which was already higher than official estimates using V1.0. The impact of this is discussed in more detail in our analysis report.
Figure 2: Additional records added to SPD V2.0 from probabilistic matching between PR and CIS, England and Wales, 2011
Source: Office for National Statistics
Notes:
- SPD – Statistical Population Dataset.
- PR – NHS Patient Register.
- CIS – Department for Work and Pensions (DWP) Customer Information System.
Download this chart Figure 2: Additional records added to SPD V2.0 from probabilistic matching between PR and CIS, England and Wales, 2011
Image .csv .xlsResolving 3-way matches between PR, CIS and HESA
One of the advantages of linking records from across three or more datasets is that some matching errors can be easily detected. For example, in the construction of SPD V1.0 there were some instances where pairs of matched PR and CIS records were matched to different HESA records. There are multiple explanations that can account for why this scenario can occur in the matching process:
The two HESA records are in fact duplicates relating to the same individual. Successful de-duplication of these records would have resulted in the correct HESA record being matched to the PR and CIS and the individual being counted in their HESA term time location.
The PR and CIS records do not relate to the same individual and they have been matched in error. The link between the PR and CIS record needs to be broken and two records created on the SPD, both of which are counted in the HESA term time location.
The PR and CIS records do relate to the same individual but one of them has been matched to an incorrect HESA record. In this situation the erroneous link needs to be substituted with a link to the correct HESA record, resulting in the record being counted in their HESA term time location.
The scenario outlined above is just one example of inconsistencies that can appear when examining match results across three or more linked datasets. To resolve these types of inconsistencies a matching architecture is needed to provide evidence for breaking or substituting links. In the construction of SPD V2.0, we have based this approach on a "statistical spine" that contains all records on the four datasets and the matches made between them. Where inconsistencies occur across matched PR, CIS and HESA records, or across PR, CIS and School Census (SC) records, the match-keys used to confirm each link have been evaluated on their relative strengths. Match-keys that have greater levels of uniqueness (and are therefore least likely to result in false positives) take precedence in resolving these conflicts.
Constructing the "statistical spine"
The statistical spine is a dataset comprising all of the records on PR, CIS, HESA and SC. Within it, matched records have identifiers from two or more datasets in the same row (for example a PR ID and CIS ID) and unmatched records only have a single identifier in a row. The statistical spine also contains information about how the matches were made. All records are pseudonymised to preserve privacy. Figures 3 to 8 show how the statistical spine is constructed.
Figure 3: Step 1 of constructing the statistical spine

Source: Office for National Statistics
Notes:
PR – NHS Patient Register.
CIS – Department for Work and Pensions (DWP) Customer Information System.
Download this image Figure 3: Step 1 of constructing the statistical spine
.png (12.0 kB)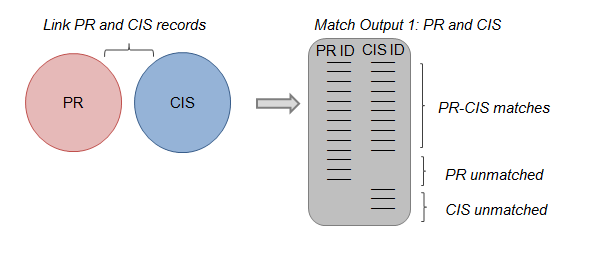
Step 1: The first step in the spine’s construction is to link PR and CIS records and produce a table of match outputs. This table includes all PR and CIS records with three possible outcomes: (1) records that have matched between the PR and CIS, (2) residual unmatched records on the PR and (3) residual unmatched records on the CIS.
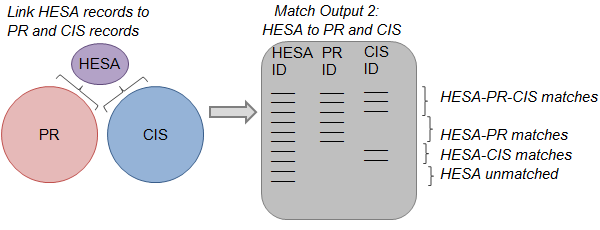
Figure 4: Step 2 of constructing the statistical spine
Source: Office for National Statistics
Notes:
- PR – NHS Patient Register.
- CIS – Department for Work and Pensions (DWP) Customer Information System.
- HESA – Higher Education Statistics Agency.
Download this image Figure 4: Step 2 of constructing the statistical spine
.png (15.8 kB)
Step 2: The second step is to link HESA records to the PR and the CIS in two separate matching exercises. The results are combined to produce a second match output table that includes all of the student identifiers on HESA. Four types of records appear in this table: (1) HESA records that are matched to both PR and CIS, (2) HESA records that are matched only to a PR record, (3) HESA records that are matched only to a CIS record, and (4) HESA records that remained unmatched.
Figure 5: Step 3 of constructing the statistical spine

Source: Office for National Statistics
Notes:
- PR – NHS Patient Register.
- CIS – Department for Work and Pensions (DWP) Customer Information System.
- HESA – Higher Education Statistics Agency.
Download this image Figure 5: Step 3 of constructing the statistical spine
.png (17.9 kB)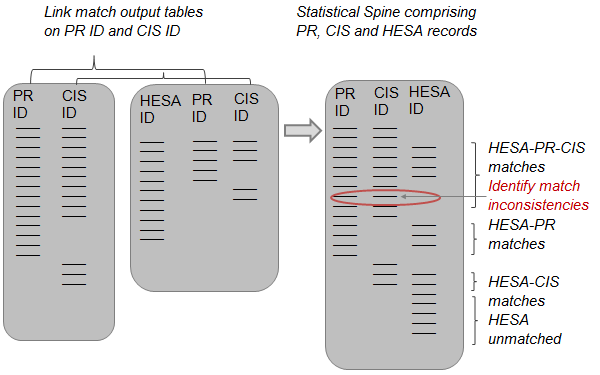
Step 3: The two tables created in steps one and two are then merged together using the PR and CIS identifiers (which both tables have in common). This is the basis of a statistical spine of PR, CIS and HESA records, and the matches made are compared for consistency across the three sources. Where matches made do not align, the match-keys that have been used to make the matches are evaluated separately.
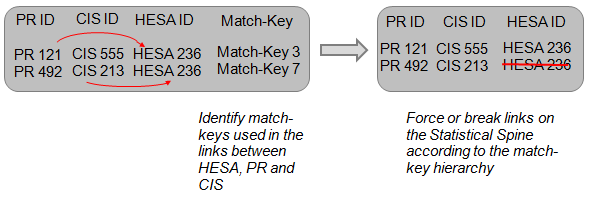
Figure 6: Step 4 of constructing the statistical spine
Source: Office for National Statistics
Notes:
- PR – NHS Patient Register.
- CIS – Department for Work and Pensions (DWP) Customer Information System.
Download this image Figure 6: Step 4 of constructing the statistical spine
.png (13.0 kB)
Step 4: Match inconsistencies are resolved by prioritising the matches that have been made with the most reliable match-key. There are 11 match-keys used to match the administrative data, ordered hierarchically by uniqueness and their potential to minimise false positives. This hierarchy is used as the basis for adjusting matches that are inconsistent across the PR, CIS and HESA records (by breaking or substituting links). In the example in figure 6, a single HESA record has been linked twice to a separate pair of PR and CIS records. The result is a duplication of the HESA record on the spine. In this case, the link between the HESA record and the PR record is accepted, as match-key 3 is the more reliable link in accordance with the hierarchy.
Figure 7: Step 5 of constructing the statistical spine
Source: Office for National Statistics
Notes:
- PR – NHS Patient Register.
- CIS – Department for Work and Pensions (DWP) Customer Information System.
- SC – School Census.
Download this image Figure 7: Step 5 of constructing the statistical spine
.png (16.3 kB)
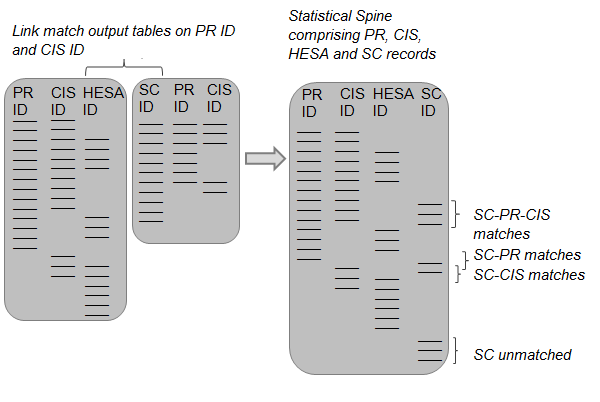
Step 5: Once inconsistencies in the matches between PR, CIS and HESA have been resolved, the next step is to undertake the same process for SC records. The SC is linked to the PR and CIS datasets separately before merging the matching outputs to create a table that contains all pupil records on the SC. As with the table constructed for HESA, there are four types of records that appear in this table: (1) SC records that have matched to both PR and CIS, (2) SC records that are matched only to a PR record, (3) SC records that are matched only to a CIS record, and (4) SC records that remained unmatched.
Figure 8: Step 6 of constructing the statistical spine
Source: Office for National Statistics
Notes:
- PR – NHS Patient Register.
- CIS – Department for Work and Pensions (DWP) Customer Information System.
- HESA – Higher Education Statistics Agency.
- SC – School Census.
Download this image Figure 8: Step 6 of constructing the statistical spine
.png (15.7 kB)
Step 6: The table of SC records with PR and/or CIS identifiers is linked to the spine of PR, CIS and HESA records (by using PR and CIS identifiers). The match-key hierarchy is used to break or substitute links that do not reconcile across the three sources, in the same way described in step 4 (figure 6). The result is a statistical spine of PR, CIS, HESA and SC records.
The end result is a statistical spine that contains all of the records contained in the four datasets PR, CIS, HESA and SC. Every individual person that is held on these datasets appears on the statistical spine in a single row that indicates which records linked across the four sources. One of the advantages of this approach is that new rules in SPD development can be implemented more efficiently as new data sources are linked into the statistical spine. This will be particularly important when multiple sources of "activity data1" have been linked, and the rules for inclusion or exclusion in SPD population estimates become more complicated.
For SPD V2.0, the construction of the statistical spine has resulted in approximately 30,000 additional records being including in the population estimates, for years 2011 and 2015. This is a direct result of resolving the three-way matching inconsistencies that occur across the PR, CIS and HESA, and across PR, CIS and SC. For a very small proportion of records on the SPD "spine" there is a match across all four of these datasets. In these circumstances we have removed the SC record on the assumption that it is out of date, because the individual is now registered in higher education.
Notes:
- "Activity" can be defined as an individual interacting with an administrative system, for example for National Insurance or tax purposes, when claiming a benefit, attending hospital appointments or updating information on government systems in some other way. Only demographic information (such as name, date of birth and address) and dates of interaction are needed from such data sources to improve the coverage of our population estimates.
6. Redistribution of "half-weighted" records
After linking records between the NHS Patient Register (PR) and the Department for Work and Pensions (DWP) Customer Information System (CIS), approximately 3.1 million records (around 5.5% of the SPD population) are registered to be living in different local authorities on the PR and CIS. When making comparisons at Lower Layer Super Output Area (LSOA) level, these location conflicts are much higher, with approximately 11% of records on the Statistical Population Dataset (SPD) registered at different addresses on the PR and CIS. This is usually due to delays in individuals notifying the relevant authority of a change of address, but can also be the result of administrative processing delays, data extract timings, or the fact that some individuals do in fact live at multiple addresses, for example second homes.
The SPD V1.0 "half-weights" methodology, which is based on counting these individuals with a weight of 0.5 in both local authorities, was a pragmatic approach for distributing records to produce local authority population estimates. However, the "half-weights" methodology has considerable limitations. These are:
it results in biased estimates for local authorities that have higher rates of inward migration compared with outward migration, and vice versa (see our case study of South Bucks reported in last year's report)
it introduces additional complexity when trying to produce other research outputs that need to be constructed at household level (for example, household size and household structure)
For this reason we have developed methods for SPD V2.0 that determine the most likely address for cases where there is disagreement between the PR and CIS. Two separate areas of research have been progressed during development of SPD V2.0, with the aim of eliminating the use of "half-weights". The first uses an extract of movers' data from the NHS Personal Demographic Service (PDS) dataset and the second uses a logistic regression model using several covariates (discussed later in this section).
In SPD V2.0, the PDS method is applied first, followed by the regression model to resolve the remaining conflicts. In future this may be adjusted if the regression model is found to perform better for certain groups of records or the two approaches could be merged by including the PDS information as a covariate in the regression model.
Redistribution using the NHS Personal Demographic Service (PDS)
About the NHS Personal Demographic Service (PDS)
The PDS is the national electronic database of National Health Service (NHS) patient demographic details. The information on the PDS can be updated any time a person uses an NHS service, including General Practitioner (GP) surgeries, as well as hospitals, as an inpatient or outpatient. Hence, it is likely to hold more recent information than the PR, which is based only on GP registrations or changes that are updated via contact with the GP (for example change of address). Currently we receive only a subset of PDS records for each year, which is limited to those individuals that have notified health providers of a change of address. This PDS "movers" extract is limited to basic demographic variables including name, sex, date of birth, address, and notification dates relating to change of address. We use a pseudonymisation approach to preserve privacy of information about individuals and households. The extract does not contain any information about specific health conditions, appointments or episodes of care. More detailed information about the PDS is available in our source report. Figure 9 summarises the differences between the PR and PDS data.
Figure 9: Differences between patient information collected on PR and PDS

Source: Office for National Statistics
Notes:
- PR – NHS Patient Register.
- PDS – Personal Demographic Service.
- ONS – Office for National Statistics.
- GP – General Practitioner.
- A&E – Accident and Emergency.
Download this image Figure 9: Differences between patient information collected on PR and PDS
.png (28.8 kB)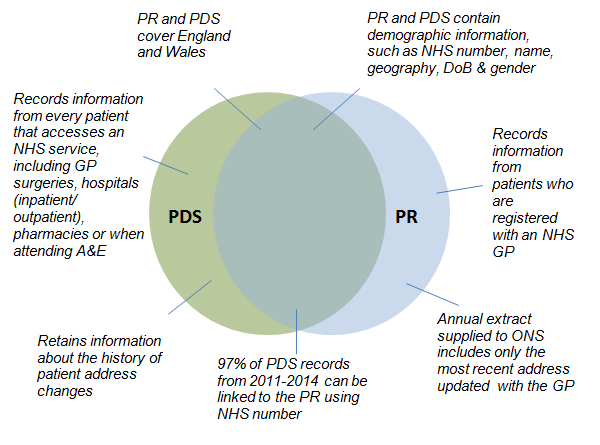
We currently have access to an extract from the PDS that covers those records for which a change of postcode was recorded throughout the year, and also new NHS registrations. The data represent specific interactions with the service, so can be used as evidence of "activity"1.
In future, it may be possible to use the PDS as the basis for including additional records on the SPD, but this depends on further research to determine the appropriate method. In SPD V2.0, this "activity" is used only to confirm the address where there is a discrepancy between the PR and the CIS. Further improvements may also be possible in future if there is some evidence that the PDS address is more reliable than the agreed address held on both the PR and the CIS.
Initial research with this data suggested that it can take several weeks for changes recorded on the PDS to appear on the PR. It also showed that recent movers had a high probability of having conflicting addresses on the PR and CIS sources. The South Bucks case study in the first Research Outputs report showed that around 50% of "half-weighted" records had not changed from that state two years later, showing that "half-weights" can last several years before addresses are updated in both sources.
To make full use of the address information available on PDS, we have appended extracts from previous years (when available), to build up a history of address moves to help determine which address individuals should be assigned to on SPD V2.0. All available PDS datasets from years 2010 to 2014 have been linked to "half-weighted" records with the latest move on PDS selected for analysis.
For the 2011 SPD V2.0, PDS data for the period April 2010 to March 2011 was used, resulting in around 26% of "half-weighted" records being linked to a PDS move. For the 2015 SPD V2.0, PDS data for the period April 2010 to June 2014 was used, resulting in just under 50% of "half-weighted" records being linked to a PDS move. This shows the benefit of using longitudinal data over a number of years, although for the 2015 SPD V2.0, PDS data for the most recent year (July 2014 to June 2015) is not yet available to us. In future SPD development, we intend to compile PDS extracts for the current year as well as several earlier years to maximise the proportion of "half-weighted" records on the SPD that can be linked to a move on the PDS. We also require access to PDS extracts that contain information beyond patients notifying change of address. We have a particular interest in accessing all "activity"-based information, indicative of any interactions with primary and secondary healthcare, for all patients recorded on the PDS.
Methodology for PDS redistribution
The methodology for resolving "half-weighted" records on the SPD using PDS data is based on two criteria. Firstly, a comparison between Output Areas2 (OAs) recorded on the PR and CIS are made with the "origin" and "destination" of the PDS move. Secondly, the PDS effective date (notification of the move) is compared with the address start date on the CIS and the modification date on the PR. Depending on how well these comparisons align, each record can be classified into one of six categories, as described in figures 10 to 14 (note: category six does not contain a figure).
Figure 10: Category 1 – Origin, destination and date agreement

Source: Office for National Statistics
Notes:
- PR – NHS Patient Register.
- CIS – Department for Work and Pensions (DWP) Customer Information System.
- PDS – Personal Demographic Service.
- OA – Output Area.
Download this image Figure 10: Category 1 – Origin, destination and date agreement
.png (16.7 kB)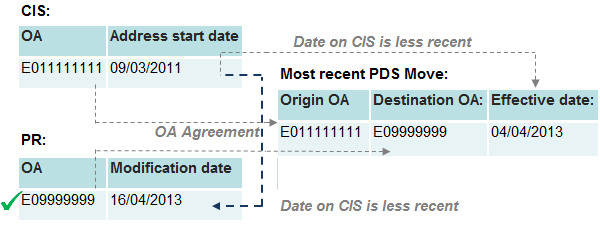
Under category one, the origin and destination of OAs on the PDS match those recorded on the PR and the CIS. The source matching the PDS destination is more recently updated than the source matching the origin, which pre-dates the move date recorded on the PDS. In the example in figure 10, the OA on the CIS matches the PDS origin, and the OA on the PR matches the destination. The PR modification date and the PDS effective date are both more recent than the CIS address start date. The SPD record is therefore fully weighted to the PR address.
Figure 11: Category 2 – Destination and date agreement
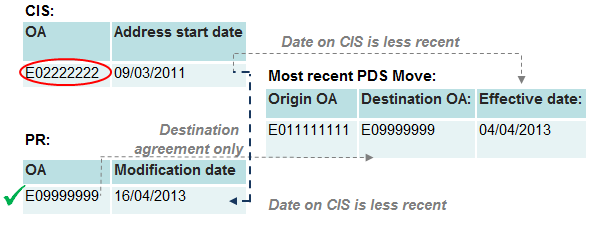
Source: Office for National Statistics
Notes:
- PR – NHS Patient Register.
- CIS – Department for Work and Pensions (DWP) Customer Information System.
- PDS – Personal Demographic Service.
- OA – Output Area.
Download this image Figure 11: Category 2 – Destination and date agreement
.png (18.7 kB)
Under category two, an OA match on the PDS origin is not found on either source. However, one of the sources has a match to the destination OA, and this source has been updated more recently than the other, with the PDS move also more recent than the latest update on the other source. In the example in figure 11, the PR matches the destination, with the PR modification date and PDS effective date both more recent than the CIS date. The SPD record is therefore fully weighted to the PR address.
Figure 12: Category 3 – Origin agreement

Source: Office for National Statistics
Notes:
- PR – NHS Patient Register.
- CIS – Department for Work and Pensions (DWP) Customer Information System.
- PDS – Personal Demographic Service.
- OA – Output Area.
Download this image Figure 12: Category 3 – Origin agreement
.png (16.2 kB)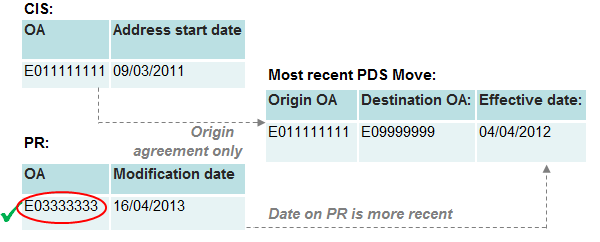
Under category three, neither OA on the PR or CIS matches to the PDS destination. However, one of the sources matches to the origin. We therefore discard the OA shown on this source, and instead select the OA either from the other source or from the PDS destination. This is done by comparing the dates on the PDS and the other source, and choosing the OA from the one with the most recent update. In the example in figure 12, the CIS record that matches the origin OA is now outdated and the SPD record is assigned to the PR address on the basis that the modification date is more recent than the PDS effective date.
Figure 13: Category 4 – Origin and destination agreement

Source: Office for National Statistics
Notes:
- PR – NHS Patient Register.
- CIS – Department for Work and Pensions (DWP) Customer Information System.
- PDS – Personal Demographic Service.
- OA – Output Area.
Download this image Figure 13: Category 4 – Origin and destination agreement
.png (13.1 kB)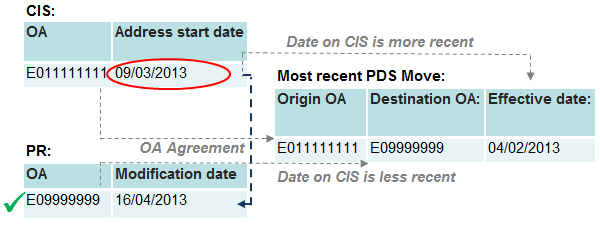
Under category four, the PR and CIS OAs match to the origin and destination on the PDS. However, the date requirements for Category 1 are not met. In the example in figure 13, both the CIS address start date and the PR modification date are later than the PDS effective date. The SPD record is still assigned to the PR address but, due to the PDS record identifying this OA as the destination of a move with the CIS OA as the origin.
Figure 14: Category 5 – Date agreement

Source: Office for National Statistics
Notes:
- PR – NHS Patient Register.
- CIS – Department for Work and Pensions (DWP) Customer Information System.
- PDS – Personal Demographic Service.
- OA – Output Area.
Download this image Figure 14: Category 5 – Date agreement
.png (13.8 kB)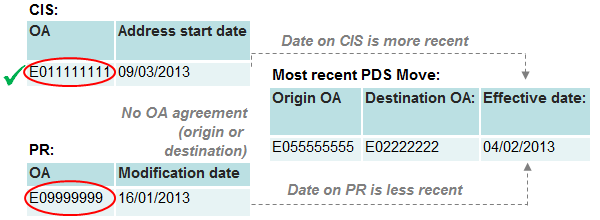
Under category five, neither the origin nor destination OAs on PDS are in agreement with the PR or CIS, and at least one source has been updated more recently than the PDS effective date. In these circumstances we fully weight the SPD record to the source that is more recently updated. In the example in figure 14, both the PDS effective date and PR modification date pre-date the address start date on the CIS. We therefore assign the SPD record to the CIS address.
Category 6
Assume PDS address: This final category is reserved for circumstances when a PDS move has happened within 12 weeks of the PR reference date (in this instance, 31 March 2011). Because it can take up to 12 weeks for PDS interactions to appear on the PR, we assume that this recent "activity" on the PDS is most likely to capture individuals' addresses correctly and we assign them to this address accordingly.
Analysis of PDS redistributions
| Category | Frequency - 2011 (thousands) | Percentage of 'half-weights' - 2011 | Frequency – 2015 (thousands) | Percentage of 'half-weights' - 2015 |
|---|---|---|---|---|
| 1 | 789 | 12.5 | 678 | 9.8 |
| 2 | 573 | 9.1 | 602 | 8.7 |
| 3 | 69 | 1.1 | 267 | 3.9 |
| 4 | 72 | 1.1 | 166 | 2.4 |
| 5 | 143 | 2.3 | 1,729 | 24.9 |
| 6 | 23 | 0.4 | 0 | 0 |
| All | 1,669 | 26.4 | 3,443 | 49.7 |
Download this table Table 3: Categories used for "half-weight" redistributions on SPD V2.0 using PDS data, 2011 and 2015
.xls .csvIn SPD V2.0 2011, over 21% of originally "half-weighted" records were resolved using redistribution categories 1 and 2. We have higher confidence that these categories resolve "half-weights" to the correct address, as there is more evidence corroborating the PR and CIS information with the PDS move. There are also 1.5% of "half-weights" resolved in categories 4 and 6, which we also have reasonably high confidence in due to the certainty around the likely destination. The remaining 3.4% are resolved using categories 3 and 5, which are more ambiguous due to uncertainty around the destination of moves. However, these redistributions are still likely to improve upon "half-weighting" for these records. The remaining 74% of "half-weights" that could not be resolved with evidence of a PDS move are passed to the logistic regression model described in the next section.
In SPD V2.0 2015, the PDS data for 2015 is not currently available to us, and hence only moves occurring up to the end of June 2014 can be found. But the longer back series of data means a PDS move can be found for just less than 50% of "half-weighted" records. The lack of 2015 data also means no records can be assigned to category 6. Despite the proportion of records linked to PDS approximately doubling, fewer can be resolved with the highest levels of confidence. The additional records mainly appear in category 5, with more also assigned to category 3, both of which have a lower confidence in assigning the correct address. The remaining 50% of "half-weights" that could not be resolved with evidence of a PDS move are passed to the logistic regression model described in the next section.
It is anticipated that the addition of the 2015 PDS data would provide later moves for many of these people, allowing better corroboration between the sources and hence the records appearing in higher confidence categories. It would also add further moves between August 2014 and June 2015, which are likely to result in further redistributions of "half-weighted" records.
Impact on SPD V2.0
For a more detailed analysis of the impact of redistributing "half-weighted" records please refer to our analysis report. This includes a section that demonstrates the combined effect of PDS redistributions and logistic regression modelling (outlined below) on population estimates at local authority level. Here we summarise some of the impacts observed from PDS redistributions in isolation.
Applying this method to the 2011 SPD V2.0 is shown to change the local authority level population estimates by between approximately negative 1.7% and positive 0.7% compared to the "half-weighting" method. These figures are extremes that occur for the small local authorities of the City of London and Isles of Scilly; 19 of 348 local authorities have population changes of magnitude greater than 0.2% after applying the PDS method.
In 2015, the PDS method affects local authority populations by between negative 0.6% and positive 1.2%. This overall range is smaller than in 2011, but 45 local authorities have population changes with magnitude greater than 0.2%, showing generally larger impacts in 2015. This is expected due to the PDS method being applied to just under 50% of "half-weighted" records in 2015, as opposed to 26% in 2011.
The most notable difference between 2011 and 2015 is that the PDS method has a greater tendency to increase the populations of London boroughs in 2015. For 2011, the PDS method increases the population of 15 of the 33 London boroughs, whereas 20 are increased in the 2015 SPD. The average change for London areas is negative 0.06% in 2011 and positive 0.09% in 2015. Further research will be necessary to determine whether these changes are due to the differing numbers in each of the categories for the two years, as shown in table 3.
Determining most likely address using logistic regression
In circumstances where PDS data cannot be linked to individuals with PR and CIS address conflicts, an additional method for resolving "half-weighted" records is needed. One way of determining the most likely address between the PR and CIS is to build up a longitudinal picture of who has registered at the address over time. By observing the number of people who have newly registered at an address, it is possible to predict which address an individual is most likely to reside in. We can also utilise other information, for example, whether the individual shares the same surname as other people at the address, or if they receive state benefits, which in some cases are strong indicators of where a person resides.
This year we have tested a new modelling approach on SPD V2.0 by simulating what might be possible from using information collected from a coverage survey. For more detailed information about the methodological framework for combining the SPD with a Population Coverage Survey (PCS) to produce population estimates, see our previously published paper Beyond 2011: Producing Population estimates Using Administrative Data: In Theory.
The PCS that is intended to form part of the population estimates methodology will sample approximately 1% of households annually. For each household responding to the coverage survey, the individuals recorded at the address can be compared with those registered at the same address on the administrative data. Individual records on the SPD that are linked to the PCS can be classified into one of two categories:
individuals who match to the same address on the PCS and are therefore assumed to be correctly registered at that address on the administrative data
individuals who do not link to the same address on the PCS, and are therefore assumed to be incorrectly registered at that address on the administrative data
By using this classification, the PCS can be used to determine the relationship between the "true" address, as observed by the PCS, and the series of addresses on the administrative data sources. For SPD V2.0, a logistic regression model has been used to calculate the probabilities that individuals with "half-weighted" records are likely to be resident at the PR or the CIS address.
Model Framework
For the 2011 SPD, we have simulated a PCS by randomly selecting 1% of all 2011 Census records in postcodes from each local authority. We then subset the addresses on the SPD that have at least one individual registered at the addresses that have a location conflicting between the PR and the CIS. For these individuals, we generate the following covariates to be used in the model:
number of persons registering at the PR address in the years subsequent to their own registration
number of persons registering at the CIS address in the years subsequent to their own registration
number of persons who the individual shares the same surname with at the PR address
number of persons who the individual shares the same surname with at the CIS address
difference between the CIS address start date and the PR modification date
a flag indicating evidence of benefit 'activity'3 at the CIS address
This last covariate is obtained from benefits data supplied by DWP. These include: the National Benefits Database (NBD), Single Housing Benefit Extract (SHBE) and Tax Credits dataset. Figure 15 demonstrates that individuals are two to three times more likely to be resident at the CIS address where they receive a state benefit, depending on which benefits they receive. A source report on income and benefits data used for Research Outputs is available.
Figure 15: Comparison of CIS addresses linked to the 2011 Census, by benefit type
Notes:
- Data Source: Tax Credits data from HM Revenue & Customs and benefits data from Department for Work and Pensions (DWP).
- CIS – Department for Work and Pensions (DWP) Customer Information System.
Download this chart Figure 15: Comparison of CIS addresses linked to the 2011 Census, by benefit type
Image .csv .xlsThe covariates are generated for all of the records on the SPD that have an address conflict between the PR and the CIS. Those registered on the SPD within the sampled census postcodes are linked to census records to see if they match at the same address. A binary outcome is produced as the dependent variable in the logistic regression model; those that match at the address and those that do not.
The covariates listed above are then fitted to the model to predict likelihoods that the individual is registered at the PR or the CIS address. The regression coefficients generated by the model can then be applied to all of the SPD records that have address conflicts between the PR and CIS. The individual is assigned to the address scoring the highest probability. Figure 16 shows the modelling framework for combining sampled 2011 Census data with administrative data to determine most likely address.
Figure 16: Modelling framework for determining the most likely address, combining 2011 Census data with administrative data
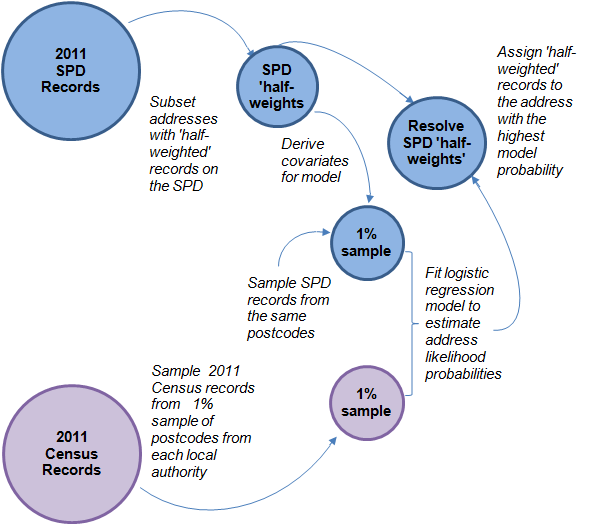
Source: Office for National Statistics
Notes:
- SPD – Statistical Population Dataset.
Download this image Figure 16: Modelling framework for determining the most likely address, combining 2011 Census data with administrative data
.png (58.2 kB)
While the same regression coefficients generated from 2011 Census data have also been used in 2015, our expectation is that we would refit models from coverage survey data that have been collected in the same year. Currently, simulated survey data from the 2011 Census is the only data available for this purpose. There may be some potential, however, in using data from our Labour Force Survey (LFS), which is collected quarterly from households.
Figure 17 shows how often the model is successful in assigning "half-weighted" records to the same address on the 2011 Census. Success has been measured by linking all modelled SPD records to the address they were resident at in the 2011 Census.
Figure 17: Performance of logistic regression model in assigning "half-weighted" records on SPD to the same address in 2011
Census, compared with assignment to PR or CIS address
Source: Office for National Statistics
Notes:
- SPD – Statistical Population Dataset.
- PR – NHS Patient Register.
- CIS – Department for Work and Pensions (DWP) Customer Information System.
Download this chart Figure 17: Performance of logistic regression model in assigning "half-weighted" records on SPD to the same address in 2011
Image .csv .xlsThe orange line on figure 17 shows what the accuracy of address assignment would be on the SPD if we resolved all "half-weight" cases by selecting the PR address. The red line shows the accuracy of address assignment using the CIS. While the selection of PR addresses would clearly outperform the CIS, the modelling approach determines addresses in agreement with the 2011 Census (the "truth") more often than either of these sources.
Overall, 85% of conflicting SPD records in 2011 were assigned to the same address as found on the 2011 Census. The blue line shows that there is some variation across age groups, with 15- to 19-year-olds being correctly assigned 75% of the time, compared with 90% for 55- to 59-year-olds.
A more detailed analysis of how this modelling approach has impacted SPD V2.0 population estimates is included in our analysis report.
Notes:
See footnote in section 5. Improvements to matching methodology for definition.
Output Areas (OAs) are the smallest geographic unit for which our census data are published. OAs typically containing at least 40 households and 100 persons, the target size being 125 households.
See footnote in section 5. Improvements to matching methodology for definition
7. Summary and future developments
This year we have focused our methodological development for Statistical Population Dataset (SPD) V2.0 on increasing the coverage of age-sex groups that were under represented on SPD V1.0. We have also developed methods to assign individuals to the most likely address on SPD V2.0.
The availability of some "activity" data from the Personal Demographic Service (PDS) and some Department for Work and Pensions (DWP) benefits data has enabled us develop the methodology for assigning records to the most likely address, but we require more access to additional data sources that confirm current addresses of individuals on the SPD. These data sources include additional primary and secondary healthcare datasets, education datasets, more complete and up to date information on income and benefits, as well as the potential for local data sources, for example council tax. In future years, we will aim to make use of these additional datasets (subject to access) and refine the methodology for resolving address conflicts on the SPD. In particular, we will consider whether we should integrate the rules-based approach used with PDS redistributions into the modelling approach that has been developed using logistic regression.
We will also begin targeting the use of "activity" data to remove individuals from the SPD if there is no evidence that they are still part of the usually resident population. Section 10 of our analysis report briefly summarises some of the initial analysis we have done by using the limited amount of income and benefits data we currently have access to for this purpose. While this research showed that the retention of 'active' records using this data resulted in considerably lower SPD estimates than the official population estimates, we will further consider how other indicators of "activity" could be used to retain individuals on the SPD who do not appear on both the NHS Patient Register (PR) and the Department for Work and Pensions (DWP) Customer Information System (CIS).
Crucial to the development of our population estimation methodology is the use of Population Coverage Survey (PCS) in adjusting for biases in SPD estimates. In this report, we have shown how a coverage survey might be used to model the redistribution of "half-weighted" records on the SPD. However in future we are seeking to develop the estimation framework that will adjust for under and over coverage on the SPD, at national and local level. We are planning to use 2011 Census data to simulate a PCS and test methods for adjusting SPD V2.0 for 2011, using two methods presented in the previous paper Beyond 2011: Producing Population estimates Using Administrative Data: In Theory; dual system estimation and weighting classes. This research is currently limited to producing estimates in 2011 (due to the availability of Census data in 2011) however we will consider whether our other surveys can be used to produce adjusted estimates in subsequent years, for example our Labour Force Survey.
We have started research into developing an alternative method for measuring quality of SPD population estimates that does not entirely rely on comparison with mid-year estimates. This will be increasingly important as we move towards the latter half of the intercensal period, and vital for the ongoing evaluation of population estimates delivered by an Administrative Data Census.
References
Fellegi, I.P., Sunter, A.B., 1969; A Theory for Record Linkage, Journal of the American Statistical Association, Vol. 64, No. 328
Herzog, T.N., Scheuren, F.J., Winkler, W.E., 2007, Data Quality and Record Linkage Techniques, Springer
An Assessment of the Quality of the Matching Between the 2011 Census and the Census Coverage Survey August 2013, 2011 Census Methods and Quality Report, Office for National Statistics, 2013
Notes:
- See footnote in section 5. Improvements to matching methodology for definition