In this section
- Disclaimer
- Main points
- Things you need to know about this release
- Our aim
- How do the 2016 estimates perform at a national (England and Wales) and country level?
- How do the 2016 estimates perform at the local authority level?
- Further developments and next steps
- Feedback
- Annex A – Feedback on the 2016 publication
1. Disclaimer
These Research Outputs are not official statistics on the population nor are they used in the underlying methods or assumptions in the production of official statistics. Rather they are published as outputs from research into a methodology different to that currently used in the production of population statistics. These outputs should not be used for policy- or decision-making. We welcome users providing feedback to us on their quality, value or the impact that using these figures would have if they were used in place of official statistics.
It is important that the information and research presented here is read alongside the outputs to aid interpretation and avoid misunderstanding. These outputs must not be reproduced without this disclaimer.
Throughout this publication, we compare the estimates produced from administrative data, with the official mid-year estimates (MYEs) to evaluate the accuracy of our figures. Please note that although the MYEs are official figures, the MYEs are still estimates produced each year by "rolling" the census estimates forward. Given the increasing uncertainty associated with the MYEs as we move away from the 2011 Census, we are looking at alternative ways to assess the quality of new estimates, these are outlined in Section 7.
Back to table of contents2. Main points
This year we've produced Statistical Population Dataset (SPD) V2.0 for 2016 to extend our time series.
We've published an interactive tool within this release to aid interpretation and allow you to explore how our methodology performs over time at a lower-level geography.
We've also produced SPD V2.0 estimates at Output Area (OA) level for the first time (see the Output Area geography guide for further information on OAs), these are available for 2011 and 2016.
Analysis of our OA estimates is available in a SlideShare.
A consistent feature seen in our SPDs for all years published is higher estimates for working age males aged between 30 and 54 years compared with MYEs (over 4.0% in 2016); a likely reason for this is those who are no longer usually resident still appearing in the administrative data following their departure from the country.
When comparing England and Wales, we observe similar percentage differences between SPD V2.0 and MYEs for all age groups, with the exception of those in the 20 to 24 age group, who are less likely to interact with administrative sources.
Over time, we have seen increasing differences between our SPDs and the MYEs, with a consecutive decline in the percentage of local authorities achieving the P1 quality standard; this is the maximum quality standard set out in the evaluation criteria of the Beyond 2011 programme (see Beyond 2011 Options Report 2 (PDF 491.75KB) for more information) and requires local authorities to be within plus or minus 3.8% of the MYE.
In 2016, out of all local authorities, 91.1% were within the quality standard, while 91.7% and 96.0% were within the quality standard in 2015 and 2011 respectively; a potential reason for this is the increased uncertainty associated with the MYEs as we move away from the 2011 Census (see the Section 1 for further information).
3. Things you need to know about this release
These Research Outputs on the population are not official statistics, rather they are published as outputs from the Administrative Data Census (ADC) Project. Our aim is to assess whether the government-stated ambition that "censuses after 2021 will be conducted using other sources of data"1 can be met.
Our methodology is based on anonymously linking person records on administrative datasets to construct a Statistical Population Dataset (SPD). This release adopts the same methodology used in last year's release to provide a time series. It also updates users on our progress towards establishing new methodologies for producing population estimates. For information about our current and previous methodologies, please see SPD V1.0 and SPD V2.0 methodology reports. This year, for the first time, we have produced our SPD V2.0 estimates at Output Area (OA) level for 2016 and 2011 to give users the flexibility to aggregate the data how they choose.
Our SPD V1.0 and V2.0 estimates are available for download with additional information in our previous releases. Including the estimates reported in this publication, we have now produced:
SPD V1.0 estimates at various levels: national (England and Wales), country, local authority (LA), Middle Layer Super Output Area (MSOA), and Lower Layer Super Output Area (LSOA) for 2016, 2015 and 2011; 2014 and 2013 estimates are available at LA level only
SPD V2.0 estimates at various levels: national (England and Wales), country, local authority (LA), Middle Layer Super Output Area (MSOA), and Lower Layer Super Output Area (LSOA) for 2016, 2015 and 2011; and Output Area (OA) level for 2016 and 20112
In the geographies below local authority level, some cell counts and records have been perturbed or shuffled to protect the confidentiality of individuals within the data.
We welcome feedback and any questions you have by email to Admin.Data.Census.Project@ons.gov.uk. Don't forget to include the title of the output in your response.
Notes for: Things you need to know about this release
Government's response to the National Statistician's recommendation
Not all data sources were available for supply to Office for National Statistics (ONS) for 2012 over the reference period so SPD estimates for this year were permanently omitted.
4. Our aim
The Administrative Data Census (ADC) Project is working to assess whether the government-stated ambition that "censuses after 2021 will be conducted using other sources of data"1 can be met. The work being undertaken by ADC is to produce estimates of the population and on the number of occupied addresses ("households"), as well as population, housing and household characteristics. This will be achieved using a combination of administrative data and surveys to meet demands for improved population statistics and as a possible alternative to the census.
We are aiming to have an ADC-based approach to producing population statistics using a combination of administrative data and a population coverage survey in place in the year 2020 to demonstrate the ability to produce:
annual estimates of the size of the usual resident population by age and sex for national (England and Wales), local and small areas
components of population change (births, deaths and migration)
These estimates provide a base for further outputs about the population including population projections. See Section 7 for more information on how we plan to take this work forward.
In last year's publication we introduced a new methodology -- Statistical Population Dataset (SPD) V2.0, which improved the accuracy of our population estimates at national, country and local authority (LA) level. We also produced estimates down to Lower Layer Super Output Area (LSOA) level.
In this publication we have used the same SPD V2.0 methodology to produce estimates for 2016 to extend this time series. Analysis of the 2016 estimates can be found in Section 5 and Section 6. We have also published estimates at Output Area (OA) level for the first time, for 2016 and 2011. Analysis of the OA estimates can be found in the SlideShare.
This year we have acquired additional Personal Demographic Service (PDS) data for 2014 to 2016, where previously we only had data up to the year 2014. These data are used to help resolve the location of individuals who had conflicting locations recorded in the administrative data. This year we have been able to resolve a greater proportion of these individuals using the PDS because of the more up-to-date PDS data. For additional information, please see the updated Data Source Overview: Personal Demographic System and SPD V2.0 methodology.
The coverage of the Benefits and Income Dataset (BIDs) used within the logistic regression model in the redistribution of half-weights has also improved and now includes Child Benefit, Universal Credit and Personal Independence Payment data. Please see the Data Source Overview: Income and Benefits for further information.
Throughout this publication, we compare the estimates produced with the official mid-year estimates (MYEs) to evaluate the accuracy of our figures. Please see our Section 1 for details on the uncertainties associated with the MYEs and Section 7 for how we hope to evaluate our new estimates in the future.
Notes for: Our aim
Back to table of contents5. How do the 2016 estimates perform at a national (England and Wales) and country level?
For England and Wales, our Statistical Population Dataset V2.0 estimate reports an estimate that is 0.66% higher than the official mid-year estimates (MYE).
The performance of SPD V2.0 2016 follows similar patterns to the [previous year’s SPD][1] when compared with the MYE. As Figure 1 shows, the percentage difference by five-year age groups between the MYE and SPD V2.0 is most prevalent for males of working age where our SPD is higher. This is most apparent between the ages of 30 and 54 years, where each five-year age group has a percentage difference of over 4.0%. A likely reason may be people who are no longer resident in England and Wales still appearing on administrative sources. For example, they may not inform the Department for Work and Pensions (DWP) or HM Revenue and Customs (HMRC) of their departure from the country.
Another area of interest is the age group of 20 to 24 years where the SPD V2.0 is 2.9% lower for males but 3.1% higher for females when compared with the MYE. A possible cause of the difference for the male population may be a lack of interaction with different administrative sources. For example, males may be less likely than females to access NHS services. In the case of male immigrants, this may mean they are less likely to register with a GP (and less likely to appear on the NHS Patient Register). The difference in the female population may be caused by the difficulty in removing people from administrative data sources who have since emigrated.
For those aged 70 and over, the SPD V2.0 is consistently lower than the MYE for both males and females. The age group 90 and over shows the greatest difference, 6.9% lower for males and 4.6% lower for females when compared with the MYE (Figure 1). This discrepancy between the SPD V2.0 and the MYE has a number of possible causes. The process of creating the MYE involves “rolling” the census estimates forward, allowing for ageing, births, deaths and migration (the cohort component method). Therefore an over estimation of the elderly population in the 2011 Census or an under estimation of net international migration for this age group may have caused this difference1.
Another possible reason for this difference is error with the SPD V2.0 estimates caused by issues with matching records with missing or incorrect information on administrative sources. Furthermore, when people move into residential or nursing care homes this may not be reflected on the administrative data.
Figure 1: Comparison of Statistical Population Dataset V2.0 with the official mid-year estimates by five-year age group and sex, England and Wales, 2016
Source: Office for National Statistics
Notes:
- SPD - Statistical Population Dataset.
Download this chart Figure 1: Comparison of Statistical Population Dataset V2.0 with the official mid-year estimates by five-year age group and sex, England and Wales, 2016
Image .csv .xlsNational sex ratio (England and Wales)
Figure 2 shows the sex ratio, the number of males per 100 females in the population, for the MYE and SPD for single year of age in 2016. The sex ratio is similar for the SPD V2.0 and MYE for ages 0 to 15 years and for ages 69 to 90 and over. This reflects that SPD V2.0 estimates are lower than the MYE to a similar extent for both males and females in these ages, so the ratio of males to females is not affected.
For ages 15 to 30 years, the sex ratio differs, with the MYE measuring a higher sex ratio than the SPD V2.0. Specifically, the SPD V2.0 has a sex ratio of 100 and below for ages 20 to 30 years, while the MYE does not. This reflects the findings highlighted in the national comparison (Figure 1) that, when compared with the MYE, the SPD V2.0 estimate is:
lower for females to a lesser extent than males for the 15 to 19 age group
lower for males and higher for females for the 20 to 24 age group
higher for females to a larger extent than males for the 25 to 29 age group
SPD V2.0 has a higher sex ratio than the MYE for ages 31 to 68 years. In particular, for ages 33 to 60 years, the SPD V2.0 and the MYE show conflicting sex ratios, with SPD V2.0 recording a sex ratio above 100 and the MYE recording a sex ratio below 100. This difference reflects the higher numbers of males estimated by the SPD V2.0 in this age group compared with the MYE, while the estimated number of females remains broadly similar between the two estimates (Figure 1).
Figure 2: Statistical Population Dataset V2.0 sex ratio against the official mid-year estimates, England and Wales, 2016
Source: Office for National Statistics
Notes:
- The sex ratio is the number of males per 100 females in the population.
- SPD - Statistical Population Dataset.
Download this chart Figure 2: Statistical Population Dataset V2.0 sex ratio against the official mid-year estimates, England and Wales, 2016
Image .csv .xlsPerformance by country
England
Figure 3 compares SPD V2.0 with the MYE for England. Similar patterns are observed when comparing the SPD V2.0 estimates and MYEs at a national (England and Wales) level (Figure 1), and for England.
Wales
Figure 4 shows the comparison of SPD V2.0 with the MYE for Wales. A similar pattern is seen to that of the national England and Wales comparison (Figure 1) for all five-year age groups apart from the age group 20 to 24. For males in this age group, the SPD V2.0 is 5.9% lower than the MYEs, compared with 2.9% lower at the national level. For females in this age group, the SPD V2.0 is 2.3% lower than the MYEs, compared with 3.1% higher at the national level. This difference may be caused by a lag in the administrative data picking up migration of students across the England and Wales border.
The 20 to 24 age group in the 2016 SPD V2.0 and MYE should capture the same population as the 15 to 19 age group in the 2011 SPD V2.0 and MYE. There has been an increase in the MYE to a greater extent than in the SPD V2.0 for this population in Wales, with the MYE recording 6,456 more males and 2,342 more females than the SPD for the 20- to 24-year-olds in 2016.
The age group 25 to 29 has a SPD V2.0 estimate 0.7% higher for men and 4.0% higher for women at national level, while it is 1.3% lower for males and 0.4% lower for females for Wales. For ages 30 to 54 years, the SPD V2.0 estimate is higher than the MYE at the national level and in Wales. However, this higher estimate is more extreme for Wales compared to the national level. The largest difference between Wales and the national comparison concerns the 40 to 44 age group, where the SPD V2.0 estimates 7.4% more males than in the MYE in Wales and 5.7% more males at the national level.
The performance of the SPD V2.0 is better for Wales compared with the national level for ages 90 and over.
We cannot be certain about what is driving these differences between the national and Wales estimates. As Wales has a smaller population than England it is possible that any difference in the population or issues in the data may lead to exaggerated differences between the countries.
Figure 3: Comparison of Statistical Population Dataset V2.0 with the official mid-year estimates by five year age group and sex, England, 2016
Notes:
- SPD - Statistical Population Dataset.
Download this chart Figure 3: Comparison of Statistical Population Dataset V2.0 with the official mid-year estimates by five year age group and sex, England, 2016
Image .csv .xlsFigure 4: Comparison of Statistical Population Dataset V2.0 with the official mid-year estimates by five year age group and sex, Wales, 2016
Source: Office for National Statistics
Notes:
- SPD - Statistical Population Dataset.
Download this chart Figure 4: Comparison of Statistical Population Dataset V2.0 with the official mid-year estimates by five year age group and sex, Wales, 2016
Image .csv .xlsNotes for: How do the 2016 estimates perform at a national (England and Wales) and country level?
Back to table of contents6. How do the 2016 estimates perform at the local authority level?
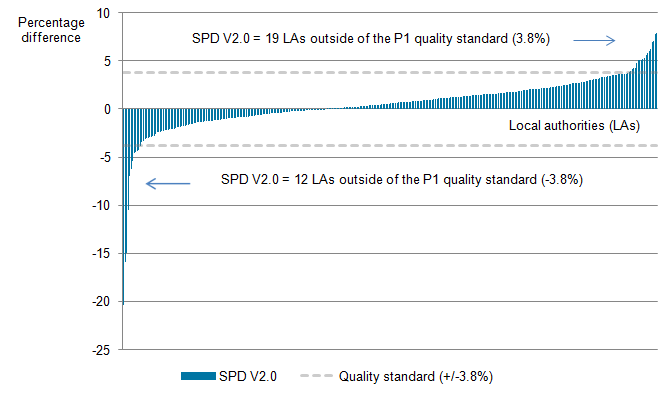
The P1 quality standard requires that 97% of local authorities have a total population estimate within plus or minus 3.8% of the 2011 Census estimate. This performance measure has been used in our previous population Research Outputs to compare our Statistical Population Dataset (SPD) estimates with the official mid-year estimates (MYEs).
In 2016, out of all local authorities, 91.1% had an SPD Version 2.0 (V2.0) estimate within 3.8% of the MYE (Figure 5). This follows a consecutive decline in the percentage of local authorities achieving the P1 quality standard, with 91.7% within the quality standard in 2015 and 96% within the quality standard in 2011. As highlighted in previous releases, this steady decline is not necessarily indicative of coverage problems in our SPD. Instead, it could be the product of the potential inaccuracies in our current official mid-year population estimates system (PDF 1.53MB). For further information on the performance of our SPD estimates in previous years, please see our 2015 and 2016 Population Research Outputs.
Figure 5: Local authority distribution of difference between the Statistical Population Dataset V2.0 estimates and the official mid-year estimates, England and Wales, 2016
Source: Office for National Statistics
Notes:
- The P1 quality standard is the maximum quality standard set out in the evaluation criteria of the Beyond 2011 programme. This is equivalent to the maximum quality achieved in the current system (that is, what is achieved in a census year) every year (see Beyond 2011 Options Report 2 for more information).
- At the local authority level, the P1 quality standard is to be within plus or minus 3.8% of the 2016 official mid-year estimate.
- SPD – Statistical Population Dataset.
Download this image Figure 5: Local authority distribution of difference between the Statistical Population Dataset V2.0 estimates and the official mid-year estimates, England and Wales, 2016
.png (13.2 kB) .xls (58.9 kB)
Over time, when comparing the SPD V2.0 estimates with our P1 quality standard, the number of local authorities that are more than 3.8% higher than the MYEs has increased, with three local authorities in 2011, 18 in 2015 and 19 in 2016 (Table 1).
The local authorities that had estimates higher than 3.8% in 2015 were the same in 2016, with the addition of Ipswich. The poorer performance for Ipswich in 2016 was due to an increased difference between the SPD V2.0 estimate and the MYE for males (from 3.4% higher in 2015 to 4.7% higher in 2016).
Migration is likely to have caused some local authorities (LAs) to report a difference from the MYE being higher than the P1 quality standard (Table 1). For instance, Peterborough has experienced high levels of international migration, so it could be the case that either our SPD included those that have emigrated or that the MYEs underestimated the levels of international migration in this area (see our 2015 release for further information). Moreover, Ealing and Brent are London boroughs where measuring population change is always more difficult due to the high levels of migration (both internal and international) in and out of the area.
| Local authority | 2011 | 2015 | 2016 |
|---|---|---|---|
| Peterborough | 7.1% | 7.9% | |
| Ealing | 7.2% | 7.8% | |
| Blackpool | 5.8% | 6.9% | 7.0% |
| Reading | 6.2% | 7.0% | |
| Knowsley | 6.4% | 6.5% | 6.3% |
| Merton | 5.0% | 6.0% | |
| Brent | 6.7% | 5.8% | |
| Harlow | 5.2% | 5.6% | |
| Northampton | 4.7% | 5.2% | |
| Blackburn with Darwen | 4.6% | 5.2% | |
| Wellingsborough | 4.6% | 5.1% | |
| Middlesbrough | 4.9% | 5.1% | |
| Hounslow | 5.5% | 5.0% | |
| Burnley | 4.3% | 4.8% | |
| Boston | 4.8% | 4.3% | |
| Tameside | 4.1% | 4.2% | |
| Bolton | 3.9% | 4.2% | |
| Leeds | 3.9% | 3.9% | |
| Ipswich | 3.8% | ||
| City of London | 5.6% |
Download this table Table 1: Local authorities with higher SPD V2.0 estimates when compared with the official mid-year estimate and are outside the P1 quality standard for the years: 2011, 2015 and 2016 England and Wales
.xls .csvThe P1 quality standard is the maximum quality standard set out in the evaluation criteria of the Beyond 2011 programme. This is equivalent to the maximum quality achieved in the current system (that is, what is achieved in a census year) every year (see Beyond 2011 Options Report 2 for more information).
The number of LAs that are more than 3.8% lower than the MYEs has remained relatively constant, with 11 local authorities in 2011, 11 in 2015 and 12 in 2016 (Table 2).
Looking at the top 10 LAs with the highest negative percentage difference from the MYEs for SPD V2.0, several London boroughs (Westminster, Kensington and Chelsea, City of London, Camden, Tower Hamlets and Islington) made the top 10 both in 2015 and 2016 (Table 2). As mentioned for Table 1, measuring population change in London LAs through administrative data is more complex due to the constant migration in and out of these areas. The occurrence of migration can result in an omission of records within the administrative data due to delays in international migrants registering for services. Alternatively, for internal migrants there could be a delay in notification of address changes meaning that internal migrants are wrongly assumed to be present within their previous LA.
Looking at those LAs that did not achieve the P1 quality standard in 2015 but did in 2016, Rutland now falls within the P1 quality standard. The SPD V2.0 estimate for Rutland was 3.8% lower than the MYE in 2015, whereas in 2016 the SPD V2.0 estimate was 3.5% lower. This change has been generated by an improvement in our SPD V2.0 2016 female estimate, which is now 1.8% lower than the MYE, while it was 2.5% lower in 2015 (whereas the percentage difference of the male population has remained the same at 5.1% lower from the MYE).
In contrast, for Kingston upon Thames and Exeter, the SPD V2.0 estimates fell outside the P1 quality standard in 2016. The SPD V2.0 population estimates for Kingston upon Thames passed from 3.7% lower than the MYE in 2015 to 4.4% lower in 2016. This deterioration has been caused by increased differences between the SPD V2.0 estimates and the MYE across a number of age groups in 2016 compared with 2015, together with the male estimate moving further away from the MYE by 0.9%. Similarly, Exeter’s estimate was the result of our SPD V2.0 estimate for the male population, which was 5.7% lower than the MYE for 2016. SPD V2.0 suggests an increase of 1.4% in the male population between 2015 and 2016, while the MYE suggests an increase of 2.5%.
It would be reasonable to assume that this lower estimate within our SPD V2.0 has been caused by GP Patient Register list cleaning activities that have occurred in South West England. This is believed to have affected the following local authorities: Cheltenham, Gloucester, Stroud, Forest of Dean, Tewkesbury, Exeter, Wiltshire, Swindon and Bath. This highlights some of the challenges underpinning our SPD V2.0 methodology and the quality issues associated with the use of administrative data.
| Local authority | 2011 | 2015 | 2016 |
|---|---|---|---|
| Westminster | -15.2% | -17.7% | -20.4% |
| Kensington and Chelsea | -21.0% | -14.4% | -15.9% |
| City of London | -10.4% | -15.0% | |
| Camden | -5.5% | -10.2% | -10.5% |
| Tower Hamlets | -7.1% | -7.0% | |
| Forest Heath | -7.3% | -6.6% | -6.3% |
| Islington | -5.8% | -5.4% | |
| Gwynedd | -3.9% | -4.6% | |
| Isles of Scilly | -4.7% | -4.5% | |
| Kingston upon Thames | -4.4% | ||
| Tunbridge Wells | -5.6% | -4.8% | -4.2% |
| Exeter | -3.9% | ||
| Barnet | -4.5% | ||
| Brent | -5.6% | ||
| Hammersmith and Fulham | -5.3% | ||
| Haringey | -8.0% | ||
| Harrow | -6.2% | ||
| Rutland | -4.8% | -3.8% |
Download this table Table 2: Local authorities with lower Statistical Population Dataset V2.0 estimates when compared with the official mid-year estimate and are outside the P1 quality standard for the years: 2011, 2015 and 2016 England and Wales
.xls .csvThe P1 quality standard is the maximum quality standard set out in the evaluation criteria of the Beyond 2011 programme. This is equivalent to the maximum quality achieved in the current system (that is, what is achieved in a census year) every year (see Beyond 2011 Options Report 2 for more information).
Performance for male and female populations at local authority level
Achieving an SPD V2.0 estimate within the P1 quality standard is more difficult to attain for the male population where there has been a reduction of 27 local authorities achieving the P1 quality standard from 2011 to 2016 (Table 3). In comparison, for the female population there are six fewer local authorities falling within the P1 quality standard of plus or minus 3.8% between these years.
As highlighted in previous releases, this significant disparity between the female and male population is likely to be the result of males having less interaction with public services, leading to their administrative data being less up-to-date. For example, there is a general tendency to overestimate working age males due to the accumulation of records for those who are temporarily resident, such as short-term migrants who have not deregistered with their GP and/or failed to notify Department for Work and Pensions (DWP) or HM Revenue and Customs (HMRC) of their departure from the country.
The P1 quality standard is the maximum quality standard set out in the evaluation criteria of the Beyond 2011 programme. This is equivalent to the maximum quality achieved in the current system (that is, what is achieved in a census year) every year (see Beyond 2011 Options Report 2 for more information).
Figure 6 illustrates which local authorities (LAs) have the largest percentage difference from the MYEs for males and females in 2016.
Local authorities with SPD V2.0 estimates lower than the official mid-year estimates
Males
When comparing the percentage difference between the two estimates, the LAs where the SPD estimate for males is over 13% lower than the MYE are Camden, Westminster, Kensington and Chelsea and the City of London (Figure 6). The LAs falling within the category below this (greater than 8.5% lower or less than or equal to 13% lower) are Tower Hamlets and Islington, with a difference of negative 9.1% and negative 8.9% for males respectively. As explained previously, we would expect our SPD estimates to be less consistent with the MYEs in London LAs due to the persistent migration in and out of these areas. The lower estimates are likely to be caused by, for example, lags in registration with administrative sources.
Females
With the exception of Camden, the LAs over 13% lower than the MYEs for the female population are the same for the male population in SPD V2.0 2016 (Figure 6). Forest Heath, a local authority with a high proportion of foreign armed forces personnel, falls within the group below this with a difference of negative 10.6%. We would expect this LA to produce estimates lower than the MYEs for the female population.This is because foreign armed forces personnel dependents (children and spouses) are not included in the aggregate statistics added to the SPD and, unlike the dependents of UK armed forces personnel, may not be picked up in administrative sources such as the Patient Register (PR) as they often use defence medical services.
Local authorities with SPD V2.0 estimates higher than the official mid-year estimates
For males and females, there are no LAs where the SPD estimates are more than 13% higher than the MYEs (Figure 6). Moreover, for the female population there are no LAs that are over 8.5% higher than the MYEs.
Males
Blackpool and Ealing were the only areas where the SPD V2.0 estimates fell within the greater than 8.5% or less than or equal to 13% higher category for males (Figure 6). These higher estimates are likely to be caused by internal and international migrants failing to update their information on administrative sources when moving out of an area. This is most noticeable on the Patient Register (PR) where the resident may be less likely to inform their GP that they are moving out of the area. Knowsley’s SPD V2.0 estimate also fell within the greater than 8.5% or less than or equal to 13% higher category for males with a difference of 9.7%.
Figure 6: Performance of Statistical Population Dataset V2.0 estimates against the official mid-year estimates, females and males, 2016

Source: Office for National Statistics
Notes:
- SPD - Statistical Population Dataset.
- To view a larger version of Figure 6, please download the png.
Download this image Figure 6: Performance of Statistical Population Dataset V2.0 estimates against the official mid-year estimates, females and males, 2016
.png (133.5 kB) .xls (102.4 kB)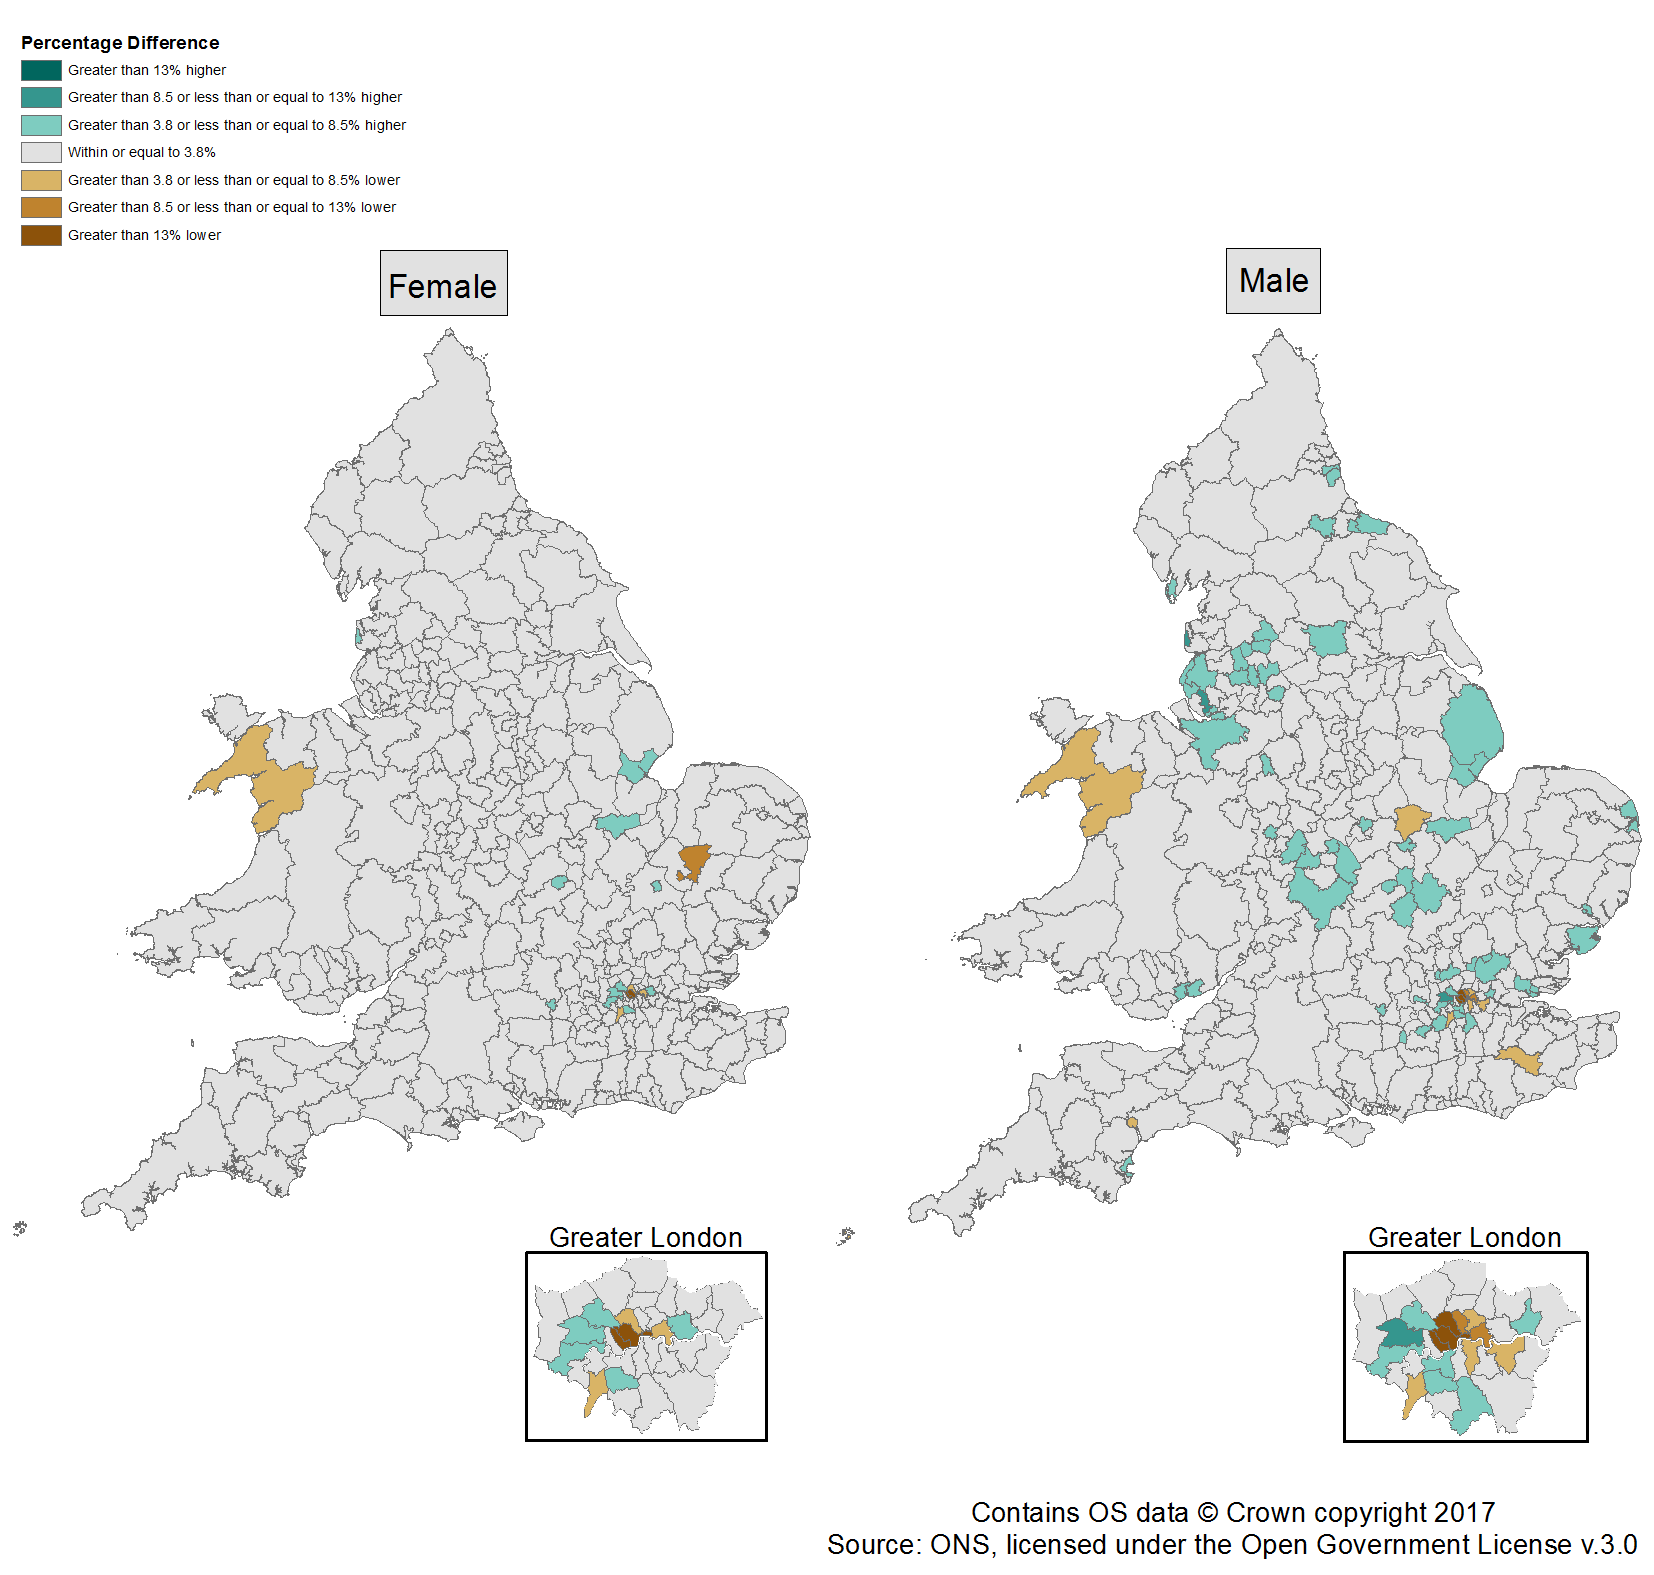
Our analysis shows that two local authorities, Newcastle-under-Lyme and Neath Port Talbot, were different when comparing SPD V2.0 2016 estimates against SPD V2.0 2015 estimates. In Newcastle-under-Lyme we have seen an increase in the numbers of people aged 19 to 21 years, with a population increase of 35.1% between SPD V2.0 2015 and 2016. A factor behind this could be the expansion of Keele University1.
In Neath Port Talbot we also observe a spike in the numbers of males aged 19 years, an increase of 36.5%. Upon further investigation we believe this increase has been caused by the expansion of Swansea University, with the opening of the Swansea University Bay Campus, which focuses on Science, Technology, Engineering and Mathematics (STEM) subjects and includes new student accommodation blocks.
In 2016, there are a large number of first-year students at Leicester University recorded with their Higher Education Statistics Agency (HESA) term-time postcode outside of Leicester or the Oadby student village (over 1,000). The location for these HESA records appears to be inconsistent with other administrative data sources and is different to the pattern seen in previous year’s data. As SPD V2.0 uses the HESA term-time location to estimate student populations in preference to other data sources, this anomaly causes the SPD V2.0 population estimate to be lower for Oadby than would normally be expected and different to the official mid-year population estimate. We will be reviewing our address rules as part of our “activity” research (see Section 7 for more information).
These population pyramids compare Statistical Population Dataset V2.0 estimates with official mid-year estimates for 2011 and 2016, by single year of age and sex at local authority level.
Embed code
This year we have also produced a Lower Layer Super Output Area (LSOA) interactive map to aid interpretation.
Performance of Statistical Population Dataset V2.0 estimates against official mid-year estimates, Lower Layer Super Output Area, 2016
Embed code
Notes for: How do the 2016 estimates perform at the local authority level?
For more information, please see Keele University Strategic Plan 2015 to 2020.
Please use this postcode lookup to find LSOAs of interest: Postcode to Output Area to Lower Layer Super Output Area to Middle Layer Super Output Area to Local Authority/District (December 2011) Lookup in England and Wales.
7. Further developments and next steps
Update on estimation and the Population Coverage Survey
Given that a Statistical Population Dataset (SPD) is likely to contain some underestimation and overestimation of the “true” population, over the next three years we will be testing the development of a Population Coverage Survey (PCS) and an accompanying estimation framework to evaluate the quality of the SPD and to adjust for coverage errors.
The methodology we are testing is similar to the estimation framework used for the 2001 and 2011 censuses, as outlined in the Estimating population in theory paper (PDF, 2.06MB). We are testing using dual system estimation (DSE) and weighting class estimation (WCE). The research conducted is based on a simulation using SPD V2.0 for 2011 and constructing a PCS as a sample taken from 2011 Census data. Running this simulation on 2011 data allows the results to be compared with final 2011 Census estimates as a measure of quality.
SPD V2.0 constructed from 2011 administrative data produces population estimates close to the census at an aggregate level. See the Research Outputs estimating the size of the population in England and Wales 2016 release for more information. However, there are observed differences, with lower estimates for females and higher estimates for males than the official estimates. Below local authority (LA) level a larger bias is observed in comparison to the 2011 Census estimates.
We will publish a detailed research paper in spring 2018 to report the results of this work. Initial findings show that a WCE approach produces estimates that are closer to the official estimates, than a DSE approach. However, neither method has so far shown an improvement over the direct SPD V2.0 population estimates that we have published.
A DSE approach adjusts for under coverage. Applying this approach to SPD V2.0 gave disappointing results due to:
the difficulty in removing erroneous records from the SPD (administrative data records relating to people who are not part of the usually resident population)
missed matches between the SPD and the PCS as the DSE approach assumes that there is zero matching error
Both of these effects result in a positive bias (an over adjustment) to the population estimate.
A WCE approach adjusts for non-response by constructing “classes” of people or households that are expected to have a common propensity for not responding to a survey. The propensities are calculated by using links between households on the SPD and the PCS, identifying the survey responding and survey non-responding households. The SPD contains information on the people in households that did not respond to the survey.
A weighting class approach is less susceptible to SPD over coverage and doesn’t require record level matching between datasets. Weighting class suffers from bias when there is:
address matching error or missingness in the address-frame
within-household non-response on the PCS
This approach leads to lower population estimates compared with the 2011 Census. The WCE underestimate bias is of smaller magnitude than the overestimate produced by the DSE adjustment. Further research will be undertaken to understand the main causes of these differences.
We have also started to test our PCS approach by running a small field test to provide evidence about whether we can achieve the required response rates for the surveys. We also plan to implement a comprehensive testing strategy to explore appropriate sampling and data collection methods, and to continue our work to develop estimation methodologies. Our aim is to have a PCS in place by the year 2020 ready to produce estimates the following year.
Update on methodology to independently evaluate the quality of SPD estimates
We have been working on a framework for evaluating the quality of SPD estimates, which is independent from making a comparison with official mid-year estimates (MYEs). This is becoming increasingly important as we move towards the end of the decade and the differences between the SPD and official mid-year estimates become higher and more difficult to interpret, given the methodological differences and uncertainty in the quality comparisons.
We are developing measures of statistical uncertainty around the new administrative and survey-based population estimates. These build upon the methods developed to measure uncertainty for official mid-year population estimates (MYEs). Uncertainty measures around the MYEs and further analysis will be published in 2018.
We are taking a simulations-based approach, using statistical benchmarking against the 2011 Census, to derive confidence intervals for SPD estimates by single year of age, sex and local authority.
Our evaluation of the measures will include a comparison between the uncertainty measures for the MYEs and the SPDs for 2016, which is of interest as this is the mid-point between censuses.
An alternative approach to producing population estimates
We are currently investigating the potential for a flows-based approach for producing population estimates to derive components of population change (births, deaths and migration flows). This approach is different to the current SPD method in that it attempts to use the components of population change (flows) to continuously update the usually resident population rather than producing an independent stock estimate of the population each year.
The flows-based approach may offer improvements in the quality of the population estimates such as more flexibility in the timeliness and frequency of population outputs. This would help users make more effective decisions on service provision and allocation of funds. An additional benefit would be to maintain the quality of the estimates throughout the intercensal period rather than the decline that is seen between censuses in the current system.
A main requisite for this approach is the availability of good quality indicators of activity in the administrative data sources, particularly for movers both to and from the UK and within the UK. The use of “activity” data in SPD development has so far been restricted to determining the most likely address of individuals with conflicting address information on the SPD. “Activity” can be defined as an individual interacting with an administrative system, for example, for National Insurance or tax purposes, when claiming a benefit, attending hospital or updating information on government systems in some other way.
In future years we will seek to use “activity” data to help remove individuals from the SPD if there is no evidence they are still part of the usually resident population, or to include individuals who are resident but not registered on multiple administrative sources. We are also exploring other data sources that can help us identify different types of international migrants including long-term migrants who are usually resident in the UK. We are interested to learn more about how migrants interact with public services and what combining these data sources can tell us about their use of education and health services and their impact on the economy. We hope to publish an update on this alternative approach next year.
Update on other data sources
The Digital Economy Act 2017 gives the UK Statistics Authority a statutory right of access to information held by government departments, other public bodies, charities, and large and medium-sized businesses, for statistics and research purposes. This will help ensure we have access to the data we need to produce fit-for-purpose official statistics that meet the challenges of a modern administration and the evolving needs of statistical users.
Council Tax is being considered as a potential administrative source to indicate the extent of population churn and activity at an address. Data on individuals could provide evidence on their location, which would be used to improve population research outputs.
We now have access to Council Tax data from two local authorities – Oldham and Westminster. We are working to understand this data and how it could be used to make improvements to our population estimates. So far we have cleaned the data, removing duplicates and records missing a Unique Property Reference Number (UPRN), and then linked the data to the SPD V2.0, Patient Register (PR) and Customer Information System (CIS).
Of the 97,200 records for Westminster, 63% linked to SPD V2.0 and a further 18.5% linked to the PR and/or the CIS. Of the 94,337 records from Oldham, 93% linked to SPD V2.0 and a further 5.6% linked to the PR and/or CIS. Our current research is focused on assessing the records that did not link to see whether we can pick these records up from other data sources – such as the Benefit and Income dataset, and refine our SPD rules as a result.
We also have access to an extract from the wider Personal Demographic Service (PDS) system where previously we only had the PDS data – movers’ extract 001. We are investigating how this data could be used to inform the SPD rules such as using the “reason for removal” variable. This variable indicates that a patient is no longer registered with the NHS and provides a reason, for example, when a patient has left the country or death. We continue to seek access to a range of additional data sources. For a more comprehensive update on acquisition of data, please see Annex B of the Annual Assessment.
Back to table of contents8. Feedback
We are keen to get feedback on these Research Outputs, particularly on any observations you have regarding the coverage of Statistical Population Dataset estimates at lower-level geographies including Output Area. Please email your feedback to Admin.Data.Census.Project@ons.gov.uk. Don’t forget to include the title of the output in your response.
Back to table of contents9. Annex A – Feedback on the 2016 publication
Feedback on last year's estimating the size of the population release was received via an online survey as well as a series of engagement events held with representatives from a variety of local authorities.
The information in this section summarises the feedback received.
| Feedback | Response |
|---|---|
| Many respondents described the importance of having access to the correct geographic level of data. For the majority of users Output Area (OA) level data,which reflects current boundaries, was preferred. Having access to data at lower geographical levels would give the user the flexibility of being able to aggregate the data how they choose. | For the latest set of administrative data based Population Research Outputs we have used Statistical Population Dataset (SPD) V2.0 to produce population estimates down to Output Area level. These estimates are available for 2011 and 2016. As there is still a need for higher geographies we have continued to publish these, but now we have started to publish the OA level data this will allow users to carry out research at a much lower level of granularity. |
Download this table Table 4: What level of geography do you require the data to be available at?
.xls .csv
| Feedback | Response |
|---|---|
| The majority of respondents were satisfied that the information provided was sufficient to understand the methods and analysis used. While a few described the explanatory paragraphs as requiring significant investment to understand, they appreciated the need for these, and described them as ultimately helping to explain the output in a clear, easily understandable way. | Receiving frequent feedback allows us to continuously review our approach for the dissemination of Research Outputs. This means reviewing the content and level of explanatory information provided in our publications to ensure users are able to understand and easily navigate the publication. Often technical sections are essential in aiding comprehension of methods and some of the limitations of the research, as well as providing the necessary detail to our diverse range of users. We continuously strive to keep these as accessible and informative as possible without losing the essential information. |
Download this table Table 5: Was the level of information presented in the report sufficient for you to understand the methods and analysis used?
.xls .csv
| Feedback | Response |
|---|---|
| The majority of respondents described the SlideShare format as being useful in understanding why there are potential differences between the SPD estimates and the official population estimates at lower geographical areas. The interactive population pyramid tool was very helpful for users, and convenient for comparing the Research Outputs and the official population estimates. | Following positive feedback we have used the SlideShare format in this latest release to highlight our research and findings at OA level. Where suitable we will continue to use this format in the future. We have replicated the interactive tool for the latest set of outputs and made some changes to make the experience friendlier for the user. |
Download this table Table 6: Are there any improvements that could be made to increase the utility of the data?
.xls .csv
| Feedback | Response |
|---|---|
| Various administrative data sources were suggested as potential additions to improve the current methodology for producing population and household estimates. Some of the most common are listed below: • Driver and Vehicle Licensing Agency • Electoral roll registrations • Earlier years census data • Social housing registers • Licensed Houses of Multiple Occupancy lists • Housing completion survey (records new build properties by local authority) | Access to data sources remains one of our key challenges. We regularly review our priorities for the datasets we want to pursue and use. Annex B of the latest Annual Assessment provides an update on the data that we have obtained access to, and the data that we are focusing on next. Priority data sets we are currently focusing on include; health data including the Patient Demographic Service (PDS), Hospital Episode Statistics (HES) and Council Tax information. The Digital Economy Bill received Royal Assent in April 2017. The Digital Economy Act 2017 gives the UK Statistics Authority a statutory right of access to information held by government departments, other public bodies, charities, and large/medium-sized businesses, for statistics and research purposes. This will help ensure we have access to the data we need to produce fit-for-purpose official statistics that meet the challenges of a modern administration and the evolving needs of statistical users. Having recently acquired some Council Tax data from two local authorities we have begun research on how these data can be used to enhance our methodology. Specifically we are looking to use Council Tax data in identifying and removing records from the SPD which relate to individuals that are no longer usually resident in the population (see Section 7). |
Download this table Table 7: Are there any additional data sources which could be used, which would improve the quality of administrative based estimates?
.xls .csv
| Feedback | Response |
|---|---|
| A number of possible factors were suggested by respondents to explain the differences between the administrative data based estimates and the official estimates for their particular area, some of the most common included: • the omission of special populations, for example those attending private school, in prison or the prevalence of armed forces • high proportions of rental properties, especially flats where residents are likely to reside for short periods of time • areas with a large number of new housing developments, for example Newham • areas with high proportions of second home ownership, students or international migration Being able to explore the data at OA level would benefit users in understanding differences as they are more likely to relate to a single factor. | We are continuing to investigate how additional “activity” data can be used to improve the coverage of the administrative data population estimates. However, we see the real benefit in adjusting these coverage errors by way of a Population Coverage Survey (PCS). The current plan is to produce coverage adjusted SPD population estimates in combination with a PCS. We are currently running a PCS test and more information can be found in Section 7 of this report. We acknowledge that local intelligence to supplement existing data sources is also vital in our research and development of the SPD estimates. We will continue to encourage feedback from user at local level especially in areas of high churn and those populated by dynamic population groups for example, young professionals and economic migrants. |
Download this table Table 8: Do you have any possible explanations for the difference between the Research Outputs and the official estimates?
.xls .csvRelated downloads
- Research Outputs - SPD V2.0 population estimates (31.7 MB zip)
- Research Outputs - SPD V2.0 population estimates (Census Output Areas 2016) (23.0 MB zip)
- Research Outputs - SPD V2.0 population estimates (Census Output Areas 2011) (22.8 MB zip)
- Research Outputs - SPD V1.0 population estimates (24.5 MB zip)