Table of contents
- Main points
- Overview of the dynamic population model
- Improvements to data sources
- Improvements to methods
- Estimates of uncertainty for aggregate data
- Statistical population dataset coverage adjustment research
- Options for producing DPM estimates at lower levels of geography
- Upcoming improvements
- Glossary
- Provide feedback
- Related links
- Cite this methodology
1. Main points
We are continuing to develop our research into the new dynamic population model (DPM). The DPM will estimate population and population change in a timely way, to better respond to user needs.
The outputs from the DPM have been used to produce updated admin-based population estimates (ABPE) for mid-year 2021 to 2022 for all local authorities in England and Wales. These are presented in our companion Admin-based population estimates: updated estimates for local authorities in England and Wales, 2021 to 2022 article.
Since our last publication in February 2023, we have updated several of the data sources used in the model and made improvements to the DPM estimation process. We will also update on research that will support the DPM in the future. We will discuss:
- updates and improvements to data sources
- further improvements to flow rates by adjusting data to be age at time of event and accounting for the moves of special populations
- progress on creating estimates of uncertainty for aggregate ABPE results from the DPM
- update on coverage adjustment of administrative data options for creating estimates at lower levels of geography than local authority
Disclaimer
These are experimental statistics from research into a methodology that is different to that currently used in the production of population and migration statistics. The information and research in this article should be read alongside the estimates to avoid misinterpretation. These outputs must not be reproduced without this warning.
Back to table of contents2. Overview of the dynamic population model
The census has evolved over time, providing a snapshot every 10 years into who we are and how we live. The census and our census-based mid-year estimates provide the current best picture of society at a moment in time. However, the Coronavirus (COVID-19) pandemic underlined the need for more timely population estimates and we are committed to maximising the use of administrative data. We are researching new ways to produce population and social statistics.
We use a variety of data sources to provide more frequent, relevant, and timely statistics. Our population statistics sources guide helps users find the right population statistics for them.
In July 2022 we introduced the dynamic population model (DPM) as our future proposal for producing timely, coherent population statistics. In November 2022 we provided provisional population estimates for 14 case study local authorities. In February 2023 we presented the Admin-based population estimates for local authorities in England and Wales for all 331 local authorities alongside an update to our methods in Dynamic population model, improvements to data sources and methodology for local authorities, England and Wales: 2011 to 2022.
We know that our historical census and mid-year estimate approach no longer meets the full range of user needs. We are beginning to transition our methods to a new system that is less reliant on census. Our initial focus is on delivering population and migration estimates at local authority level. We intend to produce outputs that are similar to what users expect currently, but using different methods, which allow the estimates to be timelier and more reliable. Our new dynamic population model (DPM) method is more flexible and will allow us to meet a wider range of user needs. These experimental statistics give a timely indicator of changes to the population up to 2022. We will also produce our official mid-year population estimates (MYEs) for 2022 in September.
A significant advantage of the DPM is its flexibility. While it uses administrative data sources as stock datasets each year, it can incorporate other data sources when they become available. This could include sources relating to local areas or particular population groups, or sources that represent the total population. The model can also adapt to quality issues in our underlying data sources, drawing strength across data sources and balancing information from population and population change based on their respective measures of precision. We use a real-time data dashboard with data time series visualisation and outlier detection to monitor recent trends in demographic behaviours and incorporate this intelligence into the model to make it responsive to contemporary trends.
Our updated admin-based population estimates (ABPE) have been produced by the DPM despite quality issues in some of the data used for the internal migration component of the estimates. This is a significant benefit compared with our current official mid-year estimates, which have been delayed in 2023 because of data quality issues.
In this article we describe further improvements made to the methodology and data sources since our February 2023 publication. A companion article presents updated admin-based population estimates from the DPM using the new methods and data.
Back to table of contents3. Improvements to data sources
The dynamic population model (DPM) uses a range of sources to measure population (stocks) and the components of population change (flows). We have improved and updated several data sources used in the model. Assumptions made in our previous publications, Dynamic population model for local authority case studies in England and Wales: 2011 to 2022 and Dynamic population model, improvements to data sources and methodology for local authorities, England and Wales: 2011 to 2022, about individual data sources, remain the same unless expressly discussed in this article. DPM estimates refer to the population at mid-year (30 June).
Statistical Population Dataset
The Statistical Population Datasets (SPD) are a linked administrative dataset, which apply a set of inclusion rules to approximate the usually resident population. In our previous publication, Statistical Population Datasets (SPD) version 3 (SPD version 3.0) provided population stocks for 2016 to 2019, while SPD version 4.0 was used for 2020. In this publication, we no longer use SPD version 3.0, and have replaced this with a consistent SPD version 4.0 to cover the period 2016 to 2020. We use Census 2021-based mid-year estimates (MYEs) as population stock for 2021 as this is our best picture of the population in June 2021.
The new SPD version 4.0 improves on the known undercoverage of SPD version 3.0. It does this by adding new sources and refining inclusion rules. The construction of SPD version 4.0 is described in our Developing Statistical Population Datasets, England and Wales: 2021 article.
Because of data delays, we do not yet have an SPD stock available for 2022. Rather, we allow the model to estimate 2022 stocks based on input flow data up to 2022 (births, deaths, internal migration, international migration and cross-border flows) and input stock data up to 2021. We are working on productionising the dynamic population model system to ensure that data are received to meet our production cycle. In future iterations, we hope to publish estimates that include a stock for all years in our updated estimates.
Internal migration and cross-border moves
The internal migration and cross-border movements are in line with the components of change used in the official mid-year population estimates from 2011 to 2021.
We intended to include official estimates of internal migration and cross-border flows from the mid-year estimates (MYE) for 2022. This was not possible because of quality issues in some of the data used for the internal migration component. Additional research and development are necessary to address these issues before the data can be used in the DPM.
To ensure that estimates are of the highest possible quality and coherent with the latest data that underpin estimates of internal and international migration, official mid-year estimates for 2022 will be published in September 2023.
Because of the flexibility of the DPM modelling framework, we are able to construct and use alternative estimates of internal migration and cross-border flows for 2022. We can produce updated admin-based population estimates (ABPE) because the DPM incorporates multiple data sources and includes information about quality in the modelling.
These alternative estimates use the Personal Demographic Service (PDS) updates of those updating their address on NHS systems as a measure of internal migration. Similar to our previous publication, to ensure the consistency of these estimates with the rest of the time series, we scaled the PDS-based migration in 2022 to account for coverage errors. This scaling was based on the ratio of PDS-based estimates to mid-year estimates (MYE) of internal migration in 2018 and 2019 averaged for each age, sex, and local authority combination. This accounts for internal migration not captured by PDS data alone. We will continue to review the effectiveness of this methodology.
This data will be replaced with the MYE-based internal migration in our next publication in December 2023.
International migration
In our previous publication we used Long-Term International Migration (LTIM) estimates for 2011 to 2020, experimental modelled estimates for 2021 and forecasts for 2022. We have updated the migration estimates used in the model for 2021 and 2022 to bring them in line with the latest Long-term international migration, provisional: year ending December 2022. The method for breaking these data down to single year of age, local authority and nationality has been improved since the previous publication. This improved breakdown allows us to produce migration rates that better capture student migration at local authority level.
We use the same methods as described in our previous publication to disaggregate British (GB) nationals to single year of age and combine with migration data for European Union (EU) and non-EU nationals.
There have been minor changes to the way EU and non-EU migration data are derived. For EU nationals, breakdowns by age and sex are derived from Department for Work and Pensions (DWP) and HM Revenue and Customs (HMRC) Registration and Population Interaction Database (RAPID) and Higher Education Statistics Agency (HESA) data. For non-EU nationals, breakdowns are derived from Home Office data.
Both EU and non-EU data include an improved method for determining the proportion of international students in employment at local authority level using linked data from HESA and HMRC Real Time Information (RTI). Data for local authorities continue to be derived from RAPID. Asylum seekers and removals are also included for non-EU nationals.
Previously, the experimental modelled estimates for international migration did not contain data for people aged under 16 years, because of under 16s not being present in the primary source used to disaggregate to local authority level (RAPID). Instead, child migration was estimated using a scaling method that used data from LTIM and the experimental modelled estimates.
The method has been improved by using alternative data sources to estimate child migration. For immigration, we use the NHS Personal Demographic Service (PDS) to distribute child migration to local authority level. For emigration the PDS data does not produce sensible distributions for child migration at local authority level. Instead, the national estimates of child emigrants by age and sex were divided by total number of adult emigrants by sex, to create national child to adult ratios of emigration. These national ratios were then multiplied by the total number of adult emigrants by sex and local authority, to obtain estimates of child emigrant by age, sex and local authority.
Because of data availability, where the geographical distributions of international migrants for 2022 are not available, the geographic distributions from 2021 are applied to the 2022 age and sex distribution. As our methods develop and mature, we will revise these local authority distributions and use more recent data.
Back to table of contents4. Improvements to methods
Since our Dynamic population model, improvements to data sources and methodology for local authorities, England and Wales: 2011 to 2022, there have been several improvements to the dynamic population model (DPM) methods. This section outlines the improvements made to the coverage adjustment and production of rates.
Coverage ratios
In our previous publication we outlined the methods used to create coverage ratios using our population stocks. We created coverage ratios for Patient Register (PR), Statistical Population Dataset (SPD) version 3.0 and SPD version 4.0 using 2011 Census-based MYE and Census 2021-based MYE as denominators.
For the current iteration of the DPM we have simplified our approach to create coverage adjusted stocks for just PR and SPD version 4.0.
We have produced coverage adjusted stocks for 2012 to 2020. For 2011 and 2021 we use Census-based MYE and for 2022 no population stock is used in the model. The interpolation of coverage ratios produces coverage adjusted PR stocks for 2012 to 2015 and coverage adjusted SPD version 4.0 stocks for 2016 to 2020.
Unlike SPD version 3.0 used in the previous publication, SPD version 4.0 is not available for 2011. To create a proxy SPD version 4.0 for 2011 to allow comparison with 2011 Census-based MYE, we use the ratio between the PR and SPD version 4.0 in the years we have both (2016 to 2021). We then fit a linear model through these ratios over time for each local authority by age and sex combination. We extrapolate the result to cover 2011 and apply the ratio to the PR in this year to give a proxy SPD version 4.0 for 2011.
We then calculate the ratio between the PR and the 2011 Census-based MYE and Census 2021-based MYE. The coverage ratios are then smoothed across age for each local authority and sex combination using generalised additive models (GAM) for both 2011 and 2021 separately. This helps to reduce error from fluctuations and aims to capture the true underlying relationship. The same method is also applied to SPD version 4.0.
We then linearly interpolate coverage ratios by age, sex and local authority between 2011 and 2021.
Rates
We have made improvements to the method used to:
- produce coverage adjusted rate denominators
- produce internal and international migration rates that better capture student migration at local authority level and
- include adjustments for special populations
Previously our coverage adjusted rate denominators were based on a mix of SPD versions 3.0 and 4.0. Now that we consistently use SPD version 4.0 between 2016 and 2020, we have modified our methods to reflect this. We use the coverage adjusted PR between 2012 and 2015, and SPD version 4.0 between 2016 and 2020. We use the Census 2021-based MYE as the rate denominator for 2021 and rolled this forward by using flow counts to produce a rate denominator for 2022. This ensures that we have a consistent coverage adjusted denominator for producing our rates.
The DPM assumes that flow rates in the model are based on the age at the time of event, which is the age when a person moved. Our previous methods for deriving rates used data that define a person’s age at mid-year. Student migration is particularly affected by this difference because most students move to university at age 18 years, whereas their age at mid-year is, for most, 19 years. Our previous publication identified that this causes problems within the modelling process, which reduces the robustness of estimates especially in the absence of stock data. We have now implemented an adjustment to improve this.
To convert migration data from age at mid-year to age at time of migration, we created estimates of internal migration under both definitions from the Personal Demographic Service (PDS) data. The ratio between these two estimates was used to adjust our combined internal and international migration data to emulate age at time of migration.
Through applying this age at event adjustment, changes in the migration flow counts were observed across all years. For a university town, the adjustment leads to an increase in immigration counts for those aged 18 years and a corresponding decrease for those aged 19 years. This has improved the robustness of ABPE estimates for student ages and better reflects the population trends at the local authority level.
Our previous admin-based population estimates (ABPE) had not made any adjustments to flow rates to account for special populations. Special populations include prisoners and UK and foreign armed forces based in England and Wales. These populations are often not captured by standard methods used to estimate internal and international migration and so require adjustment. In our previous publication we identified that if special populations were not accounted for, inconsistencies can arise between the population stocks and flow data in certain local authorities. We have now implemented an adjustment to improve this.
The components of change produced for the MYE include the addition of special and other population net flow adjustments. We have adjusted our methods to include these additional special population moves. While only net moves are available, we sum the special population moves and add positive changes to the in-migration and add negative changes to the out-migration. These adjustments can be large, particularly for some local authorities such as those with armed forces bases.
Back to table of contents5. Estimates of uncertainty for aggregate data
Background
The dynamic population model (DPM) is run separately on each cohort and sex within a local authority. It generates the posterior distribution of the demographic account by local authority, time, single year of age (SYOA) and sex and allows the construction of uncertainty intervals for the estimates. The posterior distribution summarises the observed data combined with information on inaccuracies or expert knowledge about the data. The mean of the posterior distribution is used as a point estimate of population size while the spread is used to provide a measure of uncertainty around the estimate.
Estimating each cohort separately does not account for potential correlations between age and sex. As a result, the DPM distributions from all cohorts and both sexes cannot be used to derive uncertainty intervals for estimates of stocks and flows at aggregate levels, such as at the local authority level. Uncertainty measures for SYOA cohorts are not additive and doing so would produce uncertainty measures that are unrealistically high.
The DPM involves sampling from specified distributions of stocks and flow counts by SYOA and sex within each local authority at each point in time. To obtain adequate estimates of uncertainty at the local authority level, we need to account for potential correlations between all pairs of ages and sexes within each local authority. To achieve this, we have run the DPM multiple times, with each run based on data drawn from appropriate distributions and used the results to estimate uncertainty at local authority level. These distributions are constructed in such a way that the variances of aggregate estimates over all runs are approximately equal to the local authority level variances of the input (stocks and flow counts). A brief description of the method is given in the next section.
Method
The crucial part of the method is defining the way to randomise the input for each run, that is, the stocks in 2011, the coverage ratios for stocks after 2011 and the inflow and outflow rates.
Randomising stocks
The SYOA by sex 2011 Census-based mid-year estimates (MYE) of the population are sampled from distributions with means that are equal to the published SYOA by sex 2011 Census-based MYE. This generates variances of local authority level MYE, calculated by aggregating the SYOA by sex MYEs obtained from the samples. This approximately equals the variances derived from the published uncertainty intervals of local authority level 2011 Census-based MYE. We derive distributions by multiplying the SYOA by sex 2011 Census-based MYE by scaled local authority level 2011 Census bootstrap estimates (the bootstrap estimates were used to estimate the uncertainty of 2011 Census estimates).
The coverage ratios of stocks after 2011 are randomised in a similar way using the 2011 census bootstrap estimates.
Randomising flow rates
The rates of migration inflows and outflows by SYOA and sex are sampled from distributions. These distributions ensure that their means are equal to the smoothed rates. They also ensure that the variances of the local authority level aggregated inflow and outflow count estimates are approximately equal to the variances of local authority level inflows and outflows, which are computed using the MYE methodology for uncertainty. The distributions involve multiplying the rates by a scaled random number drawn from a normal distribution whose variance is equal to the variance of local authority level inflows and outflows.
Multiple runs
Local authority level estimates are computed for each run using input generated by applying the methods described previously and then aggregating estimates by SYOA and sex in each local authority. The uncertainty intervals of local authority level estimates are obtained using the variance of the estimates across all runs for each local authority.
Applying the method
This method is applied for the ABPE future estimates published in Dynamic population model, improvements to data sources and methodology for local authorities, England and Wales: 2011 to 2022. Because of time constraints, this research uses data from our previous publication. For this reason, data sources and assumptions differ from those used elsewhere in this article and our Admin-based population estimates: updated provisional estimates for local authorities in England and Wales, 2021 to 2022. Under this method, we use the SPD version 4.0 as population stock in 2021 and the smoothed ratio of SPD version 4.0 to Census 2021-based MYE for the coverage adjustment. The coverage adjustment assumes a linear change over time between 2011 and 2021. No population stocks are used in 2022.
For 2020 to 2022, we assume that the uncertainty of inflows and outflows are the same as in 2019. This is the most recent year for which we have detailed uncertainty measures for migration flows.
The DPM uncertainty intervals are computed using outputs from either 65 or 100 runs. Time constraints prevented us from completing 100 runs in all local authorities. Approximate convergence of the method is attained after 50 runs in most local authorities. Where convergence is clearly not attained after 65 runs, we increased the number of runs to 100.
To support a comparison of uncertainty over time and across local authorities, we calculate relative uncertainty intervals, defined as half the ratio of the distance between upper and lower uncertainty bounds to the estimate, for each local authority.
To compare the performance of the DPM with the method of MYE, we computed measures of uncertainty for MYEs in the same way. They are based on the published uncertainty intervals in Measures of statistical uncertainty in ONS local authority mid-year population estimates: England and Wales, 2020. For each method, we averaged the half-width of relative uncertainty intervals over all local authorities in each year.
Figures 1 and 2 show the results. On average, the DPM population estimates in 2011 have less uncertainty than 2011 MYE – only a small number of local authorities show higher uncertainty in DPM estimates. This stems from the smoothing effect of the DPM – it is run for the period 2011 to 2022. It assigns weights to the sampled values at each step and resamples from the values with a probability proportional to the weights. Values with low weights, which tend to be extreme, are dropped for the next step. So, the resampling skews the final sample towards values with less variation than in the initial sample.
The level of uncertainty increases at a much lower rate in the DPM. This stems from the use of stocks data in the DPM, as well as the benefit from combining data over time (effect of smoothing). The uncertainty of the DPM population estimates is dominated by the uncertainty of stocks at each point in time (in the DPM, a sample of the population is drawn from the distribution of stocks). On the other hand, uncertainty of MYE is cumulative (uncertainty of MYE 2011 stocks and net change from inflows and outflows from year to year). The increase in DPM uncertainty is relatively high in 2022, when no stocks data are used.
Figure 1: Local authority average standardised interval widths grow substantially in MYEs
Uncertainty of the mid-year estimates (MYE) at local authority level
Source: Office for National Statistics
Notes:
- Statistical uncertainty in the MYEs from 2011.
Download this chart Figure 1: Local authority average standardised interval widths grow substantially in MYEs
Image .csv .xls
Figure 2: Local authority average standardised interval widths grow only marginally in the DPM because of the use of population stocks each year
Uncertainty of the Dynamic Population Model (DPM) at local authority level
Source: Office for National Statistics
Notes:
- Statistical uncertainty in the DPM from 2011.
Download this chart Figure 2: Local authority average standardised interval widths grow only marginally in the DPM because of the use of population stocks each year
Image .csv .xlsAveraged over all local authorities, DPM uncertainty increases slightly between 2011 and 2022. However, there is a lot of variation between local authorities. In local authorities with substantial inflows or outflows, the increase over time can be large but still smaller than that of the MYE. In Westminster for example, the level of uncertainty of DPM estimates increases from 3.4% to 6.0% between 2011 and 2020, whereas for MYE it increases from 2.8% to 25.1% over the same period.
In six local authorities (Westminster, Harborough, Blaby, Waltham Forest, Rutland, Oadby and Wigston) the level of uncertainty in DPM estimates in 2011 is slightly higher than in MYE. With the exception of Westminster, the differences between uncertainty levels do not exceed 0.3%.
The method used to randomise the input may not fully capture all the existing variation and should be considered as an approximation method (see the next section). However, given the large difference between the uncertainty levels of DPM and MYE, the findings should be robust.
The level of uncertainty in DPM estimates depends largely on the uncertainty of coverage adjusted stocks. Local authority level uncertainty of the coverage adjusted stocks used in this analysis was based on 2011 Census bootstrap estimates, which were obtained using data from the 2011 Census Coverage Survey. In the future, if we use a coverage survey to adjust SPD data, the sample size of the coverage survey and the adjustment method will impact substantially on the level of uncertainty of DPM estimates. The coverage adjustment may involve adjusting for undercoverage and overcoverage, which could make the uncertainty of coverage adjusted SPD estimates higher than what we have assumed for the period 2012 to 2021.
Future work
In the local authority level variance benchmark approach we have proposed here, inflow and outflow rates are first smoothed using a statistical model and then a distribution from which to make draws is constructed, as described previously. This is done separately in each local authority, which means that potential correlations between local authorities are not accounted for, which leads to under-estimation of uncertainty above the local authority level (for example, region or national). This approach may also be difficult to adapt to estimate uncertainty at all levels of aggregation, for example, age groups by sex by local authority and age groups at national level.
We aim to integrate the two steps used in the local authority level variance benchmark approach method (smoothing of rates and randomisation of rates) by fitting a statistical model to the inflow and outflow estimates over all local authorities. This should lead to better estimates of the rates and more accurate estimates of uncertainty at all levels of aggregation.
Back to table of contents6. Statistical population dataset coverage adjustment research
The DPM requires unbiased population stock estimates for each year broken down by local authority, single year of age (SYOA) and sex. Because of coverage errors, the statistical population datasets (SPD) without any coverage adjustment would be biased and not meet this requirement. Therefore, population stocks, including the SPDs, are adjusted to account for coverage or reporting errors. Uncertainty estimates for SPD totals are also provided to the DPM. Further details can be found in our previous publication.
Under the current proxy coverage adjustment method, we assume that coverage ratios are constant from 2021 onwards, which will lead to increasing uncertainty over time. Our longer-term option to replace this proxy method must be flexible enough to be updated regularly.
We suggested previously that a voluntary household survey would enable the coverage of the SPD to be estimated. Here we describe the results of research to test the effectiveness of using Dual System Estimation (DSE) and a simple method of overcoverage estimation. We show that our application of these methods does not currently address overcoverage sufficiently. We also discuss options for future alternative methods.
2021 case study using Census Coverage Survey and SPD version 4.0
We use a subset (CCS2) of the Census Coverage Survey (CCS) for research into producing a sustainable coverage adjusted SPD. The Census Coverage Survey (CCS) is a 1% sample survey carried out six to eight weeks after the census and is a fundamental part of ensuring that the 2021 Census statistics represent the whole population. The CCS2 is a 50% subsample of the CCS that approximately maintains the same level of representativeness of the CCS. High-quality linkage was carried out between the 2021 CCS2 data and the Demographic Index (DI), which forms the base on which the SPDs are built.
The DI is a composite linked dataset, produced by linking together various administrative datasets covering the period 2016 to 2021. An individual is represented in the DI as a single entry, which may contain multiple linked records from any of the administrative data sources.
These linked datasets were used to analyse the characteristics of individuals incorrectly excluded and incorrectly included in the 2021 SPD version 4.0. We also used these data to test how well SPD coverage could be estimated without using 2021 Census data.
Census estimation methods are well understood and can be applied to SPD data and a survey like the CCS in a similar way. Previous work by the ONS applied Dual System Estimation (DSE) to the 2011 SPD version 2.0, using deterministic matching to Census 2011 data and simulating a 1% population coverage survey from the census data. This work demonstrated that extra challenges are posed by using the SPD instead of a census. These include increased overcoverage, movement of people between the time of administrative and survey data collection, and more challenging linkage because of fewer matching variables.
Although some assumptions associated with DSE are problematic (see Discussion section), it was used to estimate undercoverage of the SPD in this case study, stratified by local authority, hard-to-count index, sex and five-year age groups. To estimate overcoverage, we calculated overcount probabilities by five-year age group, sex and local authority supergroup. Cases were defined as overcount if they were found to be misplaced, duplicated, or not usually resident through linkage to a CCS record, which was treated as accurate. This combination of methods is similar to the approach used for the 2011 Census, apart from the use of ratio estimation in the 2011 Census for undercoverage estimation and census-census linkage to estimate the duplicate rate. The lack of predictive variables on the SPD (beyond age, sex, local authority and area-level characteristics) meant that a logistic regression approach for the DSE as used in 2021 Census estimation was not appropriate.
Overcoverage is a more substantial problem for admin-based population datasets than it is for traditional census returns. A census return clearly establishes the usual residence of an individual. In contrast, some administrative data interactions may take place even if an individual does not usually reside in England and Wales.
Estimation of overcoverage, in the way that it has been done for census, depends on flagging individuals as overcoverage. The CCS is used to identify misplacement and duplication overcoverage in the census, and census to census linkage is also used to identify duplicates. However, erroneous inclusion in the SPD includes people who were not UK usual residents at the time of the CCS and so could not respond. This overcoverage cannot be estimated or modelled without data on those cases, which is difficult to obtain.
Currently, the best strategy available to reduce overcoverage is to use "trimmed" DSE, which has been tested by CSO Ireland as a method to compile estimates using administrative data only. Records were scored and ordered by how likely they were to be erroneous. They were then sequentially removed until the estimate of the population no longer decreased. In this work, a trimming score was assigned based on the date of last interaction in the source datasets. A range was tested before choosing one trimming score threshold for the results presented here, above which all records were removed. We chose a trimming score based on convergence of estimates, that is, we chose the score independently of census or MYE data. This allows us to understand the accuracy achievable in the absence of a census. The trimming score chosen in this work resulted in the removal of approximately 4.6% of SPD records.
Processing and estimation stages
- Link CCS data to the Demographic Index
- Subset CCS data to CCS2 only
- Trim records most likely to be erroneously included
- Estimate overcoverage and undercoverage by stratum
- Is the estimate still decreasing? If ‘Yes’, go back to Trim records most likely to be erroneously included (step 3). If ‘No’, go to the next stage
- Final estimate
2021 Case study results
The coverage adjusted SPD estimates were compared with the Census 2021-based MYEs to measure the coverage error. We treat the Census 2021-based MYEs as correct, given that the time elapsed since 2021 Census is small and therefore uncertainty is small. The total coverage adjusted SPD estimate for England and Wales was greater than the MYE by 3.98%. This is greater than the difference between the unadjusted SPD count and the MYE. Without applying trimming, the over-estimation is greater, at 5.36%. We only present estimates using trimming in the following results. We do not include measures of uncertainty for our coverage adjusted SPD estimates here as our work to estimate sampling variance is still in progress. We intend to share information about this uncertainty in a more detailed methods paper to be published on the UK Statistics Authority website after submission to our Methodological Assurance Review Panel (MARP).
| Method | National (England and Wales) June 2021 population total | Difference relative to MYE (%) |
|---|---|---|
| Census 2021-based MYE | 59,641,829 | 0.00 |
| Unadjusted SPD count | 58,949,900 | -0.77 |
| Coverage adjusted SPD estimate | 62,017,780 | +3.98 |
Download this table Table 1: Comparison of unadjusted and coverage adjusted SPD estimates for year ending mid-2021 and Census 2021-based MYE, England and Wales
.xls .csvCoverage error differed across age groups, as shown in Figure 3. The oldest and youngest age groups had the smallest coverage error, and males had higher coverage error than females except for the 10 to 14 and 15 to 19 years categories.
Figure 3: Coverage error varied across age groups and was generally higher for males than females
Coverage error (%) using mid-year estimates (MYE) as true population size
Source: Office for National Statistics
Notes:
- Coverage error of coverage adjusted SPD estimates, using 2021 Census-based MYEs as the reference population size assumed to be true, by five-year age group and sex.
Download this chart Figure 3: Coverage error varied across age groups and was generally higher for males than females
Image .csv .xlsFigure 4 shows the coverage error by local authority as a percentage of the local authority Census 2021-based MYE population size. Most local authority estimates had a positive coverage error between 0 and 10%, that is, the coverage adjusted SPD estimates were greater than the MYE. A small number of local authority estimates had negative coverage error.
Figure 4: Most local authority estimates had a positive coverage error indicating the coverage adjusted SPD estimates were greater than the MYE
Embed code
Notes:
- Local authority-level coverage error of coverage adjusted SPD estimates, using 2021 Census-based MYEs as the reference population size assumed to be true. The local authorities are ordered on the x-axis by coverage error.
Download the data
Figure 5 and Figure 6 show the geospatial distribution of coverage error by local authority. Urban areas, especially London, often had greater positive coverage error. City of London was an extreme outlier (coverage error 29%) and is not shown on this scale so that the differences between other local authorities are more visible.
Figure 5: In England and Wales, local authorities in urban areas had coverage error that indicates that the coverage adjusted SPD estimates for year ending mid-2021 were greater than Census 2021-based MYE
Coverage error (%) using mid-year estimates (MYE) as true population size

Source: Office for National Statistics
Notes:
- Local authority-level coverage error of coverage adjusted SPD estimates, using 2021 Census-based MYEs as the reference population size assumed to be true.
Download this image Figure 5: In England and Wales, local authorities in urban areas had coverage error that indicates that the coverage adjusted SPD estimates for year ending mid-2021 were greater than Census 2021-based MYE
.png (100.2 kB) .xlsx (49.1 kB)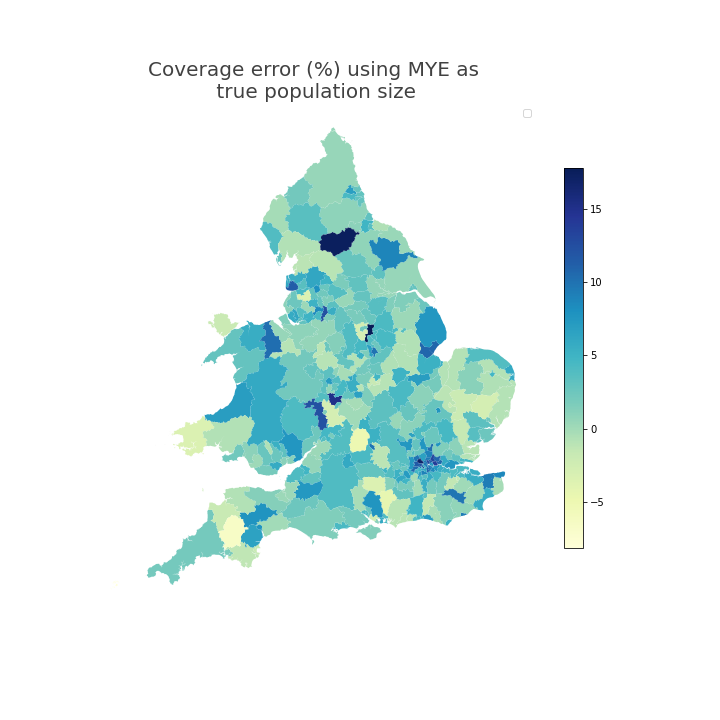
Figure 6: In London, local authorities had coverage error that indicates that the coverage adjusted SPD estimates for year ending mid-2021 were greater than Census 2021-based MYE
Coverage error (%) using mid-year estimates (MYE) as true population size

Source: Office for National Statistics
Notes:
- Local authority-level coverage error of coverage adjusted SPD estimates, using 2021 Census-based MYEs as the reference population size assumed to be true. City of London is not shown so that the differences between other local authorities are more easily observed.
Download this image Figure 6: In London, local authorities had coverage error that indicates that the coverage adjusted SPD estimates for year ending mid-2021 were greater than Census 2021-based MYE
.png (55.4 kB) .xlsx (22.6 kB)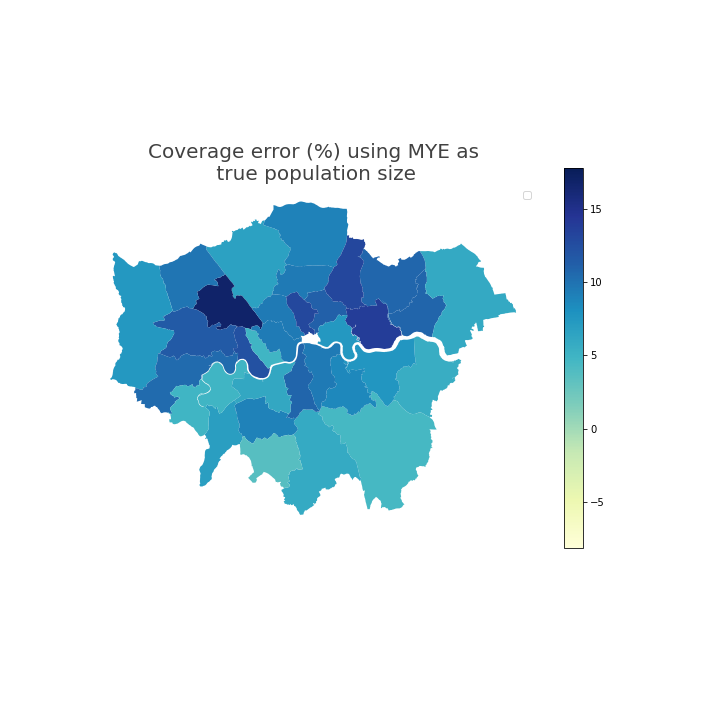
2021 Case study discussion
Our results show a large difference between the coverage adjusted SPD estimates and the Census 2021-based MYEs, which would be expected given the considerable limitations of the current method. We should also consider that MYEs have some error, but this will be smaller than the differences observed.
A larger adjustment was applied for undercount than for overcount in almost all estimation strata. We believe that undercoverage estimation adjusted well for individuals omitted from or misplaced (located in a different local authority or hard-to-count group) in the SPD. This is supported by good agreement between our undercoverage adjustment and a geography-specific analysis of the linkage of the SPD and Census 2021 or CCS. However, overcoverage estimation was dominated by misplacement, with other important types of overcoverage not accounted for. Trimming successfully removed some overcoverage in the SPD so that the final estimates were reduced by 1.3% compared with estimation without trimming. This does not go far enough, but it is promising that further development with a more sophisticated scoring method may yield better results.
As well as encountering issues with overcoverage, for this case study we found it difficult to restrict the scope of estimation to the population we defined. The CCS does not cover large communal establishments (LCEs). We removed as many individuals living in LCEs as we could by labelling those at an LCE address (as defined by Census 2021) on their PDS record. Although this method has limitations, the adjustment has limited impact on results as only around 1% of the population live in LCEs. However, some local authorities and age groups are disproportionately affected. In future, it will be necessary to add auxiliary information to the SPD for different kinds of residence, to allow different estimation methods to be applied to different subpopulations.
Some assumptions required when using DSE do not hold in the context of the SPD and CCS2 data used here. DSE assumes that individuals have equal capture probability on one of the two lists. For each stratum of estimation, we must assume equal capture probability for all individuals to respond to the CCS, as this is not the case for the SPD. Five-year age groups were chosen to create strata of sufficient sample sizes, but CCS response probabilities vary within these groups. The population is assumed to be closed, with no movement in or out between the date of SPD interaction and the date of the CCS data collection. This is not currently the case, which leads to over-estimation. Linkage between the SPD and CCS is assumed to be perfect. In practice, there is error from missed links, which lead to over-estimation, and false links, which lead to under-estimation.
Future options for coverage estimation
Overcoverage in the SPD is the most significant challenge in providing unbiased population stock estimates to the DPM. There are two proposed solutions to address this.
The first solution is to collect accurate data on individuals who are leaving or have left the usually resident population. Some other countries use contact details from their local or centralised population registers to follow up individuals and audit the quality of the register, checking for and removing those no longer resident. The greatest challenge is differentiating non-responders from people no longer resident. To do this to the highest quality would require additional fieldwork. There are two main ways to use administrative data while carrying out such fieldwork:
- dependent sampling is where the sample is drawn using information from an administrative dataset
- dependent interviewing is where interviewers share information from administrative datasets with respondents to either verify or correct it
Dependent sampling (also known as list-based sampling) could involve using the SPD to identify and oversample certain groups that are more prone to overcoverage.
While dependent interviewing can help to identify cases of overcoverage, it was not approved last time it was discussed by the national statistician's data ethics advisory committee (NSDEC). The SPD also does not hold contact details to enable follow up apart from addresses.
The second solution to the overcoverage problem is to use stricter rules or a model, taking advantage of more data sources, to produce an SPD or administrative lists with less overcoverage. The aim would be to remove individuals from the SPD until negligible overcoverage remains. This inevitably increases undercoverage, but the aim is not to produce an SPD of a similar size to the true population. When applying trimming in the 2021 case study previously, we did not use any data aside from the core SPD variables. Other sources could be considered. The linked 2021 Census and administrative data may enable us to train a model or develop rules that remove more overcoverage, even if this increases undercoverage. This may work well in the short-term but would require review and audit. If no other sources are available, we would require data as described in the first solution.
We continue to develop the thinking previously outlined in our Methodological Assurance Review Panel (MARP) article. Some approaches use surveys directly to estimate over- or undercoverage. Others require periodic auditing surveys to monitor over- or undercoverage. Auditing surveys would help us understand if coverage issues are initially negligible or predictable, and whether they change over time. We consider the following to be the most viable options for producing coverage adjusted population estimates.
Option 1
Two surveys are used for estimation and the SPD is used in its current form.
Survey 1: An area- or address-based sample survey is used to estimate undercoverage
Survey 2: A list-based dependent sample survey with dependent interviewing is used to estimate overcoverage
Option 2
One survey is used for estimation (two different sub-options).
Option 2a. The Demographic Index (DI) is used instead of the SPD, if undercoverage of the DI can be considered negligible. An inclusion model of the kind developed previously is used to estimate overcoverage of the DI and to calculate population totals. A list-based dependent sample overcoverage survey with dependent interviewing is required to update models. A periodic area or address-based sample may be required to audit undercoverage.
Option 2b. The SPD is used in its current form. An area- or address-based sample survey is used to estimate undercoverage. Overcoverage is reduced to a negligible level by using strict inclusion rules or model-based trimming scores. A periodic list-based dependent sample survey and dependent interviewing may be required to audit inclusion rules or model-based trimming.
Option 3
No survey is used for estimation. Surveys are used only for auditing. The administrative sources used may be combined as in the current SPD or kept separate.
Two or more separate administrative lists recording interactions with different services (or a combination of services) are used in an estimation system. One of these may be constructed in a similar way to the current SPD. In the case of more than two lists, inter-dependence may be modelled. This option is dependent on undercoverage being minimised and effectively estimated using multiple lists. Overcoverage is reduced to a negligible level by using strict inclusion rules or model-based trimming scores. Ongoing surveys would be required to collect data to audit undercoverage, accuracy of inclusion rules or model-based trimming and correct placement.
Next steps
We will focus on developing stricter inclusion rules and model-based trimming as required for Options 2b and 3. These options depend less on reliable overcoverage data that may be difficult to collect. We will also continue exploring other administrative data sources, as rule- or model-based trimming will reduce the size of the data available and therefore create greater uncertainty in dual or multiple system estimation.
Back to table of contents7. Options for producing DPM estimates at lower levels of geography
As we transition from the current population estimation system based on census and mid-year estimates (MYE) to the dynamic population model (DPM), it is important to consider methods for estimating population at lower levels of geography. At present, the DPM produces estimates at local authority level by single year of age and sex. However, to aid in evaluating the performance at more granular geographies than local authority, initial 2021 Lower layer Super Output Area (LSOA) estimates were produced using a simple benchmarking method. A ratio of the DPM local authority estimates to the statistical population dataset (SPD) version 4.0 local authority estimates was produced. This was then applied to the SPD LSOA estimates to calculate a calibrated DPM estimate total for each LSOA (no breakdowns by age and sex were estimated). As 2021 boundaries were not available, these estimates were produced on the 2011 LSOA boundaries. The LSOA analysis can be found in the local authority case studies reports, along with data downloads for all LSOAs.
To improve upon this approach in the future, a number of more refined methods could be considered for producing estimates below local authority level in the transformed population estimation system.
There are methodological and quality advantages and disadvantages to all options.
Current DPM approach
The DPM can be run at disaggregated geographies lower than local authority, which would produce not only population estimates but associated uncertainty measures. However, running the DPM approach directly at Middle layer Super Output Area (MSOA) or LSOA level (by age and sex) has drawbacks. Further research would be required into whether DPM input data sources such as international migration can be produced to the necessary level of quality below local authority level. In addition, for MSOAs or LSOAs split by age and sex, there would be a high percentage of zero or small counts in both the stock and flow inputs to the DPM, which may lead to the model failing to run.
Adopting current MYE ratio change method: improved local authority benchmark
The simplest approach is to use the ratio change method for MSOA and LSOA estimates used for the MYE, except using DPM local authority benchmarks rather than the equivalent MYE benchmarks. Incorporating a local authority level benchmark that is expected to be of higher quality should also improve the quality of estimates below local authority level. It should be noted that the Patient Register (PR), which forms the basis of the ratio change method, was discontinued in 2020 and replaced by the Personal Demographics Service (PDS). Notable drawbacks of ratio change methods are the lack of associated uncertainty measures and their reliance on a census starting point.
Adopting current MYE ratio change method: improved local authority benchmark and SPD inputs
Another variation of the ratio change method is to use the same approach as in option 2 except SPDs are used for the ratio change method, rather than the PR. It is envisaged that SPDs would provide a better administrative dataset for population change by hopefully minimising the challenges encountered by the PR, such as unpredictable list cleaning.
Small Area Estimation (SAE) methods
SAE methods combine and borrow strength from several different data sources, such as surveys, census and administrative datasets. For estimating single year of age by sex by MSOA or LSOA and based on current survey sizes, there would be a large percentage of cells with zero or low sample counts. This would likely make model fitting impractical. It is expected that the number of age sex categories would have to be dramatically reduced for these approaches to be considered which is undesirable. In fact, even with age and sex heavily collapsed, some SAE methods rely on finding covariates that are sufficiently predictive of the dependent variable which may not be possible.
Geospatial methods
Geospatial methods with mapped or gridded data are well documented but have not yet been explored. These include a range of spatial modelling approaches such as "top-down" dasymetric disaggregation techniques or "bottom-up" model-based prediction (see Wardrop and others (2018) for an outline of approaches). The latter can provide measures of uncertainty. Both top-down and bottom-up approaches rely on the availability and quality of high-resolution geospatial covariate and ancillary data, which can include alternative sources such as satellite imagery, land cover and use, and service infrastructure. The key concept is to improve accuracy of the allocation process by considering patterns and relationships within the detailed spatial information.
Back to table of contents8. Upcoming improvements
In December 2023 we will provide further updated admin-based population estimates (ABPE) from the dynamic population model (DPM) for all local authorities from 2011 to 2022 alongside provisional estimates for mid-year 2023.
We plan to incorporate the following improvements:
- include SPD population stock for 2022
- splitting of combined migration into internal, international and cross-border migration
- implement changes to the method used to fit the model; we will test a change from Particle Filters to Template Model Builder used to approximate the distribution of the demographic account during the estimation process
9. Glossary
Dynamic population model
A dynamic population model (DPM) is a statistical modelling approach that uses a range of data to measure the population and population changes in a fully coherent way.
Credible intervals
The range in which the true value of the quantity being estimated is likely to be contained. We use 95% credible intervals in this article by taking 2.5th and 97.5th percentiles from the distributions of counts produced by our estimation process as the lower and upper bounds of our intervals respectively. In this case, we can say that the probability that the true value lies in the credible interval is 95%.
Personal Demographic Service (PDS)
The Personal Demographic Service (PDS) from NHS Digital is a national electronic database of NHS patients, which contains only demographic information with no medical details. The PDS differs from the Patient Register (PR), since it is updated more frequently and by a wider range of NHS services. The PDS data available to the ONS consist of a subset of the records, including those which show a change of postcode recorded throughout the year or a new NHS registration.
Generalised Additive Model (GAM)
A Generalised Additive Model allows the modelling and smoothing of non-linear data. GAMs have been used within the DPM to model and smooth raw stock and flow data. This was done to reduce the amount of random variation and attempt to represent the true underlying pattern. This approach is particularly useful when working with noisy data or rare events.
Back to table of contents10. Provide feedback
We welcome your feedback on the dynamic population model (DPM), our transformation journey, and our latest progress and plans. If you would like to contact us, please email us at 2023Consultation@ons.gov.uk.
We have launched our Local population statistics insight feedback framework, which enables users of population statistics to provide feedback at local authority level and suggest data sources for us to better understand the quality of our estimates.
You can also sign up to email alerts from the Office for National Statistics Population team for updates on our progress, and to hear about upcoming events and opportunities to share your views.
Collaboration
The Office for National Statistics (ONS) has been supported in this research by the University of Southampton. Specifically, we would like to thank John Bryant, Peter Smith, Paul Smith, Jakub Bijak, Jason Hilton, Andrew Hind, Erengul Dodd and Joanne Ellison for their guidance and support.
We are also indebted to the insights, expertise and feedback provided by local authorities: Blackpool, Boston, Cambridge, Ceredigion, Coventry, Guildford, Gwynedd, Islington, Manchester, Newham, North Norfolk, Swansea, Warwick, Westminster.
Back to table of contents12. Cite this methodology
Office for National Statistics (ONS), released 27 June 2023, ONS website, methodology, Dynamic population model, improvements to data sources and methodology for local authorities, England and Wales: 2021 to 2022