Table of contents
- Main points
- Introduction
- Change in well-being up to and during the pandemic
- Most important factors affecting anxiety during the coronavirus pandemic
- Personal circumstances associated with high anxiety
- Personal characteristics associated with high anxiety
- Coronavirus-specific circumstances associated with high anxiety
- Significance levels of variables
- Glossary
- Strengths and limitations
- Quality and methodology
- Related data
- Related links
1. Main points
The factors most strongly associated with high anxiety during lockdown include loneliness, marital status, sex, disability, whether someone feels safe at home or not and work being affected by the coronavirus (COVID-19) pandemic.
Feeling lonely was the factor most strongly associated with reporting high anxiety – people who "often or always" felt lonely were almost five times more likely to report high anxiety than those who “never” feel lonely.
The percentage who reported high levels of anxiety significantly increased for people who are married or in a civil partnership during lockdown to 39%, up from 19% in the last quarter of 2019; prior to the pandemic, the percentage reporting high anxiety was lowest for people who are married or in a civil partnership compared with all other marital status groups.
Those who are married or in a civil partnership are more likely to be balancing homeschooling alongside other commitments, with 1 in 4 people homeschooling during the pandemic, compared with approximately 1 in 10 people who are single, separated or divorced.
Those aged 75 years and over were almost twice as likely as those aged 16 to 24 years to report high anxiety during lockdown; analysis of data prior to lockdown suggests anxiety tends to be lowest among those aged from their mid to late 60s, remaining relatively stable in later years.
For people reporting high anxiety during the pandemic, over 1 in 5 said that their work had been affected because they were finding working from home difficult.
Statistician’s comment
"There is understandable concern about the impact of the pandemic on people’s well-being. Our figures show that the equivalent of 19 million adults in Great Britain report high levels of anxiety.
“One particularly striking finding is that 39% of people who are married or in a civil partnership, reported high levels of anxiety. This compares with 19% pre-pandemic. It may in part be because of the challenges of homeschooling alongside work and other responsibilities.
"Another marked change is in those aged 65 years or older. Prior to the coronavirus pandemic we consistently saw lower anxiety ratings in those aged 65 years and older, but now we are seeing the highest levels of anxiety amongst this group in lockdown".
Dawn Snape, Assistant Director of Sustainability and Inequalities Division, Office for National Statistics
Back to table of contents2. Introduction
At the beginning of lockdown we saw a deterioration in all measures of personal well-being: life satisfaction, feelings that things done in life are worthwhile, happiness and anxiety; our recent publication on personal and economic well-being presents further detail on this. Over a third (37.4%) of adults in Great Britain said that the coronavirus (COVID-19) pandemic has affected their well-being between 3 April and 10 May 2020.
This article contains data and indicators from a new module undertaken by the Office for National Statistics (ONS) Opinions and Lifestyle Survey (OPN) to understand the impact of the coronavirus pandemic on British society. More specifically, the statistics in this article are based on a combined dataset merging five weeks of data collected on the OPN Survey between 3 April and 10 May 2020. This provides data from 6,430 adults aged 16 years and over in Great Britain.
More about coronavirus
3. Change in well-being up to and during the pandemic
There was a marked increase in anxiety at the beginning of lockdown. Between 20 and 30 March 2020 almost half (49.6%) of people reported high anxiety and average anxiety scores were 5.2 out of 10, a marked increase from 3.0 in the last quarter of 2019.
Figure 1 shows that anxiety has remained at an elevated level compared with the end of 2019, but it has dropped since the beginning of lockdown. Average anxiety scores were 4.0 out of 10 between 30 April and 10 May 2020 and 37% were reporting high levels of anxiety.
The effect seen on average anxiety ratings throughout the coronavirus (COVID-19) pandemic shows a similar pattern to the theory of “hedonic adaptation” (Diener and others, 2006). When a shock event occurs, such as the impact of the coronavirus, well-being is temporarily impacted but people then quickly adapt so that well-being partially bounces back; though not necessarily to the same level as it was before the shock. During lockdown, new measures have been put into place, which may have also helped to alleviate high levels of anxiety
Figure 1: Levels of anxiety increased at the beginning of lockdown but have somewhat rebounded
Average personal well-being ratings, UK and Great Britain, Quarter 1 (Jan to Mar) 2019 to 10 May 2020
Embed code
Notes:
- Chart axis has a break in it.
- Quarterly data are seasonally adjusted – see Personal well-being quarterly estimates technical report for more information, monthly and weekly data are non-seasonally adjusted.
- Quarterly data is from the Annual Population Survey, a continuous household survey, which covers the UK.
- Monthly and weekly data are from the Opinions and Lifestyle Survey which covers Great Britain.
- The weekly data on the chart covers the period leading up to and including lockdown from 20 March to 10 May 2020.
5. Personal circumstances associated with high anxiety
Loneliness
Feeling lonely was the factor most strongly associated (lowest p-value) with high anxiety during the coronavirus (COVID-19) pandemic. For someone who reported that they “often or always” felt lonely, the odds of reporting high anxiety (scoring between 6 and 10 out of 10) were almost five (4.7) times greater than those for someone who “never” felt lonely.
"Similarly, those who felt lonely “some of the time”, “occasionally”, or “hardly ever” also had greater odds of reporting high anxiety than those who “never” felt lonely – 2.8, 1.8 and 1.3 times, respectively. Between 3 April and 10 May 2020, average anxiety ratings for those who “often or always” felt lonely were 6.4 out of 10, this compares with 3.1 out of 10 for those who “never” felt lonely."
The recent article Coronavirus and loneliness showed that 5.0% of people in Great Britain (2.6 million) said they felt lonely “often or always” between 3 April and 3 May 2020, a similar percentage of the population to pre-lockdown. Reporting “often or always” feeling lonely could be considered as being chronically lonely. Nearly 1 in 3 adults who noted their well-being during lockdown had been affected in the past week (around 7.4 million adults) cited feeling lonely as one of the factors affecting their well-being.
Those who are married or in a civil partnership were 2.1 times as likely to report high anxiety than those who are widowed during the first weeks of lockdown. In addition, those who are single or “separated or divorced” were more likely to report high anxiety than those who are widowed (1.8 and 1.5 times as likely, respectively).
Figure 3: Anxiety ratings have improved for those that said they “never” felt lonely
"How often do you feel lonely?" by average anxiety ratings over time, Great Britain, 3 April to 10 May 2020
Source: Office for National Statistics - Opinions and Lifestyle Survey
Notes:
- Respondents were asked “Overall, how anxious did you feel yesterday?” and answered on a scale of 0 to 10, where 0 is “not at all” and 10 is “completely”.
- The estimate is calculated as a mean of the answers to the anxiety question by their response to the question “How often do you feel lonely?”.
- The 95% confidence intervals highlight the degree of uncertainty around an estimate. Non-overlapping confidence intervals suggest a statistically significant difference between groups.
- Confidence intervals are wide on this figure due to small sample sizes of those who “never” feel lonely at each weekly data collection.
Download this chart Figure 3: Anxiety ratings have improved for those that said they “never” felt lonely
Image .csv .xlsAn additional regression analysis found that the characteristics most associated with “often or always” feeling lonely or feeling lonely “some of the time” are being disabled, being younger, living in a single person household and being widowed, this is consistent with previous analysis.
In this additional analysis we also found a significant association between loneliness and a sense of social support. For example, people who did not agree with the statement “If I needed help, there are people who would be there for me” were over four times as likely to report they were lonely either “often or always” or “some of the time”.
Those living in a single person household were only 2.8 times as likely to report being lonely. Supporting the well-documented perception that loneliness is not necessarily about just being alone but is the feeling we get when our need for rewarding social contact and relationships is not being met.
The analysis also showed the odds of being lonely were 35% less for people who turned to work to cope during lockdown compared to those who did not. It is possible that going to work provides a sense of normality during lockdown and enables ongoing social interaction with colleagues. Further indicating social networks, whether that be personal or professional, as being a particularly important factor during lockdown. Full details of the analysis can be found in the accompanying datasets.
Marital status
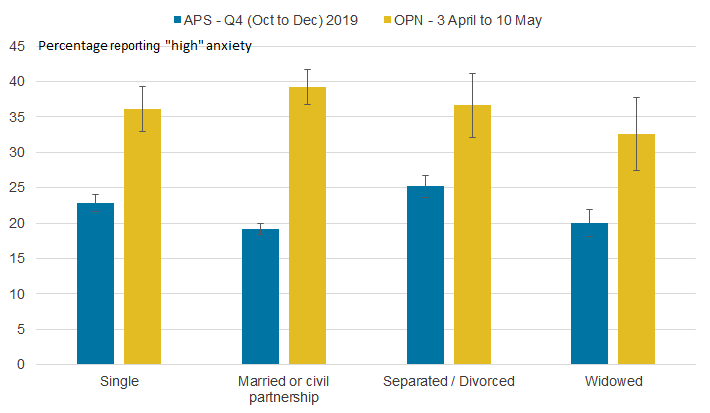
Figure 4 shows that the percentage of people who are married or in a civil partnership that reported high levels of anxiety significantly increased since the last quarter of 2019; 39% up from 19%. Prior to lockdown, the percentage reporting high anxiety was lowest for those who were married or in a civil partnership (19%) compared with all other marital status groups (23%).
Figure 4: People who are married or in a civil partnership were more likely to report high anxiety than other marital status groups during the first weeks of lockdown
Percentage of the population reporting high anxiety by marital status, October to December 2019 and 3 April to 10 May 2020
Source: Office for National Statistics - Opinions and Lifestyle Survey
Notes:
- Respondents were asked “Overall, how anxious did you feel yesterday?” and answered on a scale of 0 to 10, where 0 is “not at all” and 10 is “completely”.
- The estimate is calculated as a mean average of anxiety by reported marital status.
Download this image Figure 4: People who are married or in a civil partnership were more likely to report high anxiety than other marital status groups during the first weeks of lockdown
.png (17.8 kB) .xlsx (20.4 kB)
Those who are married or in a civil partnership are 2.1 times as likely to report high anxiety than those who are widowed during the first weeks of lockdown. In addition, those who are single or “separated or divorced” are more likely to report high anxiety than those who are widowed (1.8 and 1.5 times as likely, respectively).
Figures from the pooled Opinions and Lifestyle Survey (OPN) dataset found that a greater percentage of people who are married or in a civil partnership are living with dependent children (38%) compared with those who are not married or in a civil partnership (28%). Those who are married or in a civil partnership could therefore be facing additional pressures such as balancing homeschooling with their work. Of those who are married or in a civil partnership, 1 in 4 people are homeschooling, compared with approximately 1 in 10 people who are single, separated or divorced.
Analysis considering the impact of homeschooling during the coronavirus found that just over a quarter (26%) of those who were homeschooling “strongly” or “somewhat” disagreed that they felt confident in their abilities to homeschool. Between 3 April and 10 May 2020 a higher percentage of those who are married or in a civil partnership also said that homeschooling was negatively affecting their well-being (8%) when compared with all other marital status groups (2%)1.
In addition, 7% of those who are married or in a civil partnership said that they were spending more time caring for others during the pandemic, compared with 2% of people from all other marital status groups.
Country of residence
The odds of reporting high anxiety were 28% less for people living in Scotland than those living in England. The difference between England and Wales was not statistically significant. Recent analysis, that used another OPN pooled dataset covering the month of April, found that 80% of adults were worried about the effect that the coronavirus is having on their life. Across different regions and countries of Great Britain, this varied from 76% in the East Midlands and Scotland, to 87% in the North East.
Notes for: Personal circumstances associated with high anxiety
- It is important to note that homeschooling is not controlled for in this regression model. Further information about this limitation can be found in Section 11.
6. Personal characteristics associated with high anxiety
Sex
As can be seen in Figure 5, anxiety was higher for women than men in the early stages of lockdown but the gap between the sexes narrowed in subsequent weeks, such that in the latter part of the period covered, there was no significant gap between men and women. Prior to lockdown, anxiety was usually higher for women than men.
Figure 5: The difference in anxiety scores between men and women has decreased since the start of lockdown
"Overall, how anxious did you feel yesterday?", average (mean) scores by sex, Great Britain, 20 March to 10 May 2020

Source: Office for National Statistics - Opinions and Lifestyle Survey
Notes:
- Respondents were asked “Overall, how anxious did you feel yesterday?” and answered on a scale of 0 to 10, where 0 is “not at all” and 10 is “completely”.
- The estimate is calculated as a (mean) average of the answers to the anxiety question by the respondent’s sex.
- The 95% confidence intervals highlight the degree of uncertainty around an estimate. Non-overlapping confidence intervals suggest a statistically significant difference between groups.
- Confidence intervals are wide on this figure due to smaller sample sizes at each individual wave of data collection.
Download this image Figure 5: The difference in anxiety scores between men and women has decreased since the start of lockdown
.png (14.4 kB) .xlsx (20.7 kB)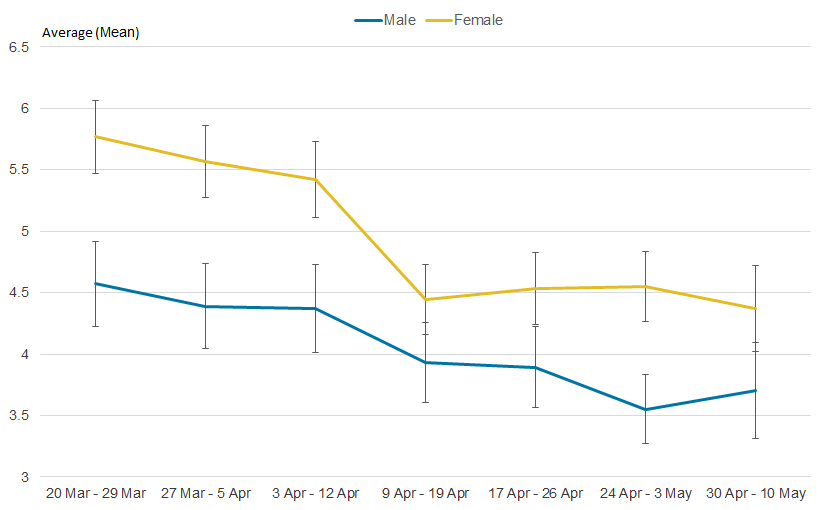
Women are 1.6 times as likely to report high anxiety (scoring 6 to 10 out of 10) than men. Between 3 April and 10 May 2020, average anxiety scores for women were 4.7 out of 10 compared with 3.9 out of 10 for men.
Some of our recent publications highlight some possible reasons as to why anxiety is greater for women than men during the coronavirus (COVID-19) pandemic. These include: finding working from home more difficult, being more concerned about health and safety at work, spending significantly more time doing unpaid housework (excluding travel and childcare) and spending significantly less time doing gardening or DIY than men.
The burden of homeschooling has fallen disproportionately to women (60%), potentially contributing to higher anxiety among women. Almost a fifth of women (19%) said they are involved in the provision of homeschooling compared with a smaller proportion (13%) of men.
Disability
Being disabled is another highly significant factor affecting high anxiety during the coronavirus pandemic. For the purposes of this analysis, a person is considered disabled if they have a self-reported long-standing illness, condition or impairment that reduces their day-to-day activities. This definition is consistent with the Equality Act 2010 and the Government Statistical Service (GSS) harmonised definition. For further information, please see Section 5.
The odds of reporting high anxiety (scoring between 6 and 10 out of 10) are 1.5 times as great for disabled people than non-disabled people.
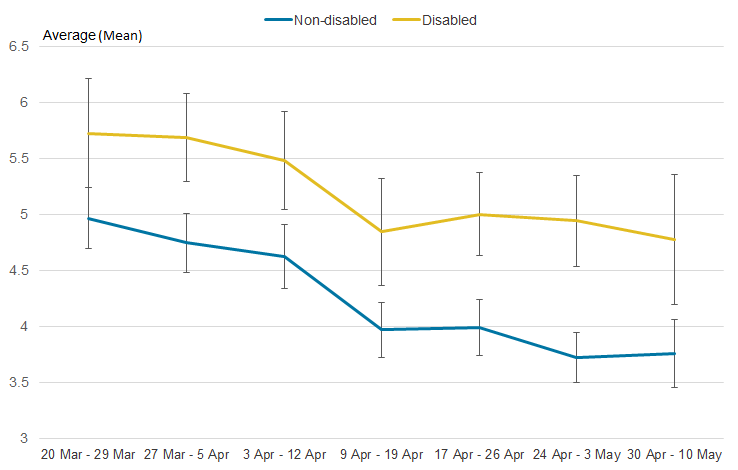
Average anxiety levels are over 24% higher for those who are disabled (5.0 out of 10) compared with non-disabled (4.0 out of 10), between 3 April and 10 May 2020. However, disparity in anxiety levels for disabled and non-disabled individuals is not unique to the coronavirus pandemic, this is consistent with the last quarter of 2019.
Figure 6 shows that throughout lockdown, despite an overall decrease in anxiety ratings for both disabled and non-disabled people, average anxiety ratings have remained significantly higher for those who are disabled compared with non-disabled.
Figure 6: Levels of anxiety have been significantly higher for disabled than non-disabled adults
"Overall, how anxious did you feel yesterday?", average (mean) scores by disability in Great Britain, 20 March to 10 May 2020
Source: Office for National Statistics - Opinions and Lifestyle Survey
Notes:
- Respondents were asked “Overall, how anxious did you feel yesterday?” and answered on a scale of 0 to 10, where 0 is “not at all” and 10 is “completely”.
- The estimate is calculated as a (mean) average of the answers to the anxiety question by disability.
- Because of the low counts for those whose response was either "Refusal" or "Don’t know" at each of the waves, these figures have been excluded from this chart because of high levels of uncertainty around the estimates.
- Section 6 provides further information on how the disability variable is derived.
- The 95% confidence intervals highlights the degree of uncertainty around an estimate. Non-overlapping confidence intervals suggest a statistically significant difference between groups.
- Confidence intervals are wide on this figure because of smaller sample sizes at each individual wave of data collection.
Download this image Figure 6: Levels of anxiety have been significantly higher for disabled than non-disabled adults
.png (14.2 kB) .xlsx (21.0 kB)
The main reasons cited by disabled adults for their well-being concerns between 3 April and 10 May 2020 were feeling worried about the future (70.1%), being stressed or anxious (70.0%), boredom (46.7%) or through mental health worsening (48.7%).
Recent analysis has shown that disabled adults are more worried about the effect of the coronavirus on their well-being, health and access to essentials and healthcare than non-disabled adults. Concerns about well-being during the coronavirus pandemic tend to be more common amongst disabled people with social, behavioural or mental health impairments. Among those who are disabled, this group reported the highest level of anxiety.
Age
The government have highlighted that people aged over 70 years are at greater risk than other ages and have advised that they should be more stringent with social distancing measures and to ask friends, family and neighbours for support with essential supplies including food and medicine.
Age had a significant impact on anxiety ratings during COVID-19; the likelihood of reporting high anxiety was greatest for those in the oldest age group. The odds of reporting high anxiety were 2.0 times as great for those aged 75 years and over than those aged 16 to 24 years. This differs from previous findings prior to the pandemic where anxiety levels have tended to be highest in mid-life, declining as people reach their early to mid-60s and dropping to their lowest levels in the mid to late 60s where they stay relatively stable.
The increased anxiety among older people observed during this early period of the lockdown may be linked to extensive media coverage and UK government advice that people over 70 years are at greater risk from the coronavirus (COVID-19) than younger people. They were also advised to be stringent with social distancing measures, leading to higher anxiety in the older age groups during the pandemic. A recent ONS article showed that a large proportion (43%) of those that are clinically extremely vulnerable (CEV) in England were over the age of 70 years.
Back to table of contents7. Coronavirus-specific circumstances associated with high anxiety
Between 3 April and 10 May 2020, average anxiety levels were considerably higher for people who feel “unsafe or very unsafe” in their own home (5.8 out of 10) when compared with those who feel “very safe” (3.6).
Figure 7: Percentage differences in average anxiety ratings between feelings of safety in own home
"How safe or unsafe do you feel in your own home since the Coronavirus (COVID-19) outbreak?" by average anxiety ratings, Great Britain, 3 April to 10 May 2020
Source: Office for National Statistics - Opinions and Lifestyle Survey
Notes:
- Respondents were asked “Overall, how anxious did you feel yesterday?” and answered on a scale of 0 to 10, where 0 is “not at all” and 10 is “completely”.
- The estimate is calculated as a (mean) average of the answers to the anxiety question by their response to the question “How safe or unsafe do you feel in your home since the coronavirus (COVID-19) outbreak?”.
Download this chart Figure 7: Percentage differences in average anxiety ratings between feelings of safety in own home
Image .csv .xlsThe odds of reporting high anxiety for those who feel “unsafe or very unsafe” in their home are almost three times as great than those who feel “very safe”. Those who feel “neither safe nor unsafe” or “safe” also have greater odds of reporting high anxiety than those who feel “very safe” (both 1.4 times as likely).
Further analysis found that not having help available if you needed it, being worried about the effect of the coronavirus (COVID-19) on family and friends, and being worried about the effect on relationships with friends were all significant predictors of not feeling safe in your own home.
Additionally, those who responded that they thought it would take more than a year for life to return to normal or never return to normal were 2.5 times as likely to report “not feeling safe” in their own home.
Refuge, the UK’s largest domestic abuse charity says calls to its Helpline rose by 25% in the second week of lockdown. However domestic abuse, like other factors that might be associated with anxiety, was not observed in this study but would improve the quality of the findings if they could be observed.
Work and the pandemic
Almost 20 million adults said that their work had been affected by the coronavirus, with over 1 in 10 (13.4%) saying that that work was their biggest concern.
People’s working lives have been affected in a range of ways by the pandemic; of those reporting high anxiety, over 1 in 5 said that their work had been affected by being asked to work from home and they were finding working from home difficult, between 10 April and 3 May 20201. Additionally, almost 22% of respondents said work had been affected by being furloughed, in the same period. Further analysis on the relationship between the effect on work and anxiety will be explored in upcoming releases.
Figure 8: Difficulties in working from home was the main way in which work was affected for people experiencing high anxiety
"High anxiety by the question "In the past seven days, how has your work been affected?", Great Britain, 9 April to 3 May 2020
Source: Office for National Statistics - Opinions and Lifestyle Survey %
Notes:
- Question: “In the past seven days, how has your work been affected?”
- Base population for percentage: adults aged 16 years or over who said coronavirus was affecting their work
- Because of low underlying counts for the following responses are excluded from the chart: “Permanent closure of own business”, “Redundancy”, “Asked to take leave”, “Unable to take leave”, “I have to work around other caring responsibilities”.
- The open question “please specify the other ways in which coronavirus (COVID-19) has affected your work” was analysed to find the common themes affecting work for those who answered “Other”, these include: difficulty in socially distancing at work, increased workload and being unable to work because of shielding.
Download this chart Figure 8: Difficulties in working from home was the main way in which work was affected for people experiencing high anxiety
Image .csv .xlsThe odds of reporting high anxiety were 1.5 times as great for respondents who said that the coronavirus was affecting their work than those who did not report that their work was being affected. Average anxiety scores were considerably higher for those who said the coronavirus was affecting their work (4.8 out of 10) compared with those that did not say that their work was being affected (4.0 out of 10), between 3 April and 10 May 2020.
Coronavirus impacting household finances
During the period covered by these data, 30% said their household finances had been affected by the coronavirus. After taking other possible influences on anxiety into account, the odds of reporting high anxiety were 2.2 times as great for those who said they “needed to borrow money or use credit” and 1.7 times as great for those who said their “pension was being affected” than those who did not report that their household finances were being affected in these ways. This will be explored further in upcoming releases.
Access to groceries, medication and essentials
Nearly 40% of people in Great Britain were worried about the affect the coronavirus was having on accessing essentials. Analysis from a recent ONS article Social impacts of COVID-19 on countries and regions of Britain found that Scotland had the fewest people (33%) who struggled to get groceries and toiletries. In comparison, up to 43% of people struggled to get groceries or toiletries in the East of England and the West Midlands.
The experience of struggling to get groceries, medication and essentials was a significant predictor of high anxiety. Those who struggled to get essentials were 1.3 times more likely to report high anxiety than those that did not report this.
Notes for: Coronavirus (COVID-19) specific circumstances associated with high anxiety
- An alternative pooled dataset for the period 10 April and 3 May 2020 was used as this dataset included additional breakdown which was were not available in the larger pooled data between 3 April and 10 May 2020.
8. Significance levels of variables
Figure 9 shows the full odds ratio chart of all 12 variables included in the model that were found to be significantly associated with reporting “high” anxiety. These variables were all significant at the 5% level of significance.
Figure 9: 12 variables were found to be significantly associated with high anxiety
Embed code
Notes:
- Respondents were asked “Overall, how anxious did you feel yesterday?” and answered on a scale of 0 to 10, where 0 is “not at all” and 10 is “completely”. The outcome variable for the regression model is binary whereby high anxiety are those who scored between 6 and 10 and not high anxiety are those who scored between 0 and 5.
- The error bars show the degree of confidence of the estimates, where these cross ‘equally likely’ the estimate is not statistically significantly different from the reference category.
- The 95% confidence intervals highlights the degree of uncertainty around an estimate. Non-overlapping confidence intervals suggest a statistically significant difference between groups.
Table 1 presents all 12 questions in full that were found to be significant predictors of high anxiety using a Chi-squared (likelihood ratio) test, with the associated level of significance.
| Question | P-values | |
|---|---|---|
| And how often do you feel lonely? | <0.001 | |
| Sex | <0.001 | |
| Legal marital status | <0.001 | |
| How safe or unsafe do you feel in your home since the Coronavirus (COVID-19) outbreak? | <0.001 | |
| In which ways is Coronavirus (COVID-19) affecting your life? Responding "Work" | <0.001 | |
| Disability | <0.001 | |
| In which ways is Coronavirus (COVID-19) affecting your life? Responding "Access to essentials" | 0.001 | |
| Age (5 categories) | 0.001 | |
| In the past seven days, how have your household finances been affected? Responding "Pension value affected by economic instability" | 0.010 | |
| In the past seven days, how have your household finances been affected? Responding “Borrow money or use credit" | 0.011 | |
| Country of residence | 0.016 | |
| In the past seven days, which relationships have you been most worried about? Responding "Grandparents" | 0.040 |
Download this table Table 1: Significance levels of all variables in the model
.xls .csvTable 2 below presents all 11 questions in full that were found to be significant predictors of feeling lonely “Often or always” or “Some of the time”, with the associated level of significance.
| Question | P-values | |
|---|---|---|
| To what extent do you agree with the following statement? If I needed help, there are people who would be there for me. | <0.001 | |
| Disability | <0.001 | |
| Age (5 groupings) | <0.001 | |
| Living in a single person household | <0.001 | |
| Legal marital status | <0.001 | |
| What is helping you to cope whilst staying at home? Responding "Work" | <0.001 | |
| What is helping you to cope whilst staying at home? Responding "Gardening" | 0.010 | |
| In which ways is Coronavirus (COVID-19) affecting your life? Responding "Access to essentials" | 0.011 | |
| In which ways is Coronavirus (COVID-19) affecting your life? Responding "Health" | 0.011 | |
| In the past seven days, how have your household finances been affected? Responding "Had to borrow money or use credit" | 0.015 | |
| Sex | 0.015 |
Download this table Table 2: Significance levels of all variables in loneliness model
.xls .csv9. Glossary
Odds ratio
In its simplest form, a binary logistic regression can be interpreted using an “odds ratio”. This is a comparison of the odds of reporting high anxiety for someone with a specified characteristic or circumstance and someone without that specified characteristic or circumstance, whilst controlling for other possible influences of high anxiety.
For example, a female is more than 1.5 times as likely to report high levels of anxiety than a male after controlling for other factors such as age, marital status and loneliness.
Reference group
A reference category is identified as a category within a variable that can be compared with all other categories. The most logical category was chosen for each variable; in some instances this was based on the highest or lowest category within the scale, for example, the youngest age category. In other instances, the most normative population was identified as the reference category; England was chosen as a reference category as it has the largest population of the countries within country of residence, for example.
Where there was not a structured order or a normative population, reference categories were chosen based on the direction of the odds to aid clear interpretation, for example, males were chosen as the reference category as females were more likely to report high anxiety.
Disability
To define disability in this publication, we refer to the Government Statistical Service (GSS) harmonised definition: this identifies as “disabled” a person who has a physical or mental health condition or illness that has lasted or is expected to last 12 months or more that reduces their ability to carry-out day-to-day activities. There are an estimated 13.7 million disabled people in Great Britain according to the latest available estimates.
The GSS definition is designed to reflect the definitions that appear in legal terms in the Disability Discrimination Act 1995 and the subsequent Equality Act 2010.
The GSS harmonised questions are asked of the respondent in the survey, meaning that disability status is self-reported.
Thresholds
For the anxiety question, ratings are grouped differently compared with the other ONS 4 questions to reflect the fact that higher anxiety is associated with lower personal well-being. The ratings for anxiety are grouped as follows:
- 0 to 1 (very low)
- 2 to 3 (low)
- 4 to 5 (medium)
- 6 to 10 (high)
Loneliness
In this release, our definition of loneliness is aligned to the definition used by the Jo Cox Commission and in the Loneliness Strategy for England. This is based on a definition first suggested by Perlman and Peplau in 1981: “A subjective, unwelcome feeling of lack or loss of companionship. It happens when we have a mismatch between the quantity and quality of social relationships that we have, and those that we want.”
Lockdown
Lockdown is the shutting down of all non-essential activities to slow the spread of the coronavirus (COVID-19). In the UK, this has seen strict limits imposed on daily life, including:
- people ordered to only leave the house for essentials such as food, medicine, exercise or to care for a vulnerable person
- the closure of non-essential shops
- the banning of gatherings of more than two people
The UK lockdown was applied on 23 March 2020. This has formed the basis for each nation's stay-at-home guidance. Specific stay at home guidance for England, Scotland, Wales and Northern Ireland is available. During the period covered in this release, all countries of the UK remained in lockdown but the data in this release only cover England, Scotland and Wales.
Statistical significance
In reference to the statistical significance of variables in a regression model, the level of significance (also known as a p-value) tests the null hypothesis that the coefficient has no association with high anxiety. A low p-value (for example, p-value less than 5%) indicates that you can reject the null hypothesis and be confident in concluding there is an association between the variable and high anxiety. The six variables highlighted in Figure 2 were identified as the most strongly associated factors as their p-values were less than 1%, which provides even stronger evidence to reject the null hypothesis.
In addition, many figures also show confidence intervals, statistical significance of differences can also be determined based on non-overlapping confidence intervals.
Back to table of contents10. Strengths and limitations
Measuring anxiety
Respondents are asked “On a scale where 0 is not at all anxious and 10 is completely anxious, overall, how anxious did you feel yesterday?”. For the purpose of the regression analysis, responses from the anxiety question were converted to a binary variable where scores from 6 to 10 indicate “high anxiety” and 0 to 5 indicates “not high anxiety”.
For more information on personal well-being, please see the Personal well-being user guidance and Harmonised principles of personal well-being.
Pooling data from the Opinions and Lifestyle Survey
Statistics in this release have been taken from five waves of the Opinions and Lifestyle Survey (OPN), a monthly omnibus survey. In response to the coronavirus (COVID-19) pandemic, we have adapted the OPN to become a weekly survey used to collect data on the impact of the coronavirus on day-to-day life in Great Britain.
The statistics in this article are based on a combined dataset that combines five rounds of data collection by the OPN, providing survey data from 6,430 adults surveyed between 3 April and 10 May 2020 (whole reference period is during lockdown). Using the pooled dataset allows us to produce detailed analysis considering the association between loneliness, for example, and high anxiety while controlling for multiple other personal characteristics and circumstances, which also have a significant impact on high anxiety. By pooling data, we have improved the sample size allowing us to consider more variables in the model with smaller breakdowns of individual questions at the expense of having to report on a wider time period (five weeks rather than one week).
Survey responses were collected using an online self-completion questionnaire, with the option to take part over the phone.
Strengths and limitations of the data from the Opinions and Lifestyle Survey
The main strengths of the Opinions and Lifestyle Survey (OPN) pooled dataset include:
- timely production of data and statistics that can respond quickly to changing needs
- meets data needs: the questionnaire is developed with customer consultation, and design expertise is applied in the development stages
- robust methods are adopted for the survey’s sampling and weighting strategies to limit the impact of bias
- quality assurance procedures are undertaken throughout the analysis stages to minimise the risk of error
- pooled data with a large sample size allows for in-depth and robust regression analysis providing information on those most vulnerable to high levels of anxiety taking into consideration many personal characteristics and individual circumstances
The main limitations of the Opinions and Lifestyle Survey (OPN) pooled dataset include:
- from pooling data across five waves some week-on-week changes may be masked
More quality and methodology on strengths, limitations, appropriate uses, and how the data were created is available in Coronavirus and the impacts on Great Britain and the Opinions and Lifestyle Survey QMI.
Uncertainty and quality
The statistics presented are estimates and as with all estimates, there is a level of uncertainty associated with them. Where available, 95% confidence intervals have been shown. These show the range within which we would expect the true value to lie for 95 out of every 100 samples drawn at random from the population. Wide confidence intervals, often associated with small sample sizes or large sample variance, indicate a wider range of values within which we would expect the true value to lie.
In many cases, sample sizes for specific groups are small and confidence intervals are large and overlap with one another. This makes it difficult to make robust comparisons between groups. Only statistically significant differences, as defined in this section, are commented on in this release.
Throughout this release, comparisons are only made between estimates where they are statistically significant. A finding is said to be “statistically significant” if it is unlikely to have occurred by chance if there is actually no underlying difference between the groups; statistical significance at the 5% level means we would expect to observe a finding as extreme just 5% of the time. This method has the limitation that some estimates with overlapping confidence intervals will not be flagged as being significantly different from one another, even though they would have been had a formal null hypothesis statistical test been carried out.
Because of the uncertainty inherent in working with a sample instead of the full population, it is inevitable that sample-based estimates will occasionally be flagged as significantly different from one another, when in reality there is no difference between the corresponding values in the population; such findings are known as “false-positives”. If we were able to repeatedly draw different samples from the population then, for a single comparison made in our analysis, we would expect 5% of the statistically significant findings to be false-positives. However, if multiple comparisons are conducted, as is the case in this article (because for each health outcome we compare the estimates for every pair of religions), then the probability of making at least one false-positive inference will generally be greater than 5%.
Back to table of contents11. Quality and methodology
Regression technique used
A binary logistic regression was carried out to assess which personal characteristics and circumstances have the strongest association with personal well-being. The response variable is binary where a respondent either has “high anxiety” (respondent scores between 6 and 10 when responding on a scale of 0 to 10 on how anxious they felt) or “not high anxiety” (respondent scores between 0 and 5).
Assessing goodness of fit
Goodness of fit describes how well a model fits the data from which it was generated. Nearly 200 variables were taken into consideration when trying to find the model with the best fit. This consisted of adding variables to the model in an iterative approach assessing the goodness of fit and change in the coefficients when new variables were added. The results of this approach meant there were 12 variables in total that showed a significant association at the 5% level with high anxiety. Results presented in Figure 2 are the six most strongly associated factors (at the 0.1% level) affecting high levels of anxiety between 3 April and 10 May 2020. The full regression model including all 12 variables can be found in the Section 8.
Weighting
The pooled dataset is weighted to reflect the size and composition of the population in Great Britain. Weights were first adjusted for non-response and attrition, then calibrated to satisfy population distributions considering the following factors: sex by age, county or region, tenure, highest qualification, employment status, National Statistics Socio-economic group Classification (NS-SEC) group and smoking status. For age, sex and geography, totals based on projections of mid-year population estimates for April 2020 were used. The resulting weighted sample is therefore representative of the Great Britain adult population by a number of socio-demographic factors and geography.
Missing data
Missing data can produce biased estimates and invalid conclusions, particularly if the data are not “missing at random” or, in other words, if there is some pattern to the missingness. Where data have been found to be missing at random they have been omitted from the analysis. Other cases where the data are not missing at random data have been recoded and regrouped into not applicable where appropriate.
Limitations of the regression model
We were unable to assess the relationship between homeschooling and anxiety levels. The reason for this is the large number of missing responses to the homeschooling questions and they are not missing at random, they were simply not asked the question as they do not have dependent children. If we omitted these people, it would cause large bias to the model and decrease the overall sample size and consequently would have a worse model. The alternative of coding these individuals as not applicable was also unsuccessful because of the disproportionate numbers of people who this question was not applicable for therefore skewing the results of the regression.
Additionally, it is worth noting that the analysis is limited to only those variables that were collected in the survey. There are likely to be factors that are associated with anxiety that were not observed in this study but would improve the model fit if they could be observed, collected and analysed. An example of this is a variable on domestic abuse.
While the pooled dataset does allow for larger sample size and enables a detailed regression model, it also comes with the limitation that it hides week-on-week variation that we would see from looking at one wave of data.
Even when using pooled data, some of the underlying counts were too small to get the granular detail desired from the regression model. A threshold number for underlying counts was applied to highlight when there was a need to omit variables or group them where necessary.
Back to table of contentsContact details for this Article
qualityoflife@ons.gov.uk
Telephone: +44 1633 455044 or +44 1329 444256