1. Main points
In 2016 to 2017, there were 5% of adults in England who reported feeling lonely “often” or “always”.
Younger adults aged 16 to 24 years reported feeling lonely more often than those in older age groups.
Women reported feeling lonely more often than men.
Those single or widowed were at particular risk of experiencing loneliness more often.
People in poor health or who have conditions they describe as “limiting” were also at particular risk of feeling lonely more often.
Renters reported feeling lonely more often than homeowners.
People who feel that they belong less strongly to their neighbourhood reported feeling lonely more often.
People who have little trust of others in their local area reported feeling lonely more often.
Three profiles of people at particular risk from loneliness were identified:
Widowed older homeowners living alone with long-term health conditions.
Unmarried, middle-agers with long-term health conditions.
Younger renters with little trust and sense of belonging to their area.
2. Things you need to know about this release
The Prime Minister recently announced the development of a strategy to alleviate loneliness in response to the report of the Jo Cox Commission on Loneliness (PDF, 2.56MB) published in December 2017. As part of this, she requested that Office for National Statistics (ONS) develops national measures of loneliness. ONS is now working with a cross-government group, charities, academics and other stakeholders to review the measurement of loneliness and publish recommendations on this later this year.
This publication is based on data collected for the Community Life Survey (CLS) between August 2016 and March 2017. The survey asked people living in England: “How often do you feel lonely?” with the following response categories: “often/always”, “sometimes”, “occasionally”, “hardly ever” and “never”. The analysis presented here is based on this question. The survey was selected for analysis because it asked respondents about how often they experience loneliness and about other aspects of their lives – this article is focused on the frequency of loneliness rather than degree of loneliness.
The focus of this article is on identifying personal characteristics and circumstances that increase or reduce the likelihood of experiencing loneliness. We also present profiles of loneliness – collections of personal characteristics that can put people at greater or lesser risk of loneliness. This could be used to target support more effectively towards people who are at greater risk of feeling lonely more often.
To improve statistical quality, for the logistic regression and the cluster analysis, those who reported feeling lonely “often/always”, “sometimes” or “occasionally” are classified as “more often lonely” whilst those who reported “hardly ever” or “never” feeling lonely are classified as “hardly ever or never lonely”. Please see the accompanying technical report for further details.
The statistical significance of differences noted within the release are based on non-overlapping 95% confidence intervals.
Back to table of contents3. Who is lonely more often?
Initially descriptive analysis was carried out to shed light on how personal characteristics and circumstances are associated with self-reported loneliness.
Figure 1 shows that in 2016 to 2017, there were 5% of adults (aged 16 years and over) in England reporting feeling lonely “often/always” – that’s 1 in 20 adults. Furthermore, 16% of adults reported feeling lonely sometimes and 24% occasionally.
Figure 1: Reported frequency of loneliness in adults
England
Source: Community Life Survey, August 2016 to March 2017
Download this chart Figure 1: Reported frequency of loneliness in adults
Image .csv .xlsWomen report experiencing loneliness more often than men
Women reported feeling lonely more frequently than men. They were significantly more likely than men to report feeling lonely “often/always”, “some of the time” and “occasionally” and were much less likely than men to say they “never” felt lonely (Figure 2).
It is possible that this may reflect in part differences in how men and women reflect on their personal experiences of loneliness or respond to the question. Some research suggests that men may be more reluctant than women to report undesirable feelings such as loneliness1,2.
Figure 2: Reported frequency of loneliness by sex
England

Source: Community Life Survey, August 2016 to March 2017
Download this image Figure 2: Reported frequency of loneliness by sex
.png (24.3 kB) .xlsx (10.4 kB)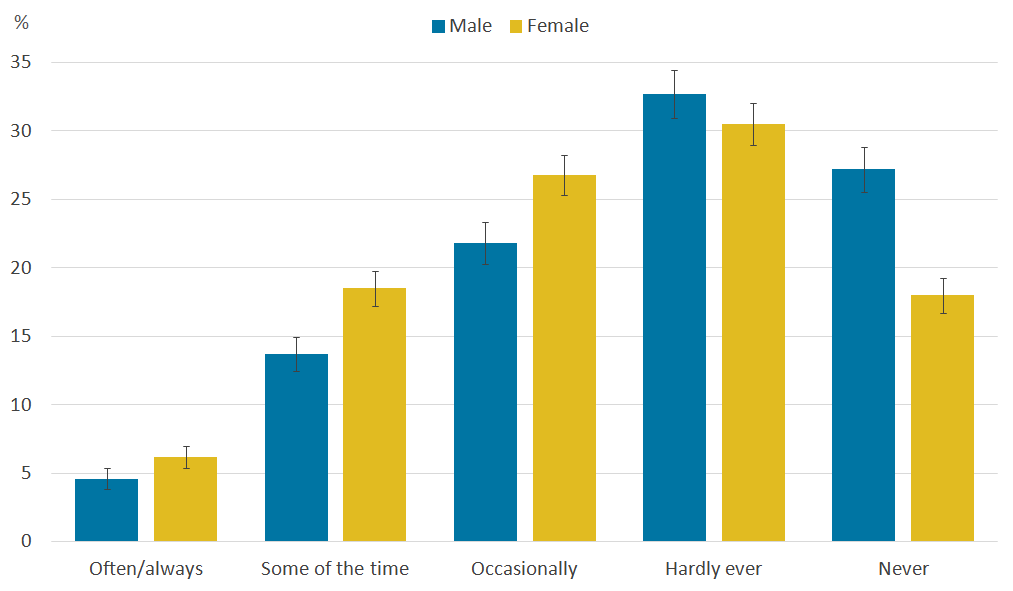
Younger adults report experiencing loneliness more often
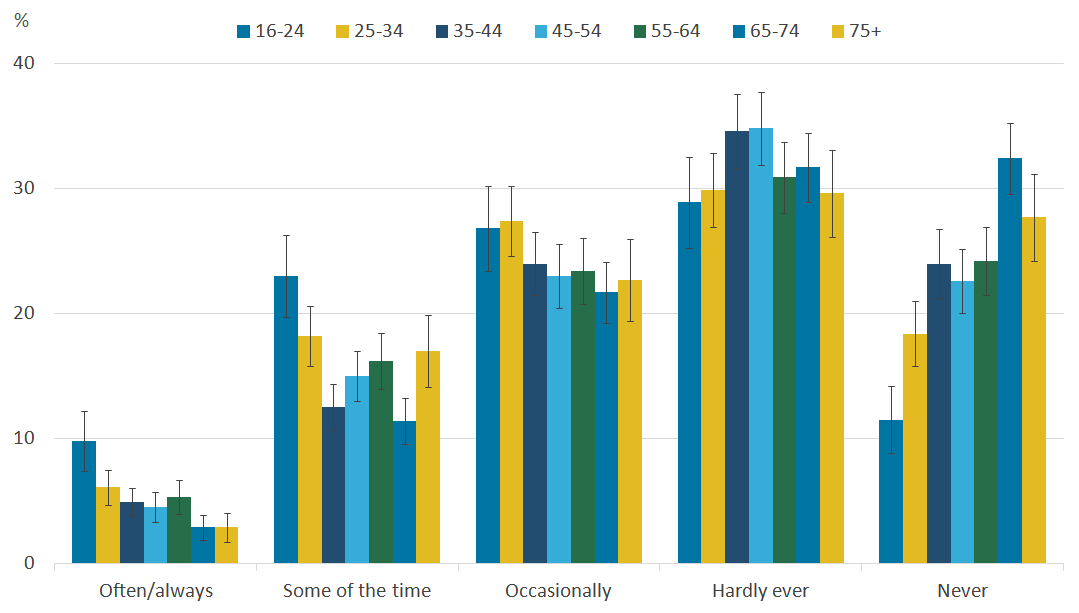
Compared with all other age groups except the 25 to 34 years group, those aged 16 to 24 years were significantly more likely to report feeling lonely “often/always”. Those aged 16 to 24 years were also significantly more likely to report feeling lonely “some of the time” compared with all other groups except for the 25 to 34 years and 75 years and over age groups. They were also least likely of all age groups to report “never” experiencing loneliness (Figure 3).
Figure 3: Reported frequency of loneliness by age group
England
Source: Community Life Survey, August 2016 to March 2017
Download this image Figure 3: Reported frequency of loneliness by age group
.png (43.0 kB) .xlsx (11.4 kB)
Those widowed report experiencing loneliness more often
Those who were widowed were significantly more likely to report feeling lonely “some of the time” and least likely to report “never” experiencing loneliness compared with other marital groups.
By contrast, people who were married or in a civil partnership were significantly less likely to report experiencing loneliness “often/always”, “some of the time” or “occasionally”. Consistent with this, those married or in a civil partnership were found to be significantly more likely to report feeling lonely “hardly ever” and “never” (Figure 4).
Figure 4: Reported frequency of loneliness by marital status
England

Source: Community Life Survey, August 2016 to March 2017
Notes:
Married or civil partnership does not include those who reported being separated.
Separated includes people who are legally married but reported being separated.
Download this image Figure 4: Reported frequency of loneliness by marital status
.png (39.2 kB) .xlsx (10.9 kB)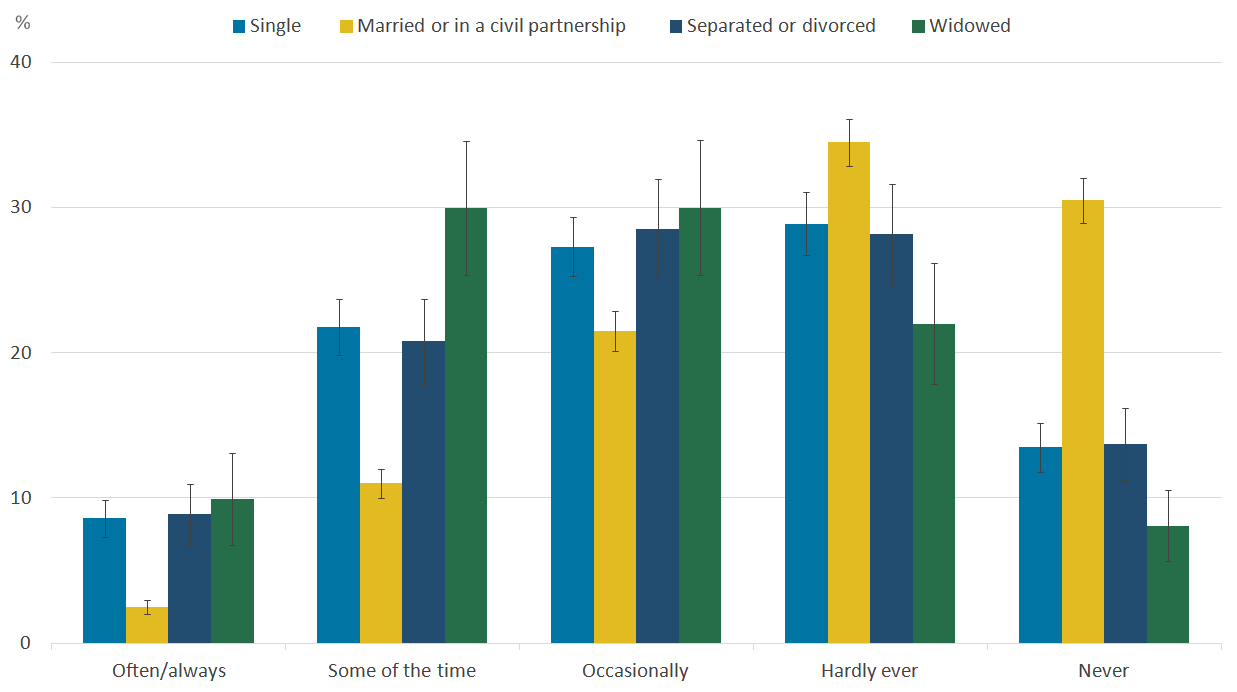
Those with poorer health report experiencing loneliness more often
Those who reported their general health to be “very bad” or “bad” were significantly more likely to report feeling lonely “often/always” and significantly less likely to say they “hardly ever” felt lonely compared with all other groups.
People who said their general health was “very good” or “good” were significantly less likely to report feeling lonely “often/always” or “some of the time” and significantly more likely to report “hardly ever” or “never” feeling lonely compared with all other groups (Figure 5).
Figure 5: Reported frequency of loneliness by general health
England

Source: Community Life Survey, August 2016 to March 2017
Download this image Figure 5: Reported frequency of loneliness by general health
.png (35.7 kB) .xlsx (11.1 kB)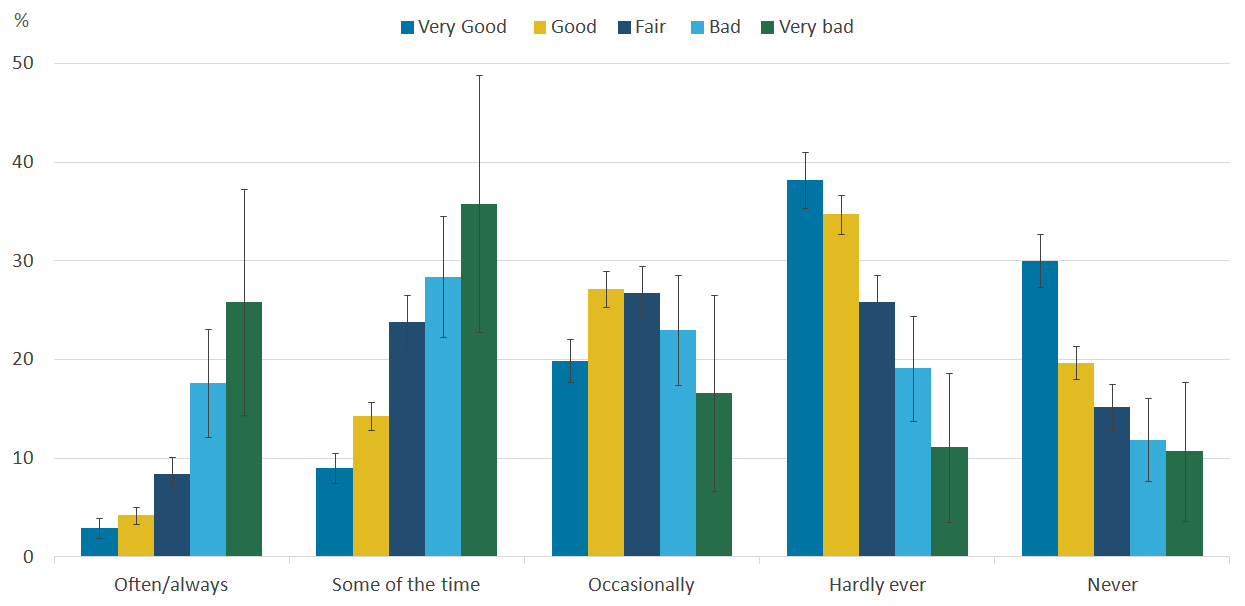
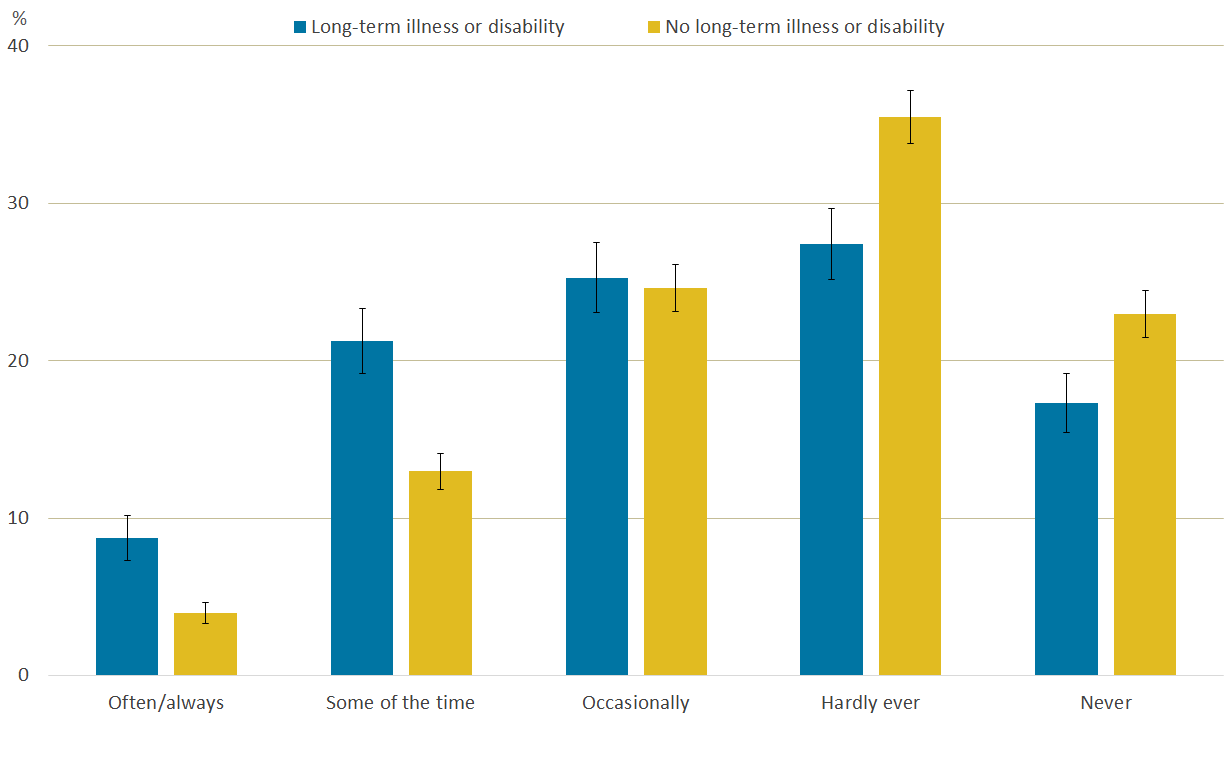
Those with a long-term illness or disability report experiencing loneliness more often
Those who reported having a long-term illness or disability were significantly more likely to report feeling lonely “often/always” and “some of the time”. Those who did not have an illness or disability were significantly more likely to say that they “hardly ever” or “never” felt lonely (Figure 6).
Figure 6: Reported frequency of loneliness by presence of a long-term illness or disability
England
Source: Community Life Survey, August 2016 to March 2017
Download this image Figure 6: Reported frequency of loneliness by presence of a long-term illness or disability
.png (31.0 kB) .xlsx (11.6 kB)
Please note: 4 May 2018, 9:00 am
The text for Figure 6 was changed to remove ‘limiting’ for clarity. Figure 6 data relates to a survey question which did not ask whether their condition was limiting. Where ‘limiting’ is used elsewhere in this article it relates to a survey question where respondents were asked explicitly about a condition they felt was limiting. The data remains unchanged.
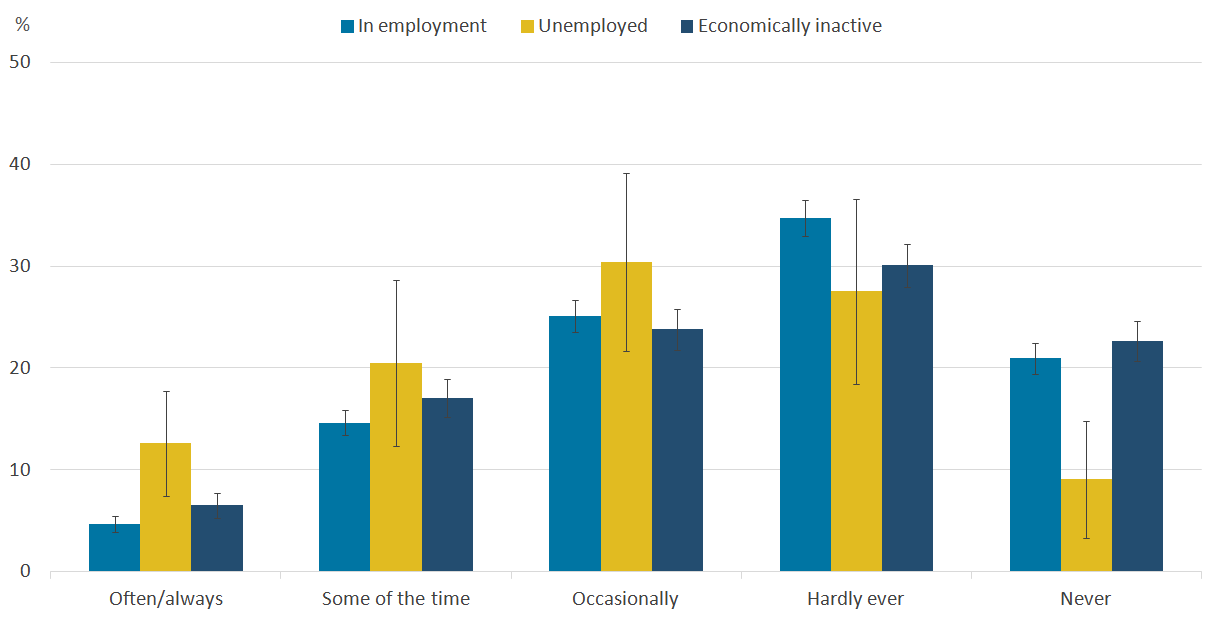
Unemployed people report being lonely more often
People who were unemployed (and seeking work) were significantly more likely to report loneliness “often/always” than those in employment or self-employment. Those in employment were significantly more likely to say they “hardly ever” feel lonely than those who were economically inactive (Figure 7). People who are considered “economically inactive” include those not in employment or seeking work, including retirees.
Figure 7: Reported frequency of loneliness by employment status
England
Source: Community Life Survey, August 2016 to March 2017
Download this image Figure 7: Reported frequency of loneliness by employment status
.png (25.6 kB) .xlsx (9.5 kB)
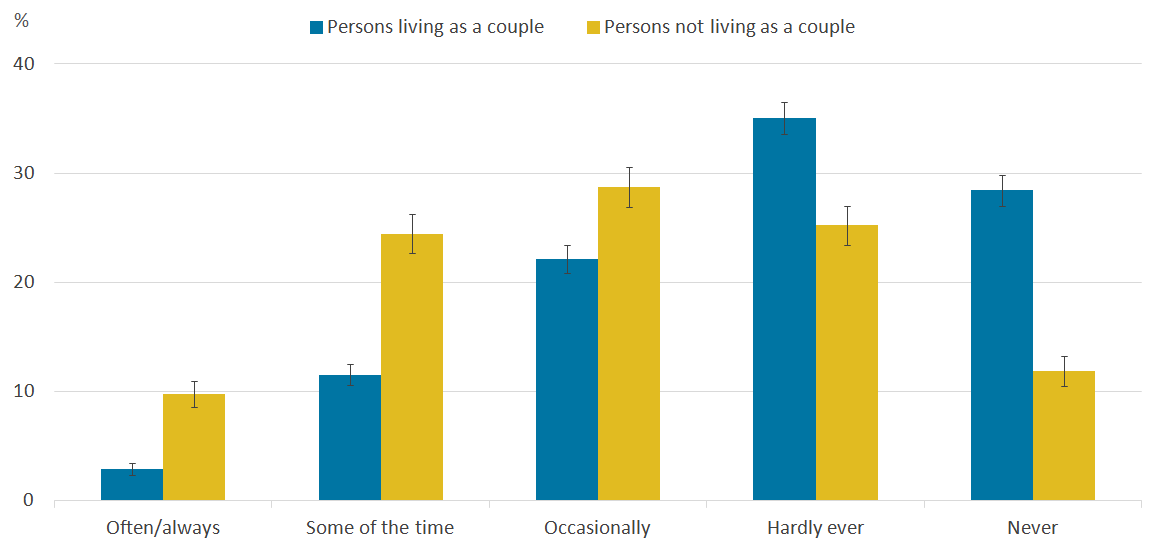
People living as a couple are lonely less often
People who were not living as part of a couple were signficantly more likely to report experiencing loneliness “often/always”, “some of the time” or “occasionally” than those who reported living as part of a couple. People who reported living as a couple were significantly more likely to report feeling lonely “hardly ever” or “never” (Figure 8).
Figure 8: Reported frequency of loneliness by living as a couple or not
England
Source: Community Life Survey, August 2016 to March 2017
Download this image Figure 8: Reported frequency of loneliness by living as a couple or not
.png (21.3 kB) .xlsx (10.4 kB)
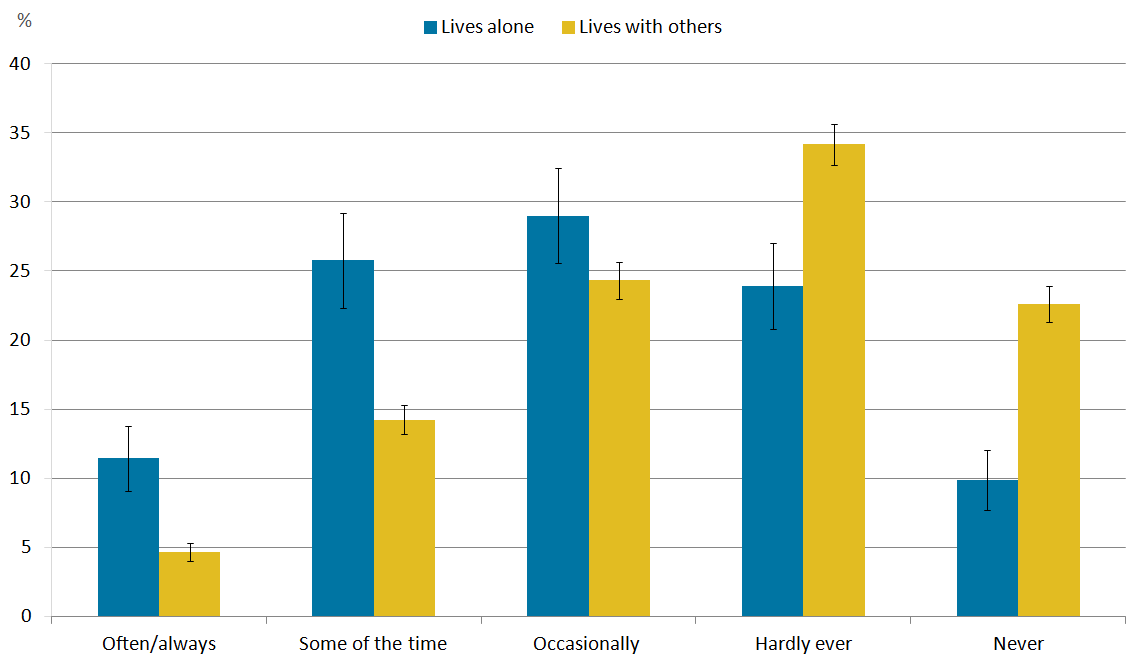
Living alone or with others
People who live alone are at greater risk of feeling lonely more often. Those living alone were significantly more likely to report loneliness “often/always” and “some of the time” whilst those living with others were significantly more likely to report “hardly ever” or “never” feeling lonely (Figure 9).
Figure 9: Reported frequency of loneliness by living with others or with others
England
Source: Community Life Survey, August 2016 to March 2017
Download this image Figure 9: Reported frequency of loneliness by living with others or with others
.png (25.2 kB) .xlsx (10.4 kB)
Renters report feeling lonely more often
Renters were significantly more likely to report loneliness “often/always” and “some of the time” than those who own their home. People who own their home were significantly more likely to report “hardly ever” or “never” experiencing loneliness (Figure 10). Homeowner households tend to have greater financial wealth and average annual household income is greater for those in owner occupied homes than those in rented homes. It may not be housing tenure in itself that is associated with how often people feel lonely but financial security.
Figure 10: Reported frequency of loneliness by tenure
England

Source: Community Life Survey, August 2016 to March 2017
Notes:
- ‘Homeowner’ includes own outright, buying with a mortgage or loan, and part buy/part rent.
Download this image Figure 10: Reported frequency of loneliness by tenure
.png (20.3 kB) .xlsx (10.4 kB)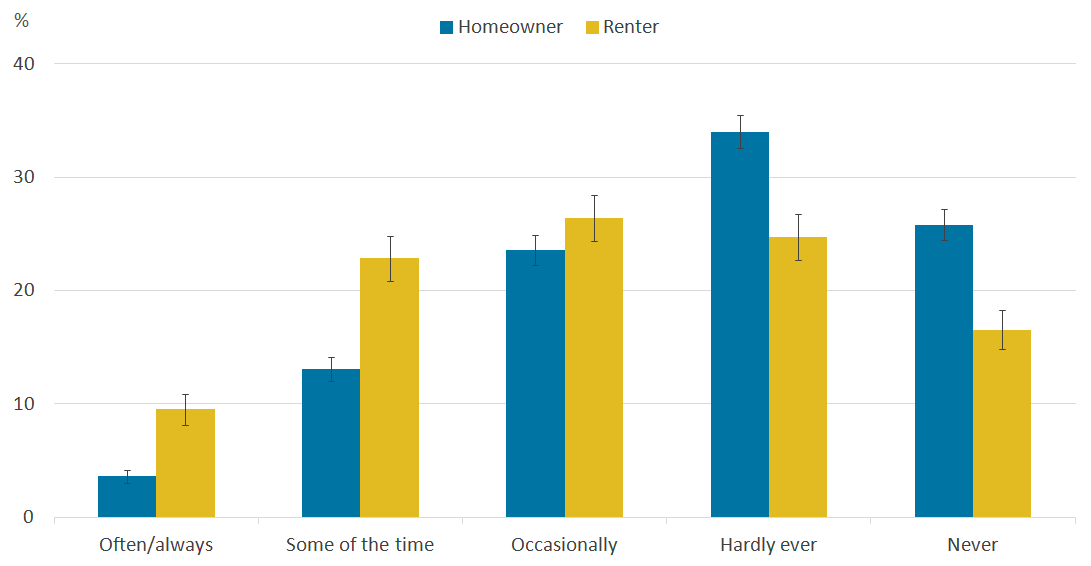
People who feel they belong to their neighbourhood less strongly report feeling lonely more often
Those who felt a sense of belonging to their neighbourhood “not very strongly” or “not at all strongly” were significantly more likely than those with a stronger sense of belonging to report experiencing loneliness “often/always”. This suggests those who feel they belong to their neighbourhood less strongly are at greater risk of loneliness (Figure 11).
Figure 11: Reported frequency of loneliness by strength of belonging to neighbourhood
England

Source: Community Life Survey, August 2016 to March 2017
Download this image Figure 11: Reported frequency of loneliness by strength of belonging to neighbourhood
.png (25.8 kB) .xlsx (10.7 kB)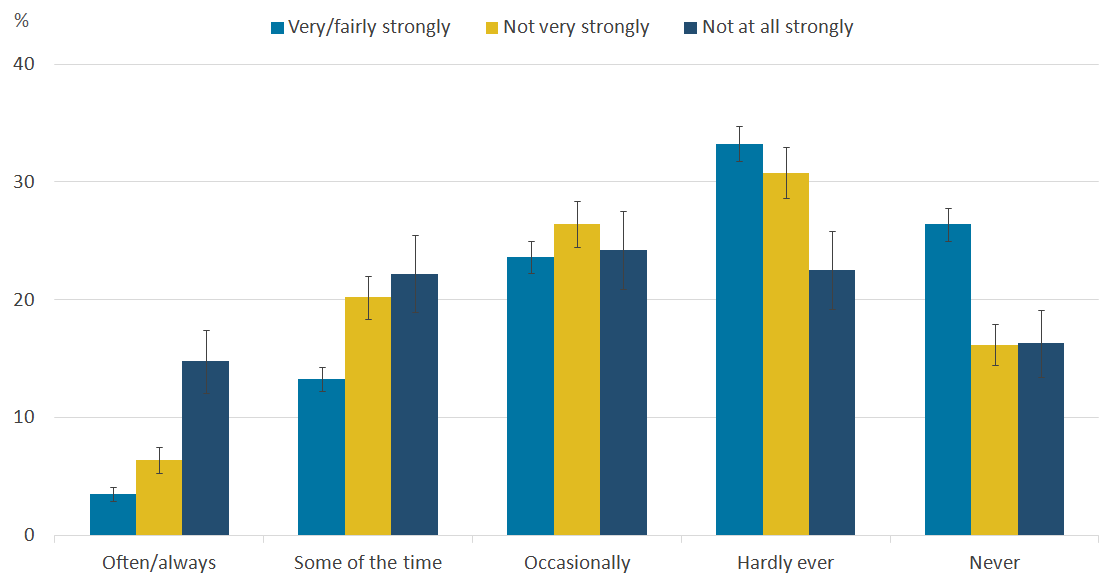
People less satisfied with their local area report feeling lonely more often
Those who reported being “neither satisfied nor dissatisfied” or “fairly/very dissatisfied” with their local area as a place to live were significantly more likely to report feeling lonely “often/always”. Consistent with this, those who reported feeling “very satisfied” with their local area were significantly more likely to report “never” feeling lonely (Figure 12).
Figure 12: Reported frequency of loneliness by satisfaction with local area as a place to live
England

Source: Community Life Survey, August 2016 to March 2017
Download this image Figure 12: Reported frequency of loneliness by satisfaction with local area as a place to live
.png (37.8 kB) .xlsx (10.9 kB)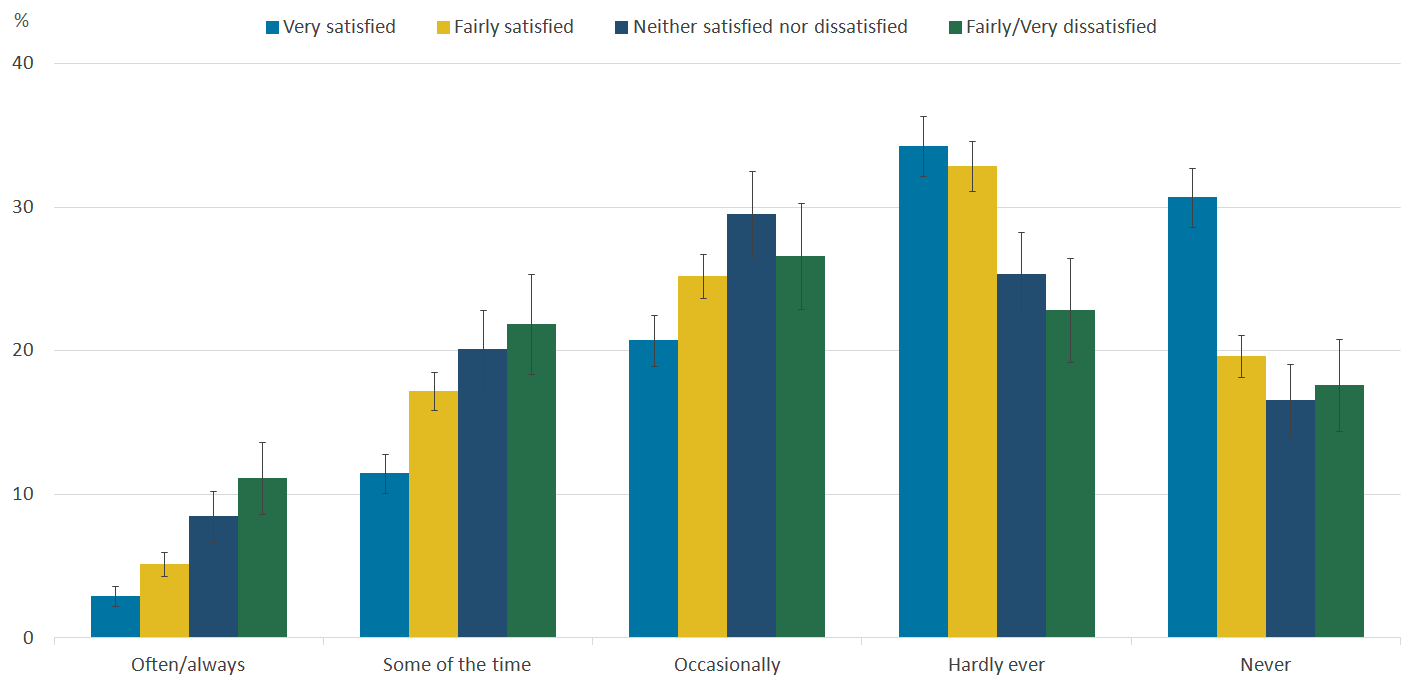
Notes for: Who is lonely more often?
Borys, S., and Perlman, D. (1985). Gender differences in loneliness. Personality and Social Psychology Bulletin, 11(1), pages 63 to 74.
Nicolaisen, M., and Thorsen, K. (2014). Who are lonely? Loneliness in different age groups (18 to 81 years old), using two measures of loneliness. The International Journal of Aging and Human Development, 78(3), pages 229 to 257.
4. Which factors independently affect loneliness?
In order to understand more about how each of these personal characteristics and circumstances contribute to loneliness, logistic regression has been used in the analysis reported in this section. This is an analytical technique that works by focusing on one factor at a time, while holding others constant so the effect of specific characteristics and circumstances can be assessed.
In reality, individuals will have a number of characteristics that could increase or decrease the chances of them feeling lonely and so it can be difficult to identify the underlying causes of loneliness, or alternatively, what keeps people from feeling lonely. Using this technique, it is possible to isolate the different effects of each characteristic or circumstance on reported loneliness.
All factors reported in this section have a statistically significant link with loneliness (that is, we are confident these findings are robust and not just due to random variability in the survey estimates). Regression analysis can identify relationships between factors, however, it cannot tell us about causality. For a full description of how we carried out the analysis, see the accompanying technical report.
Of the 34 characteristics and circumstances included in this analysis, 13 were found to have an impact on loneliness, including:
- age
- sex
- marital status
- respondent and partners’ (if applicable) gross income
- disability status (self-reported)
- general health (self-reported)
- number of adults in the household
- caring responsibilities
- whether chat to neighbours more than to just say hello
- feeling as though you belong to a neighbourhood
- satisfaction with local area as a place to live
- the number of years lived in local neighbourhood
- how often meet up in person with family members or friends
When all other factors are held constant, the likelihood of reporting feeling lonely more often tends to decrease with age. The 25 to 34 years, 65 to 74 years and 75 years and over age groups were all significantly less likely to be lonely more often than the 16 to 24 years age group.
Those aged 75 or over are 63% less likely to report loneliness than those aged 16 to 24 years. This pattern was also noted in the previous section but is more prominent here after holding other factors constant related to both age and loneliness such as becoming a widow or having a disability.
There could be different explanations for this. For example, it’s possible that people become more resilient to loneliness as they get older, possibly through the experience of significant life events and life transitions. On the other hand, some research evidence shows that loneliness is associated with poorer life expectancy. A study conducted in 2015 found that loneliness is related to an increased mortality risk of 26% (after adjusting for age, gender, socio-economic status and pre-existing health conditions). This might mean that people who are lonelier also live shorter lives and are therefore less likely to be represented among the older population.
Health and disability are strongly related to loneliness. A 2017 study shows that 67% of disabled people have felt lonely in the past year. The logistic regression shows that those with a long-term health condition or disability were 56% more likely to report loneliness than those without. Similarly, those who describe their general health as “fair”, “bad” and “very bad” were 88% more likely to say they feel lonely than those with “good” and “very good” health. It is, however, important to remember that the relationship between health and loneliness could be reciprocal – with poorer health or disability influencing the experience of loneliness as well as loneliness influencing poorer health and disability. For example, Lund and others (2010) argue that lonely individuals are also at higher risk of the onset of disability.
Those who have caring responsibilities were found to be 37% more likely to report loneliness than those who do not. Research by Carers UK (2015) found that 57% have lost touch with family and friends as a result of their caring role, over a third (36%) feel uncomfortable talking to friends about caring, and 49% have experienced difficulties in their relationship with their partner because of their caring role; all three of these aspects have been highlighted as related to loneliness within this research.
Social connections are an important aspect of loneliness and the results here clearly show that communications with friends, family and neighbours, as well as feelings of belonging to and satisfaction with local area are associated with loneliness. Those who said they meet up with friends and family less often also reported higher levels of loneliness. Those who see friends and family less than once a month or never were 84% more likely to be lonely than those who meet up with friends and family daily. Additionally those who never chat to their neighbours were 43% more likely to feel lonely than those who do.
Please note: 16 April 2018, 8:00am
The paragraphs above were changed for clarity, the logistic regression results in this section have been amended to read ‘x% less/more likely’ rather than ‘x times less/more likely’. The figures are otherwise unchanged.
It is important to remember that logistic regression is good for identifying which specific characteristics and circumstances are most strongly related to loneliness. However, in reality, individuals experience a combination of different characteristics and circumstances in their lives and how these come together may be particularly relevant to the perception of loneliness. We’ve undertaken latent class analysis (LCA) as well to explore this in further detail.
Back to table of contents5. Profiles of loneliness
Latent class analysis (LCA) is a statistical technique used to group individuals with similar patterns of characteristics including reported experience of loneliness (for more information please see the accompanying technical report). The LCA results identify sets of characteristics that predict how often people report feeling lonely.
We’ve found four distinct profiles of loneliness: three with sets of characteristics and circumstances found to put people at greater risk of feeling lonely more often and a fourth found to reduce this risk. Indicator variables included in the LCA model were:
- marital status
- general health
- long-term physical or mental health conditions
- living alone or with others
- housing tenure
- age group
Having produced profiles based on these characteristics, these were then analysed in terms of additional variables to find out more about the groups. These variables included in the LCA model were:
- sex
- whether or not in paid work
- living as a couple or not
- personal well-being scores for life satisfaction, happiness, anxiety and worthwhile
- economic status (in employment, unemployed or economically inactive)
- whether or not a long-term limiting illness or disability is reported
- strength of belonging to neighbourhood
- trust in others living in neighbourhood
- level of deprivation in area in which they live based on the English Index of Multiple Deprivation 2015 (Lower layer Super Output Area)
What are the combined characteristics of the most lonely people?
Three sets of characteristics were found to be associated with greater risk of feeling lonely more often.
Widowed older homeowners living alone with long-term health conditions
Older widowed homeowners who live alone and have long-term health conditions were particularly likely to report feeling lonely more frequently. The people in this group tended to be:
- widowed
- in worse general health
- living alone
- homeowners
- aged 65 years or older
- have a long-term physical or mental health condition
Of all individuals in this group 69% reported that they felt lonely “occasionally” or more frequently. This compared with 46% in the sample overall who reported feeling lonely as frequently.
On further examination, people in this group were predominantly:
- female
- not in paid work and economically inactive; given their age likely to be retired
- better-off financially than the sample average; as well as being homeowners, 62% of this group live in the 50% least deprived areas
- in terms of personal well-being scores, mean scores for this group are similar to, though marginally worse than the average for the entire sample
Unmarried, middle-agers, with long-term health conditions
At even greater risk of feeling lonely more often were unmarried middle-agers also with long-term health conditions. People in this group were characterised as:
- single (never married), separated, or divorced
- living alone but more likely to be renting than owning their own home
- reporting a long-term physical or mental health condition
- unlikely to describe their general health as “very good” or “good” (and so have “very bad” to “fair” health)
- aged 35 to 64 years
In this group 81% of individuals reported that they felt lonely “occasionally” or more frequently, compared with 46% of the sample overall.
Further examination of this group showed that they tended to be:
- less likely to be in paid work
- more likely to be unemployed or economically inactive
- much more likely to report a long-term illness or disability described as “limiting”
- worse off financially than the sample average; 69% of this group live in the 50% most deprived areas
- in terms of personal well-being scores, mean scores for this group are substantially worse than the means for the overall sample and the other loneliness profile groups
Younger renters with little trust and sense of belonging to their area
One younger group were identified as experiencing loneliness more often. Respondents in this group were characterised as:
- single, separated, or divorced
- living with others
- renting
- in “good” or “very good” health without any long-term health conditions or disabilities
- aged 16 to 34 years
In this group 61% of individuals reported that they felt lonely “occasionally” or more frequently, compared with 46% of the sample overall.
Further examination of this group showed that they tended to be:
- likely to be in paid work
- living as a couple (53%) (suggesting that although their marital status indicated being single, just over half were cohabiting)
- without a strong sense of belonging to their neighbourhood; 55% reported feeling that they belonged to their neighbourhood “not very strongly” or “not at all”, compared with 38% in the sample overall
- have little trust of others living in their neighbourhood; only 25% reported feeling that “many” living in their neighbourhood can be trusted, compared with an average of 45%
- worse off financially; as well as being renters, 70% of this group live in the 50% most deprived areas or neighbourhoods
Comparisons between the loneliness profile groups
Common to two of the loneliness profile groups was the experience of having a long-term health condition or disability. It is possible that health problems or disability may be factors in the greater frequency of reported loneliness in these groups.
Of the Widowed older homeowners living alone with long-term health conditions group, 65% reported having long-term physical or mental health problems and 53% reported having a long-term illness or disability that was “limiting”. This compares with 33% and 22% in the sample overall respectively. To some extent this may be unsurprising given the higher age of this group. However, for the Unmarried, middle-agers with long-term health conditions group, despite being younger and so at lesser risk of age-related health conditions, a greater proportion reported health problems and described these as “limiting”. A very high proportion (90%) of this group reported having long-term physical or mental health problems and 79% described a long-term illness or disability that was “limiting”.
This analysis, however, emphasises that those in good health and without disability can also be at risk of experiencing loneliness as illustrated by the other often lonely profile group who were younger and in good health without limiting illness or disability.
Our analysis also highlights that people can experience loneliness at any age, though there are different circumstances and characteristics associated with loneliness at different ages.
People who rent rather than owning their homes were prominently represented among two of the loneliness profile groups. Our earlier analysis also found that those who rent their home report loneliness more frequently than those who own their homes. We have not differentiated between renting private or social housing and cannot be sure whether this finding reflects different financial positions among those who rent and own, or whether it may be possibly related to differences in a sense of belonging to their local area. However, the group we’ve described as Widowed older homeowners living alone with long-term health conditions emphasises that those better off financially can also be at risk of loneliness given their other circumstances (for example, widowhood).
Characteristics of the least lonely profile group
This analysis so far has focused on the characteristics and circumstances of those most lonely, however, one group were also identified who were least lonely.
Married homeowners in good health living with others
The characteristics of this group are:
- living with a partner in a marriage or civil partnership
- better general health
- own their own home
- do not live alone
- are aged 35 years or older (though skewed more towards 65 years and over)
Only 15% of individuals in this group reported that they felt lonely “occasionally” or more frequently, compared with 46% of the sample overall.
This group tended to be:
- male (61%)
- living as a couple (99%)
- with a strong sense of belonging to their neighbourhood; 79% reported that they felt they belonged to their neighbourhood “very” or “fairly strongly”, compared with 62% of the sample overall
- substantially better off in terms of well-being scores than all other loneliness profile groups and the sample means
- in terms of economic activity status, none were unemployed, 15% were in employment and 85% were economically inactive; the data indicate that most were economically inactive because they were retirement age or above
This set of characteristics might be more protective in terms of loneliness.
Back to table of contents