Table of contents
- Introduction
- Cohort component method
- Births
- Deaths
- Internal migration
- International migration
- Home armed forces
- Foreign armed forces
- Prisoners
- Compilation
- Quality assurance of administrative data reports
- Understanding the impact of changes to internal migration methods
- Summary of historical methods
- Historical geography changes – 2009 to 2021
- Cite this methodology
1. Introduction
This methodology describes the methods used to produce the national, regional and local authority population estimates for mid-2021 for England and Wales. These estimates are based on the 2021 Census, updated to account for population change in the period between Census Day (21 March) and the mid-year point (30 June). The production of mid-2021 population estimates have taken the 2021 Census estimates and rolled them forward to 30 June 2021 by accounting for population ageing, births, deaths, and internal and international migration. These methods for estimating population change in the three-month period between Census Day and mid-year are adapted from the standard methods used to estimate population change in non-census years.
Population estimates for England and Wales
Ordinarily, the Office for National Statistics (ONS) produces annual estimates of the resident population of England and Wales 12 months after the date they refer to, usually around 30 June every year. This year, however, the population estimates for England and Wales have been released later than usual, in December 2022. This is because additional production time for mid-2021 was needed to incorporate Census 2021 data into the mid-year estimates and because of changes to estimates of international migration and additional research needed for internal migration methods.
The most authoritative population estimates come from the census, which takes place every 10 years in the UK. The most recent censuses were held on 21 March 2021 in England, Wales, and Northern Ireland and on 20 March 2022 in Scotland. Population estimates from a census are updated each year to produce mid-year population estimates (MYEs), which are broken down by local authority, sex and age.
Population estimates for the UK
We produce population estimates for England and Wales. We also collate estimates from Scotland and Northern Ireland to produce UK totals. Estimates for Scotland are produced by the National Records of Scotland (NRS), while the Northern Ireland Statistics and Research Agency (NISRA) produces the estimates for Northern Ireland.
Estimates for each of the UK constituent countries are compiled using a common methodological approach and aim to be as consistent as possible. Details of the specific data sources and methods used across the UK are summarised in a UK comparisons note.
This article relates to the estimates for England and Wales only.
A guide to the methodology used to produce the MYEs for Scotland is available from the NRS website. Details on the methodology used to create the Northern Ireland population estimates are available from the NISRA website.
Usually resident population
Population estimates refer to the usually resident population. This can mean that estimates of population do not necessarily coincide with the number of people to be found in an area at a particular time.
For most people, defining where they usually live – for the purposes of the census, for example – is straightforward. For a minority of people, the concept of usual residence is more difficult to define, for example, for students, members of the armed forces, prisoners and international migrants. Specific rules are used for these groups, which are:
- higher education students and schoolchildren studying away from home are resident at their term-time address
- members of the armed forces are usually resident at the address where they spend most of their time
- prisoners are usually resident in the prison estate if they have a sentence of six months or more
- international migrants are usually resident if they intend to stay in England and Wales for more than 12 months
Protection against disclosure
The estimates are produced using a variety of data sources and statistical models, including some statistical disclosure control methods. Small estimates should not be taken to refer to particular individuals.
Quality assurance
We consistently monitor the quality of the MYEs. This includes quality assurance of the administrative and survey data sources that are used to calculate the estimates, the statistical methods applied to produce the estimates, and the tables of data published on our website.
Further details are available in the Mid-year population estimates QMI and in the quality assurance of administrative data (QAAD) reports listed in Section 11.
Back to table of contents2. Cohort component method
Rolled-forward estimates
Population estimates are produced using a cohort component method. This is a standard demographic method that uses high quality data sources to inform components of population change. The three major components of population change are natural change, migration and special populations.
Our usual methods are designed to account for a full-year's population change between 1 July and 30 June mid-year points. However, the mid-2021 estimates instead account for population change between Census Day 2021 (21 March) and mid-2021 (30 June), a period of just over three months.
Natural change (births, deaths and ageing)
In the standard full-year method, the starting point for producing the estimates is the resident population from 30 June of the previous year. This population is aged on by one year. Births during the 12-month period are added to the population, while deaths during this period are removed according to recorded age, sex and usual area of residence.
The method for accounting for births for the period between Census Day and mid-2021 is identical to the standard full-year method. In this case, it is births occurring between 22 March and 30 June 2021.
For deaths, the method for Census Day to mid-2021 differs slightly from the full-year method and is discussed further in Section 4.
Internal Migration
The standard full-year method for producing internal migration is described in detail in Section 5.
For mid-2021, the production of internal migration estimates could not simply be derived using our existing methods and data sources. One significant difference from our usual method is a change in data source from the discontinued Patient Register (PR) to the Personal Demographics Service (PDS).
For Census Day to mid-year, we have incorporated a PDS extract taken on 19 April 2021 as a proxy for Census Day 2021 alongside the usual extract for mid-year 2021. We have also used data from the 2021 Census to identify and remove lagged migration moves. This is discussed in more detail in Section 5.
International migration
A detailed description of the methods to produce international migration estimates prior to mid-2021 are given in our Population estimates for the UK, mid-2020: methods guide.
Special populations
In the standard full-year method, adjustments to the population estimates are made for some special population groups that are not captured by the usual internal or international migration estimates: members of the armed forces and prisoners. These populations have specific age structures, which remain fairly constant over time so are not aged-on with the rest of the population. Such populations are referred to as static populations.
For the period between Census Day and mid-year we have not made adjustments for special populations (armed forces and prisoners). These populations and their age-structures are generally stable and the short period between Census Day and mid-year means any change is assumed to be small. Further, the annual adjustments we make are based on annual stock estimates, and there is a lack of suitably detailed data available to allow for an effective estimate of changes to special populations between Census Day and mid-year to be made.
Summary of the cohort component method
Standard full-year method
The cohort component method has seven stages, which are:
- stage one: take the resident population of the previous year on 30 June and remove the static populations (prisoners, home and foreign armed forces)
- stage two: age on by one year
- stage three: add children born between 1 July and 30 June as the population aged zero
- stage four: subtract from the population the number of deaths between 1 July and 30 June
- stage five: add or remove people who have entered or left the country between 1 July and 30 June
- stage six: adjust areas' populations to account for those that have moved within the UK between 1 July and 30 June
- stage seven: add updated static populations (prisoners and home and foreign armed forces), and account for people entering and leaving them from areas of the UK; this produces the resident population of the current year on 30 June
Method for Census Day to mid-year 2021
In a census year, rather than ageing-on the population by one year, the population is only aged-on by the period of time between the census (21 March) and 30 June. Similarly, the components only need to account for change during this period rather than a whole year.
Census-basing
The method in this section describes how mid-year population estimates (MYEs) are calculated for years when there is no census. For years in which there is a census, the MYEs are based on the census estimates, and a slightly different approach is necessary. Rather than ageing-on the population by one year, the population is only aged-on by the period of time between the census and 30 June. Similarly, the components only need to account for change during this period rather than a whole year.
Research and development
We continue to research ways of ensuring and improving the quality of the population estimates, including analysis of new data sources that become available. The latest information can be found in our Population statistics research update articles.
Uncertainty estimates have been created to give users additional information of the quality of these estimates. Measures of statistical uncertainty are available for the unrevised data for the years mid-2011 to mid-2020. We are planning to make uncertainty measures for mid-2021 available in 2023, once work to reflect methodological changes to international and internal migration can be incorporated
In-depth methodology
The following sections describe in more detail how we estimate the components of population change in the MYEs produced for England and Wales.
Back to table of contents3. Births
Change in population resulting from births
In the standard full-year method, births in England and Wales occurring between 1 July of the previous year and 30 June of the current year are added to the population at age zero, by sex, and allocated to the local authority of usual residence of the mother.
For mid-2021, the method for accounting for births for the period between Census Day and mid-2021 is identical to the standard full-year method. In this case, it is births occurring between 22 March and 30 June 2021.
Births data
Data on live births by sex are obtained from the Civil Registration System administered by the Office for National Statistics (ONS) and are based on births occurring (and then registered) in England and Wales. As registration of births may legally take place up to 42 days after a birth, the data received refer to the date of birth rather than the date of registration.
Births to mothers outside England and Wales
The Civil Registration System captures information on all births in England and Wales. This includes births to mothers who are usually resident elsewhere, but not necessarily those births to mothers who are usually resident in England and Wales that take place elsewhere.
We assume that the number of births for the two groups are similar in number and on average balance each other out. In this way, births to non-usually resident mothers are added to the population estimates as a proxy for those births elsewhere to usually resident mothers. We impute local authorities of residence for these births using the distribution of births we know about during the year.
Back to table of contents4. Deaths
Change in population resulting from deaths
In the standard full-year method, deaths that are registered in England and Wales between 1 July of the previous year and 30 June of the current year are subtracted from the population by sex, age and local authority of usual residence.
For a standard year, data received for the latter half of the reference period (1 January to 30 June) are provisional, as some very late registrations are not included by the time of producing the mid-year estimates. An adjustment is made to account for this by using the difference between provisional and final data for 1 January to 30 June in the previous year as a proxy for late registrations in the current year.
For mid-2021, the deaths method for Census Day to mid-2021 differs slightly from the full-year method. Estimates of deaths after Census Day (March 21) up to 30 June 2021 include registered deaths that occurred during this period plus a similar adjustment for late registrations. However, in this case a proportion of the late registrations known to have occurred for the period 1 January to 30 June 2020 are used.
Deaths data
Deaths data are obtained from the Civil Registration System administered by the Office for National Statistics (ONS). The data are supplied by sex, age and local authority of usual residence in England and Wales. To be consistent with the mid-year reference date, we adjust age at death to 30 June.
The Civil Registration System captures information on all deaths in England and Wales. This includes deaths of people usually resident elsewhere (outside England and Wales). In the calculation of subnational population estimates, these people are allocated to a local authority, imputed using the distribution of deaths by age and sex we know about during the year.
The Civil Registration System does not record deaths of usual residents of England and Wales that have occurred abroad and that are not registered in England and Wales. These deaths are excluded from the deaths data and do not feature in the calculation of the mid-year population estimate (MYE).
Unknown local authority of residence
Local authority of residence is not recorded for a small number of deaths. For these, a local authority is imputed using the distribution of deaths by age and sex we know about during the year.
Back to table of contents5. Internal migration
To account for migration of people within the UK, data are obtained for flows of migrants between each pair of local authorities in England and Wales, as well as for flows of migrants between England and Wales and the rest of the UK (cross-border flows).
Internal migration data
Internal migration estimates are primarily based on data that flag up when people change their address with their doctor. Since most people change their address with their doctor soon after moving, these data are considered to provide a good proxy indicator of migration.
Up to and including mid-2020, internal migration estimates have used the same combination of three administrative data sources used since mid-2017. They are used as a proxy for internal migration within England and Wales and for cross-border flows from England and Wales to Scotland and Northern Ireland: the Patient Register (PR), the Personal Demographics Service (PDS) weekly updates file from NHS Digital, and Higher Education Statistics Agency (HESA) data. From mid-2021, we used the PDS annual extract (known as the PDS stock file) instead of the PR as this was no longer available.
For mid-2012 to mid-2016, the NHS Central Register (NHSCR) was used in combination with the PR and HESA data. However, in February 2016 the Central Health Register Inquiry System was turned off, so data for within-year moves and cross-border flows are now sourced from the PDS.
Personal Demographics Service (PDS) data (formerly Patient Register data) – for transitions within England and Wales
We get a snapshot of data extracted from the PDS (formerly PR) as of 31 July each year. This is known as the PDS stock file. This reference date is based on the assumption that it takes about a month to register with a GP and appear on the PDS after moving to a new area. This enables migration estimates to be produced for the year ending 30 June.
In the standard full-year method, the records are compared between the current year and the previous year. This enables the identification of people who have changed their postcode during the period. For the purpose of estimating the population, we assume that a person who changes their local authority of residence (within England and Wales) between one year and the next is a migrant. This is known as a transition, as it does not cover within-year moves.
Personal Demographics Service data – for within year moves and cross border flows
From mid-2017, the PDS weekly updates file replaced the NHSCR in our methods. Like the NHSCR, the PDS records the within year moves of patients and is combined with PDS (formerly PR) stock files to produce estimates of migration between local authorities. The PDS records a higher number of moves than the NHSCR did, and we do not fully understand all of the reasons for this difference. Consequently, for the mid-2017 to mid-2020 estimates, we used a combination of PR data and the relationship between the PDS and historical NHSCR data. Further details of this are given in Section 12.
From mid-2017, the counts of cross-border flows between England and Wales and Scotland and Northern Ireland were also obtained using the PDS weekly updates file. The total flows to and from constituent countries of the UK are agreed between the Office for National Statistics (ONS), National Records of Scotland (NRS) and Northern Ireland Statistics and Research Agency (NISRA), based on records of in-migration to the relevant country.
NHS Central Register data – until February 2016
The NHSCR recorded the movements of patients between health authority areas (HAs) and was combined with PR data held by individual HAs, to produce estimates of migration between local authorities. Similar data sources were used to obtain estimates of cross-border flows to and from Scotland and Northern Ireland.
The NHSCR data source was discontinued in February 2016. Consequently, England and Wales internal migration estimates for mid-2016 were calculated by combining the 2016 PR data with the 2015 NHSCR data. For mid-2017, we moved to using the PDS weekly updates file.
Estimating within-year moves – reconciling PR stock files with PDS weekly updates (mid-2017 to mid-2020) and NHSCR (mid-2012 to mid-2016)
The majority of internal migration moves reflect someone living in one area of England and Wales at the start of the year and another area at the end of the year. This type of move is called a "transition", but not all moves are of this type. For example, if people move multiple times in a year, babies move within the year they are born, or if people die or emigrate before the end of a year, these are collectively called "within-year moves". The PR stock files cannot capture the migration of those who move during the year but who were not registered with a GP at one of the two mid-year time points. However, the PDS weekly updates file (and formerly, the NHSCR) pick up these types of moves.
Higher Education Statistics Agency data and Higher Education Leavers Methodology
The fundamental approach to estimating internal migration within England and Wales is to compare people's area of residence on the PDS (formerly PR) in the current year with that in the previous year. We know one weakness of this approach was that people moving to or leaving higher education might be slow to update their health registration (with a GP). This would mean we would not identify all the moves into student areas or into areas where graduates tended to move to after completing their studies. We have used several methods to try to account for these moves.
For the mid-2012 to mid-2016 internal migration estimates, we improved our methods by linking the PR data with data from the HESA. The HESA data showed where students were registered by their university as living, and this allowed us to make more accurate estimates of people moving to study in each area. However, it did not tell us where people – in particular, those slow in updating their health registration – moved to after completing their studies. Rather than assuming those people stayed in the area where they studied (that would result in overestimating the population of that area), we used a model that assumed people completing their studies and not updating their health registration record would move back to their PR address over time.
For mid-2017 onwards, we have improved this method by introducing a new end-of-studies approach – the Higher Education Leavers Methodology (HELM). This method distributes those higher education leavers whose addresses have not been updated on their PDS (formerly PR) after leaving higher education using the movement patterns of students who have previously left higher education.
The method can be summarised as follows:
stage one: identify people who need their area of residence imputed; this will be from their PDS (formerly PR) records (not updated during the year) previously linked to HESA data but no longer with a HESA record as the person has left higher education
stage two: identify similar people (those who have left higher education but not updated their health registration during the first year) from three years previously and use their PDS records to estimate the distribution of destinations; three years is judged to be the best balance of using recent and older data to both reflect current patterns and maximise the proportion of updated registrations
stage three: apply the estimated distribution to people to be imputed; the random imputation avoids systematic bias in destinations chosen, but the final distribution will be close to the initially estimated distribution
We can reasonably expect that the estimates produced using HELM are more accurate than those produced using the previous method. Recognising that higher education leavers might disperse to any of the 331 local authorities (336 in April 2020, 339 in April 2019 and 348 before April 2019) in England and Wales will mean the internal migration estimates should better reflect the real patterns of moves that occur.
By not simply keeping the higher education leavers at their HESA address or returning them to their PR address, we can also expect the methodology to improve the number of post-student-aged individuals remaining in "student" local authorities and the number of post-student-aged individuals moving to popular graduate destinations (often large metropolitan areas).
It is important to note that some people remain in their local authority of study following higher education. HELM recognises this, as the destination distributions still reflect a number of individuals staying in their local authority of study.
Unlike the previous methodology, which distributed students over time, HELM distributes all higher education leavers to their imputed destination in the first year after they finished higher education. There is some inaccuracy because a number of moves informing the destination distributions took place in the second or third year after leaving higher education. This is offset by the fact that some moves may have been "lagged"; that is, occurring in the first year, but recorded in the second or third year after leaving higher education. There is a further offsetting effect in that the destination distributions assume that any individuals who did not change address in any of the three years after leaving higher education remained in their local authority of study while some of these may have moved (but not updated their health registration).
As with the previous method, the approach of imputing place of residence for individual records has substantial advantages over making aggregate adjustments, as any incorrect imputation would be automatically corrected when that person updates their health registration. The impact of using HELM, as opposed to the previous method of estimating graduate migration patterns for mid-2017, is presented in Section 12.
Internal migration and special populations
Movements of members of the armed forces are not included in the internal migration estimates. While the NHSCR records movements of people into and out of the armed forces, movements of serving members are not recorded. For similar reasons, movements of prisoners are also not included in the internal migration estimates. The population of armed forces and prisoners are estimated separately.
Internal migration for Census Day to mid-year 2021
Our usual methods and data for producing internal migration flows have been adjusted to better measure the migration flow between Census Day 2021 and mid-year 2021 (21 March to 30 June). Broadly, the overall method is similar to a full-year's internal migration, but we have incorporated a Census Day extract of the PDS as our starting point along with a mid-2021 PDS extract.
The period between Census Day and mid-year is problematic from a lagging perspective. Lagged moves occur when there is a delay between a move happening and the change in address being accounted for in administrative data. The PDS extracts allow a 30-day lag anyway and were taken on 19 April 2021 and 30 July 2021, accordingly. However, the roll-out of coronavirus (COVID-19) vaccines to younger adults occurred during spring and summer 2021. This represented a far greater level of interaction with the health service than is usually the case for this population. Consequently, a large number of previously uncaptured moves from prior to Census Day appeared to move afterwards, and so were reflected in our initial estimates of moves. Further, combining these heavily lagged internal migration flows with an accurate census population base poses a significant quality risk to the resulting population estimates.
Therefore, we have also used data from the 2021 Census to identify and remove lagged migration moves. Lagged migration moves have been identified by comparing the local authority of individuals on the 2021 Census with their local authority on the PDS. Initially, we have identified internal migration moves using change of address on the PDS between Census Day and mid-year. However, where the local authority on the census data and the PDS extract for mid-year are identical, this provides strong evidence that an individual did not move between Census Day and the mid-year point. In this circumstance we omit the move from our final internal migration moves.
We have not adjusted moves among students and higher education leavers using the census data. This reflects our existing adjustments for these groups which are aimed at reducing lagging in internal migration flows. So rather than removing moves we believe occurred in a previous period, we look to use additional data and assumptions to bring forward lagged (and potentially wholly missed) moves. This process is applied to both the Census Day PDS extract and the mid-year extract, but effectively moves students and higher education leavers prior to Census Day. However, as these adjustments are also reflected in the mid-year 2021 extract, they do not create additional moves between Census Day and mid-year 2021.
Our adjustment for Higher Education (HE) leavers uses the distribution of previous HE leavers to move current HE leavers. Therefore, the process described results in HE leavers potentially being allocated different destination local authorities (in the Census Day and mid-year extracts) simply through the distributive nature of the process. To prevent this issue generating moves, we have taken the adjustment from the mid-year stock file as being definitive; this information was then used to overwrite individual's location on the Census Day PDS data. Through implementing this approach, we have prevented spurious additional moves, purely related to the random element of our distribution method, from being included in the final estimates.
Region Change in net
internal migrationNorth East -200 North West -1,300 Yorkshire and The Humber 900 East Midlands -900 West Midlands -700 East -3,800 London 14,900 South East -6,700 South West -1,400 England 600 Wales -700 Download this table Table 1: Impact of the census adjustment on net internal migration
.xls
.csv
Table 1 shows the impact of the census adjustment on net internal migration by English regions and Wales. While the census adjustment removed lagged moves both to and from regions, the net effect was a reduction in net outflows for London and Yorkshire and The Humber between Census Day and mid-year 2021. Whereas for the other regions and Wales there was a reduction in net inflows.
Age-band Males Females 0 to 4 years 21% 22% 5 to 9 years 29% 29% 10 to 14 years 30% 31% 15 to 19 years 19% 16% 20 to 24 years 19% 16% 25 to 29 years 38% 30% 30 to 34 years 43% 30% 35 to 39 years 41% 29% 40 to 44 years 38% 29% 45 to 49 years 35% 30% 50 to 54 years 32% 28% 55 to 59 years 30% 26% 60 to 64 years 26% 24% 65 to 69 years 23% 21% 70 to 74 years 20% 17% 75 to 79 years 15% 14% 80 to 84 years 10% 10% 85 to 89 years 7% 9% 90 years and over 5% 7% Download this table Table 2: Percentage of moves removed by the census adjustment
.xls
.csv
Table 2 shows the percentage of moves between Census Day and mid-year 2021 that have been removed by applying the census adjustment by five-year ages and sex. Generally, it shows more male moves were removed along with more people aged 25 to 49 years. Since students and former students were not included in the adjustment, the effect for those aged 15 to 24 years is lower.
Our additional processing of internal migration flows for Census Day to mid-year has no impact on future year internal migration estimates, as no editing of the underlying data occurs. For mid-2022 internal migration estimates, we expect to return to our regular methodology.
Back to table of contents6. International migration
A detailed description of the methods to produce international migration estimates prior to mid-2021 are given in our Population estimates for the UK, mid-2020: methods guide.
An international migrant is defined as a person who changes his or her country of usual residence for a period of at least a year. Previously, the international migration component of the mid-year estimate was produced using a complex set of methods using a variety of administrative and survey data sources. These methods were designed to complement international migration estimates from the International Passenger Survey (IPS). The latest long-term international migration estimates are produced using methods that are based predominantly on administrative data.
Therefore, we have developed a new experimental method to produce international migration estimates by age and sex at a local level. This uses data from the:
Registration and Population Interaction Database (RAPID) from the Department for Work and Pensions
Higher Education Statistics Agency (HESA)
NHS Personal Demographics Service
2021 Census
These data sources combined allow us to break down the total net migration estimate by age, sex and local authority.
These estimates are likely to be revised as we continue to develop methods to provide the most accurate picture of international migration. This includes both the overall estimate of international migration and estimates at more granular levels, where the methods are less developed. For more information on the potential revisions, please see our Population and International Migration Statistics Revisions Policy.
Back to table of contents7. Home armed forces
Who is included
The population estimates include all members of the UK armed forces (UKAF) stationed in England and Wales. Members of UKAF deployed on operations and temporary assignments overseas are also included in the population estimates where their last permanent station is in England and Wales. Personnel who are serving on overseas postings are removed from the population estimates, but we account for their flows and those of their accompanying dependants into and out of England and Wales.
Special population
UKAF are treated as a special population, as the movements of military personnel are not captured by the data sources used to estimate international and internal migration.
We assume that UKAF personnel and their dependants travel by military flights into and out of England and Wales when serving in posts overseas and are therefore not counted in the international migration estimates. These are routes that are not covered by the International Passenger Survey (IPS), which is still currently used to measure the migration flows of UK nationals. We also assume that UKAF personnel are not on GP registers and are therefore not counted in the internal migration estimates. However, it is assumed that dependants are on GP registers, so movements of dependants within England and Wales are not part of the special population.
Home armed forces data
We receive aggregated UKAF data from the Ministry of Defence (MoD). These data include military personnel counts by age, sex and local authority of base.
We also receive aggregate data from British Forces Germany (BFG) by sex and age, of dependants (partners and children) who accompany members of UKAF stationed in Germany. Germany has the second largest population of UKAF after the UK; in mid-2019, this accounted for approximately 25% of all UKAF posted overseas. The proportion of the UKAF population in Germany has been decreasing year on year as part of the MoD's plan to withdraw troops from Germany by 2020.
Census data for the home armed forces are also used to inform distributions for local authority of usual residence.
Change in UKAF stationed in England and Wales
Data are obtained from the MoD for UKAF by sex, age and local authority of base, stationed in England and Wales. To fit in with the population estimates' usual residence definition, the UKAF population is estimated at the residence at which they spend most of their time. A base-to-residence distribution based on census data is used to adjust UKAF from their local authority of base to their local authority of residence.
Change in civilian population
Any change in the population of UKAF from one year to the next will be reflected in the civilian populations of England and Wales – those joining and leaving UKAF will create a resulting inflow and outflow between UKAF and the civilian population.
This flow between the UKAF population and the civilian population must also take account of UKAF serving overseas if they are usually resident in England and Wales.
A reduction factor is applied to all members of UKAF (including those stationed overseas) to estimate those who would be usually resident in England and Wales, as opposed to other parts of the UK. The proportion of UKAF stationed in England and Wales is used as a proxy for calculating this reduction factor.
To account for the change in the population of UKAF stationed in England and Wales, the previous year's estimated population is subtracted from the current year's estimated population, by sex, age and local authority of usual residence.
A local authority of residence is imputed for each net flow using a local authority distribution derived from the census for the permanent home of members of UKAF.
Change in overseas dependants
We assume that dependants (partners and children) of members of UKAF who are serving overseas are not picked up by the IPS, and are therefore treated as part of the home armed forces special population.
BFG data on dependants accompanying UKAF stationed in Germany are used to provide a ratio (number of dependants per UKAF member) and sex and age distribution that can be applied to UKAF serving overseas to estimate the overseas dependant population.
A reduction factor is also applied to the estimated overseas dependant population to estimate those who are usually resident in England and Wales. The reduction factor is calculated using the same proportion as previously, so that only the overseas dependants who are usually resident in England and Wales are estimated.
To account for the change in the overseas dependant population, the current year's estimated population who are usually resident in England and Wales is subtracted from the previous year's population, by sex and age.
A local authority of residence is imputed for each net flow using a local authority distribution derived from the census for members of UKAF living with a partner.
Compilation
To calculate the total change of UKAF, we calculate by sex, age and local authority: net change in UKAF stationed in England and Wales, plus net change in the civilian population, plus net change in overseas dependants.
Back to table of contents8. Foreign armed forces
Special population
Foreign armed forces based in England and Wales are treated as a special population in the population estimates, as we assume they are not captured by the methods used to estimate internal and international migration.
We again assume that foreign armed forces personnel travel by military flights into and out of England and Wales, and are therefore not counted in the international migration estimates. We also assume that foreign armed forces personnel are not on GP registers, and are therefore not counted in the internal migration estimates.
Changes as part of the revised back series of population estimates for mid-2012 to mid-2016, mid-2017 and mid-2020
The movements of dependants of foreign armed forces personnel are covered by the IPS. However, the methods used to distribute international migration flows to local authority level are unlikely to capture the movements of this group accurately as they tend not to appear on the GP Patient Registers (PRs), Migrant Workers Scan (MWS) or data on higher education. As a result, we have tended to "age-on" the dependants found in the 2011 Census rather than updating them in line with the foreign armed forces personnel. To produce more accurate population estimates, we have extended our special population adjustment for foreign armed forces personnel to cover dependants.
Given that the dependants of foreign armed forces are now theoretically counted twice by the mid-year population estimates (MYEs) (through international migration and the special population adjustment), we have introduced a further adjustment that counterbalances this: the population estimate of England and Wales, including the special population adjustment for dependants, is constrained back to the population excluding the adjustment.
Who is included
All foreign armed forces personnel and their dependants (partners and children) usually resident in England and Wales should be included in the population estimates. The US Air Force (USAF) makes up the majority of foreign armed forces; however, there are a number of military personnel from other US service arms (US Army, Navy and Marine Corps) who are also based in England and Wales.
The foreign armed forces component only accounts for military personnel and their dependants from USAF, with the exception of a small adjustment made for other US service arms currently located in Harrogate and North Kesteven. Foreign armed forces who are not from the US are not accounted for as part of the special population as there are no data currently available. However, these are considered very small in number.
Imputation of missing sex and age
For 2019 and 2020, we received data on the ages of children, but USAF were unable to supply data on the sex of children. We imputed the sex of children using the sex distribution of children in 2018. Spouses' data were supplied by proportions in age bands by sex. We imputed the missing single year of age data using the proportions supplied by USAF by assuming that each age within each age band accounted for an equal share of the total. For example, for the age band 20 to 24 years we assumed that one-fifth were aged 20 years, one-fifth aged 21 years and so on.
US Air Force data
Data for USAF based in England and Wales are supplied to the Office for National Statistics (ONS) annually on or around the reference date of 30 June for the number of USAF personnel and their dependants, by sex, age and base in England and Wales.
Adjustment for Harrogate and North Kesteven
An adjustment is made for the local authorities of Harrogate and North Kesteven for other US service arms to account for pockets of localised foreign forces resident in these local authorities. The adjustment is based on data from the US Defence Manpower Data Centre on the total number of US Army, Navy and Marine Corps personnel based in the UK.
Base to local authority of residence
The population of England and Wales is estimated at the local authority of usual residence. USAF data are only provided by base, and therefore local authority of usual residence is imputed using data derived from the 2011 Census. For any bases in the USAF data where there is no base to residence information available in the census, residence is assumed to be at the local authority of the base. This is a valid assumption as the majority of members of the US armed forces live on base.
Change in foreign armed forces population
The change in the foreign armed forces population between the two mid-year points is estimated by subtracting the previous year's estimated foreign armed forces population from the current year's estimated foreign armed forces population, by local authority of residence, sex and age.
The exception to this approach is the method for estimating zero-year-olds. At the beginning of the process of calculating the MYEs, all zero-year-olds of the previous year's special population must be subtracted. This is to avoid ageing-on any zero-year-olds that will be accounted for at the end of the MYE calculation process through addition of the current year's special population one-year-olds.
However, when the current year special population is added at the end of the MYE calculation process, none of the zero-year-olds should be added. The zero-year-olds in the current year special population will already have been counted into the population because they were born in the UK and are part of the births data that are added to the MYEs.
Some additional special population zero-year-olds will have been born outside the UK and migrated in within the last year and will not be counted. These would be broadly balanced by those zero-year-olds born to the special population in the last year who then migrate out of the country, assuming a broadly similar resident special population over the year. There may be larger variations in this fraction if bases increase or decrease their personnel significantly.
Assumptions not stated elsewhere
A further assumption is made in how we estimate the foreign armed forces special population. It is assumed that joiners and leavers of the foreign armed forces population are not taken from or put back into the general England and Wales population.
Back to table of contents9. Prisoners
Special population
Population estimates include all prisoners in England and Wales with a sentence of six months or more. Prisoners are treated as a special population in the population estimates as it is assumed that movements of people into and out of prisons are not picked up by GP registers used to estimate internal migration.
Prisoner data
The Ministry of Justice supplies data on the number of people resident in prisons in England and Wales on 30 June of the reference year, by prison location, sex and age. For the purposes of the population estimates, a person is regarded as usually resident in a prison if they have been sentenced to serve six months or more.
Change in prisoner population
Change in the prisoner population between the two mid-year points is estimated by subtracting the previous year's estimated prisoner population from the current year's estimated prisoner population, by local authority, sex and age. This change can only be indicative as the prison estate population can fluctuate widely between mid-year points as a result of operational needs.
Change in non-prisoner population
Any change in the estimated prisoner population from one year to the next will be reflected in the general population of England and Wales; those joining and leaving the prisoner population will create a resulting inflow and outflow between the general population.
To distribute inflows and outflows of prisoners to and from the general population of England and Wales, we use the local authority distribution of the previous year's population estimate and distribute flows to the local authorities with the highest populations.
Foreign national offenders and offenders from other parts of the UK
The prisoner component of the population estimates assumes that all prisoners in England and Wales remain in England and Wales following the completion of their sentence. Foreign national offenders who are deported following completion of their sentence, or ex-prisoners who move to other parts of the UK, are not accounted for in this method. Owing to difficulties in accurately estimating this population, we assume that the flow of ex-prisoners returning to England and Wales from elsewhere balances out these flows.
Back to table of contents10. Compilation
National (England and Wales) and subnational (local authority) estimates from each component are compiled to produce national and subnational estimates.
In the standard full-year method, the previous year's population estimate by sex, age and local authority of usual residence is aged-on by one year. The number of births between the two mid-year points is added into the population at aged zero years. Deaths between the two mid-year points are removed from the population estimates.
Net flows of international and internal within-UK migration are then added into the population estimates. Changes resulting from special populations are also added into the population.
For Census Day to mid-year, the same principle applies as the standard full-year method except the population at Census Day is the starting point. The population from census day is aged forward to mid-year (everyone is made 101 days older) and some small adjustments are made for the enumeration of armed forces personnel. The number of births between Census Day and mid-year 2021 are added into the population at age zero years and deaths are removed. Similarly, net flows of international and internal within-UK migration are then added into the population estimates.
The resulting population estimate is the final population estimate for 30 June of the current year, by sex, age and local authority.
Back to table of contents11. Quality assurance of administrative data reports
We quality assure the administrative data used in the estimation of the annual mid-year population estimate (MYE) to ensure that they are suitable. For further information regarding data quality issues and its impact on population statistics, please see the quality assurance of administrative data (QAAD) articles for each data source, which are available on our website:
- Births
- Deaths
- UK Armed Forces
- US Armed Forces
- Patient Register (PR)
- Higher Education Statistics Agency (HESA)
- Prisoners
- NHS Central Register (NHSCR)
- Migrant Worker Scan (MWS)
- Asylum seeker data and non-asylum enforced removals
- Home Office immigration
- Asylum seekers support
- University of Warwick halls of residence data
12. Understanding the impact of changes to internal migration methods
Understanding changes to internal migration estimates for mid-2017
There have been three changes to our internal migration methodology for mid-2017. The first change relates to how we account for the movements of the highly mobile population leaving higher education each year. The second change is in response to the unavailability of an important dataset used in the construction of internal migration estimates. The final change relates to an improved method for georeferencing record-level data (this is the process by which we determine the geographic location of those on administrative data).
This section gives further details on the first two of these changes and outlines the impact they have had on our data. No details on the impact of changes to georeferencing are provided in this section this reflects the relatively small impact this change has had in comparison to the other two changes.
Higher Education Leavers Methodology (HELM)
The Higher Education Leavers Methodology (HELM) has been introduced to better address the movements of people leaving higher education each year. This builds on the method introduced in 2012 by moving people who leave higher education but do not update their Patient Register (PR) information to local authority destinations based on the movements of past cohorts of similar higher education leavers.
As with the previous internal migration method, the movement of individuals when they start higher education is accomplished by linking together data from the PR and Higher Education Statistics Agency (HESA) and comparing this with a similar dataset from the previous year.
In the method used between mid-2011 and mid-2016, those leaving higher education but who did not update their PR information in the year they left higher education were, over a period of years, moved back to their location on the PR.
HELM is designed to address two limitations of the previous method. First, the previous method only moved people back to their location on the PR, often their place of residence before attending higher education. In practice, the end of study is often accompanied by a move to seek work or for additional education. Secondly, the previous method used a conservative approach whereby individuals were moved out of their place of study at too slow a rate in the first year and too quick a rate in the second year.
HELM is a two-stage process.
Matrices of destinations for higher education leavers are calculated for each local authority in England and Wales, separately for males and females, based on the movements of a past cohort of higher education leavers. Those leaving higher education three years before but who did not update their PR in the year they left higher education are used to inform the matrices. The destinations are either the first change in output area in the second year following leaving higher education or their location on the PR three years after leaving.
The matrices are applied to those people leaving higher education in the reference period but who do not update their PR. The application of the matrix occurs in one step in the year that people leave higher education.
How HELM has been implemented
To allow for a smooth transition between methods, HELM has been run on data for each year from 2012 to 2017. This means that the mid-2017 internal migration estimates are based on a stock file for mid-2016 (in effect, the internal migration origins for mid-2017) that was not constructed using the previous method of building internal migration estimates. Consequently, any shortcomings in the previous graduate adjustment are excluded from the estimates for mid-2017.
Comparison between previous student graduate adjustment and Higher Education Leavers Methodology (HELM)
The target population for the graduate adjustment mid-2012 to mid-2016 and mid-2017 onwards includes those on HESA and PR data in the previous year, and those only on the PR this year if they have a pre-study local authority recorded. For HELM mid-2017 onwards, this includes all those on HESA and PR data the previous year and only those on the PR this year.
The graduate adjustment mid-2012 to mid-2016 and mid-2017 onwards occurs gradually over a period of years, slightly too slow in first year and slightly too fast in second year; based on a set of static moving-out factors. For HELM mid-2017 onwards, this occurs immediately, in the year after they are no longer present on HESA data.
The graduate destination for the graduate adjustment mid-2012 to mid-2016 and mid-2017 onwards is pre-study local authority as recorded on the PR. For HELM mid-2017 onwards, this is based on the distribution of destinations of higher education leavers from three years previously; distribution is based on data for those who did not update their PR in the year following leaving.
The impact of HELM on internal migration estimates
One of the most obvious impacts of using HELM is that we estimate a higher number of internal moves: using HELM results in around 160,000 more moves in the mid-2017 internal migration estimates compared with the old method of accounting for higher education leavers.
The explicit aim of introducing HELM was to increase the outflow of graduates from local authorities with higher education institutions at aged 22 and 23 years, and to increase the inflow of graduates to local authorities that are popular graduate destinations (such as London and other major urban centres) at the same age. This is illustrated in Figure 1, which shows a higher number of internal migration moves at aged 22 and 23 years.
Figure 1: Pyramid of internal migration moves, England and Wales, mid-2017
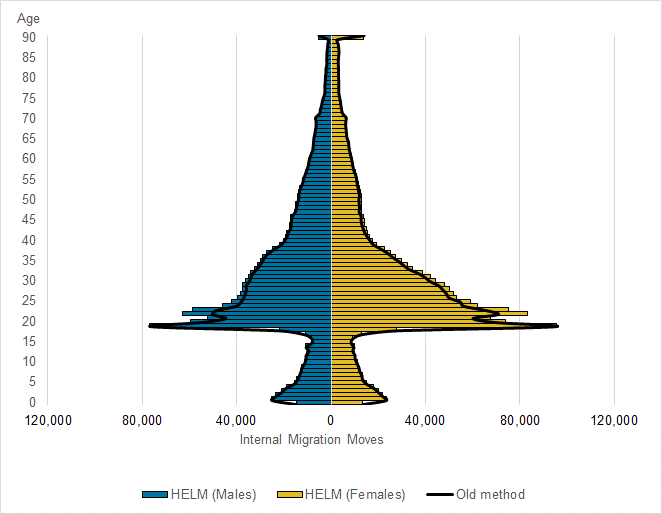
Source: Office for National Statistics – Population estimates
Download this image Figure 1: Pyramid of internal migration moves, England and Wales, mid-2017
.png (14.5 kB)
Local authority impacts of HELM
A comparison of internal migration estimates between HELM and the old method of accounting for moves by those leaving higher education is available in the comparison tool accompanying this article (published as part of the Population estimates: quality information, mid-2017). This provides internal migration estimates by single year of age and sex for administrative areas (local authorities and above) for England and Wales based on the new and old methods.
Tables 3 and 4 show the local authorities that have been impacted the most by the introduction of HELM. The list of the 20 local authorities with the largest increases in their net internal migration flows features 11 London boroughs. The 20 local authorities with the largest decreases in their net internal migration flows are home to large higher education institutions.
Local authority HELM Old method Difference between
HELM and old methodWandsworth -1,580 -2,280 710 Lambeth -2,190 -2,880 690 Bristol, City of 210 -320 530 Southwark -2,710 -3,080 370 Oadby and Wigston 870 540 330 Croydon -3,410 -3,710 300 Brent -6,800 -7,070 270 Islington -2,250 -2,510 260 East Hertfordshire 20 -220 240 Wiltshire 2,700 2,470 230 Broxtowe 360 140 220 Milton Keynes -1,470 -1,690 210 Hammersmith and Fulham -1,380 -1,570 190 Merton -3,580 -3,770 190 Lewisham -2,400 -2,580 190 Windsor and Maidenhead -390 -560 180 Hackney -2,050 -2,230 170 Bromley -340 -510 170 Shropshire 3,260 3,100 170 Thurrock 250 100 150 Download this table Table 3: Local authorities with the largest increases in net internal migration flows using HELM
.xls
.csv
Local authority HELM Old method Difference between
HELM and old methodBirmingham -7,640 -6,310 -1,340 Leeds -1,490 -380 -1,120 Nottingham -1,180 -260 -910 Welwyn Hatfield 130 1,000 -870 Sheffield -1,270 -690 -580 Leicester -2,630 -2,050 -570 Bath and North East Somerset 920 1,460 -540 Liverpool 930 1,460 -530 Plymouth -470 20 -490 Canterbury 530 1,000 -470 Neath Port Talbot 530 980 -450 Newcastle-under-Lyme 430 840 -410 Newcastle upon Tyne -170 240 -410 Manchester -3,560 -3,190 -370 Coventry -1,010 -670 -350 Lancaster 320 660 -350 South Gloucestershire 1,210 1,520 -310 Luton -5,350 -5,080 -270 Southampton -1,090 -830 -270 Runnymede -250 10 -260 Download this table Table 4: Local authorities with the largest decreases in net internal migration flows using HELM
.xls
.csv
Accounting for multiple moves and moves made by those not present at either the beginning or end of the year
The target concept for internal migration is all moves that cross local authority administrative boundaries in the reference year. This includes:
moves by those appearing on the PR at both the beginning and end of the year (often referred to as transitions)
moves by those born after the beginning of the year
moves by those who die before the end of the year
moves by those who immigrate into England and Wales after the beginning of the year
moves by those who emigrate before the end of the year
multiple moves during the year (for example, moving from Manchester to Leeds to London in the reference period)
From mid-2017 onwards, we have largely moved to the Personal Demographics Service (PDS) to account for these moves, but it is important to note that the NHS Central Register (NHSCR) is still an important part of the method.
The PDS picks up a far greater number of moves than the NHSCR; using the PDS to account for these moves would result in a much larger number of extra moves in the internal migration estimates. While the inconsistency between the number of moves picked up in the PDS and the NHSCR is not an indicator of any errors in the PDS data, we could not account for these moves purely on PDS data without further research into the causes of differences between the data sources.
If we had changed purely to the PDS for mid-2017, it would have introduced a substantial discontinuity in the time series of internal migration data. On that basis, we have decided to use a combination of data, using the pattern of geographic variation picked up by the PDS and adjusting for the differences between the PDS and NHSCR.
Movement factor example (mid-2015) shows how scaling factors, used to account for non-transition moves, were calculated for mid-2015. Movement factor example (mid-2017) shows how they have been calculated for mid-2017.
Movement factor example (mid-2015)
Let us say that there are two health authority areas (HAs), X and Y. According to the NHSCR, there were 20,000 moves into HA X and 30,000 moves out of HA Y.
Note that this is the total moves, not just the moves between these two HAs.
According to the PR, there were 15,000 transitions into HA X and 25,000 transitions out of HA Y.
We calculate the movement factors for this pair of HAs as:
The result is that every internal migration flow between a local authority in HA X and a local authority in HA Y will be multiplied by 1.25.
Movement factor example (mid-2017)
Let us say that there are two HAs, X and Y. According to the PDS movers file, there were 25,000 moves into HA X and 35,000 moves out of HA Y.
Note that this is the total moves, not just the moves between these two HAs.
According to the PDS transitions, there were 15,000 transitions into HA X and 25,000 transitions out of HA Y.
We calculate the initial movement factors for this pair of HAs as:
We adjust the initial scaling factor based on the relationship between the 2015-based NHSCR scaling factors and those based on the PDS movers and transitions for 2017 (this relationship is given by a regression line between the two series).
The result is that every internal migration flow (based on the PR, HESA and HELM) between a local authority in HA X and a local authority in HA Y will be multiplied by 1.32.
Frequently asked questions about the impact of HELM on internal migration estimates
The PDS results in scaling factors that are slightly higher for 2017 than previous years, which means that the total number of moves estimated in mid-2017 is higher. As scaling is applied as a uniform factor to both inflows and outflows between areas, it makes the underlying trends in the transitions data for either a net inflow or outflow more pronounced.
Internal migration for my area is higher or lower than last year, is this purely because of the methodological changes that have been implemented?
There are several reasons why internal migration patterns change each year. The change in methods will have had an effect on internal migration levels. The move to HELM results in more graduate-age people moving than previously, and the change to our scaling method results in more moves at all ages. Further information on the impact of HELM can be found in our Population estimates: revision tool dataset accompanying this release.
Why does HELM lead to more moves by people in their 30s, 40s and 50s?
The main aim of HELM was to better address the large-scale migration of those in their early 20s when they leave higher education. For practical purposes, we have implemented the method for all of those leaving higher education each year, including those at older ages. This means that HELM generates extra moves for those at older ages.
HELM moves those leaving higher education to a local authority destination based on the pattern of movements of a previous cohort. While the migration patterns that HELM generates are reasonable in aggregate, they are only a proxy for real moves. In practice, this means that a large number of moves will assign individuals to the wrong local authority districts. In subsequent years, these individuals will update their PR records and this will generate additional moves from their proxy location to their actual location.
Why did you not roll forward the scaling factors from mid-2015 as you did with the mid-2016 estimates?
For the mid-2016 internal migration estimates, we reused the scaling factors from the mid-2015 internal migration estimates. This was on the basis that these scaling factors were only one year out of date and represented a reasonable proxy for data for mid-2016. However, as we moved into production of the mid-2017 internal migration estimates and considered the need to produce scaling factors for future years, we could not justify rolling forward the same scaling factors indefinitely. In addition, the PDS provides us with similar coverage (multiple in-year moves and moves by those not present at either the beginning or end of the year) to the NHSCR.
Why have you not implemented these methods in the back-series released in March 2018?
It was not possible to implement these methods as part of the back-series released in March 2018 as we were still finalising the method in the early part of 2018.
Will you implement these as part of a back series?
In 2023, we will revise the population estimates for 2012 to 2020 to be consistent with population estimates from Census 2021. As part of this back series, we would intend to use our improved series of internal migration estimates. There are no other planned revisions to population estimates before this.
How can you be sure these are improvements?
Moving to HELM addresses important issues with the previous method of estimating internal migration. The effects of changes on the estimates as a result of using HELM are in line with our expectations and understanding of the issues. Unfortunately, we have no independent data sources that we can use to benchmark our method.
One of the reasons for mainly using the PDS instead of the NHSCR to account for non-transition moves has been to create as little discontinuity in our internal migration estimates as possible.
Back to table of contents13. Summary of historical methods
The mid-year estimates release contains population estimates from 2001 to the present year. Some of the main differences between the methods outlined in this methodology article and those used between 2001 and 2011 are discussed here.
Internal migration estimates (mid-2002 to mid-2011)
Internal migration estimates for mid-2002 to mid-2011 are based on Patient Register (PR) data (both the Patient Register Data Service (PRDS) and NHS Central Register (NHSCR)) enhanced using aggregate data from the Higher Education Statistics Agency (HESA) and 2001 Census data to better account for the movements of students. Further details on this method can be found in our methodology papers.
International migration estimates (mid-2012 to mid-2020)
A detailed description of the methods to produce international migration estimates prior to mid-2021 are given in the Population estimates for the UK, mid-2020: methods guide.
International immigration estimates (mid-2006 to mid-2011)
This method is broadly similar to the one currently used; international immigration at the England and Wales level is distributed to local authorities by stream using administrative data. Further details on this method can be found in our Improved methodology for estimating immigration to local authorities in England and Wales.
International immigration estimates (mid-2002 to mid-2006)
For mid-2002 to mid-2006, international immigration at the local authority level was calculated using a regression model, much like that currently used for international emigration, to distribute immigrants to local authorities. Further details can be found in Estimating international long-term immigration by local authority (PDF, 1.28MB).
International emigration estimates (mid-2002 to mid-2011)
For mid-2002 to mid-2011, international emigration at the local authority level was calculated using a regression model, much like that currently used, to distribute emigrants to local authorities.
Migration to and from Ireland (mid-2002 to 2007)
Historically, we used data from the Central Statistics Office (CSO) in Ireland to estimate migration flows between the UK and the Republic of Ireland. Their data were used because there were no routes between the two countries surveyed by the International Passenger Survey (IPS). From mid-2008, flows to and from Ireland were covered by the IPS. Further details can be found in Improving estimates of international migration in Northern Ireland, and between the UK and Republic of Ireland (PDF, 58KB). Additional changes (PDF, 640KB) were made post-census and as part of the revised back series of population estimates for mid-2001 to mid-2010.
Back to table of contents14. Historical geography changes – 2009 to 2021
Local government boundary names and area codes can change at any time. Since 2009, the changes listed in Table 5 have occurred. In some cases, local authority names or area codes have changed with little effect on the population estimates. In other cases, local authorities have merged into new larger bodies.
Population estimates are published each year according to the local authorities in place at the time of publication. Where changes have occurred in the 12 months before publication, data on the previous set of local authorities are also published. See the Office for National Statistics' (ONS') Open Geography Portal for more information on historical geography changes.
2009 changes 2008 local authority 2009 local authority Old code Updated code Powys Powys W06000007 W06000023 Merthyr Tydfil Merthyr Tydfil W06000017 W06000024 Bedford Bedford E07000002 E06000055 Mid Bedfordshire Central Bedfordshire E07000001 E06000056 South Bedfordshire Central Bedfordshire E07000003 E06000056 Chester Cheshire West and Chester E07000013 E06000050 Ellesmere Port & Neston Cheshire West and Chester E07000016 E06000050 Vale Royal Cheshire West and Chester E07000018 E06000050 Congleton Cheshire East E07000014 E06000049 Crewe and Nantwich Cheshire East E07000015 E06000049 Macclesfield Cheshire East E07000017 E06000049 Caradon Cornwall E07000019 E06000052 Carrick Cornwall E07000020 E06000052 Kerrier Cornwall E07000021 E06000052 North Cornwall Cornwall E07000022 E06000052 Penwith Cornwall E07000023 E06000052 Restormel Cornwall E07000024 E06000052 Isles of Scilly Isles of Scilly E07000025 E06000053 Chester-le-Street County Durham E07000054 E06000047 Derwentside County Durham E07000055 E06000047 Durham County Durham E07000056 E06000047 Easington County Durham E07000057 E06000047 Sedgefield County Durham E07000058 E06000047 Teesdale County Durham E07000059 E06000047 Wear Valley County Durham E07000060 E06000047 Alnwick Northumberland E07000157 E06000048 Berwick-upon-Tweed Northumberland E07000158 E06000048 Blyth Valley Northumberland E07000159 E06000048 Castle Morpeth Northumberland E07000160 E06000048 Tynedale Northumberland E07000161 E06000048 Wansbeck Northumberland E07000162 E06000048 Bridgnorth Shropshire E07000182 E06000051 North Shropshire Shropshire E07000183 E06000051 Oswestry Shropshire E07000184 E06000051 Shrewsbury and Atcham Shropshire E07000185 E06000051 South Shropshire Shropshire E07000186 E06000051 Kennet Wiltshire E07000230 E06000054 North Wiltshire Wiltshire E07000231 E06000054 Salisbury Wiltshire E07000232 E06000054 West Wiltshire Wiltshire E07000233 E06000054 2012 changes 2011 local authority 2012 local authority Old code Updated code St Albans St Albans E07000100 E07000240 Welwyn Hatfield Welwyn Hatfield E07000104 E07000241 2013 changes 2012 local authority 2013 local authority Old code Updated code Gateshead Gateshead E08000020 E08000037 Northumberland Northumberland E06000048 E06000057 East Hertfordshire East Hertfordshire E07000097 E07000242 Stevenage Stevenage E07000101 E07000243 2018 changes 2017 local authority 2018 local authority Old code Updated code Fife Fife S12000015 S12000047 Perth and Kinross Perth and Kinross S12000024 S12000048 Shepway Folkestone and Hythe E07000112 E07000112 2019 changes 2018 local authority 2019 local authority Old code Updated code Bournemouth Bournemouth, Christchurch and Poole E06000028 E06000058 Christchurch Bournemouth, Christchurch and Poole E07000048 E06000058 Poole Bournemouth, Christchurch and Poole E06000029 E06000058 Weymouth and Portland Dorset E07000053 E06000059 West Dorset Dorset E07000052 E06000059 North Dorset Dorset E07000050 E06000059 Purbeck Dorset E07000051 E06000059 East Dorset Dorset E07000049 E06000059 West Somerset Somerset West and Taunton E07000191 E07000246 Taunton Deane Somerset West and Taunton E07000190 E07000246 Suffolk Coastal East Suffolk E07000205 E07000244 Waveney East Suffolk E07000206 E07000244 Forest Heath West Suffolk E07000201 E07000245 St Edmundsbury West Suffolk E07000204 E07000245 Glasgow City Glasgow City S12000046 S12000049 North Lanarkshire North Lanarkshire S12000044 S12000050 2020 changes 2019 local authority 2020 local authority Old code Updated code Aylesbury Vale Buckinghamshire E07000004 E06000060 Chiltern Buckinghamshire E07000005 E06000060 South Bucks Buckinghamshire E07000006 E06000060 Wycombe Buckinghamshire E07000007 E06000060 2021 changes 2020 local authority 2021 local authority Old code Updated code Corby North Northamptonshire E07000150 E06000061 Daventry West Northamptonshire E07000151 E06000062 East Northamptonshire North Northamptonshire E07000152 E06000061 Kettering North Northamptonshire E07000153 E06000061 Northampton West Northamptonshire E07000154 E06000062 South Northamptonshire West Northamptonshire E07000155 E06000062 Wellingborough North Northamptonshire E07000156 E06000061 Download this table Table 5: Historical geography changes – 2009 to 2021
.xls
.csv
15. Cite this methodology
Office for National Statistics (ONS), released 21 December 2022, ONS website, methodology, Population estimates for the UK, mid-2021: methods guide