1. Main points
Median household disposable income in the UK was £28,400 in the financial year ending (FYE) 2018, based on estimates from our Living Costs and Food Survey.
Median income was broadly unchanged in FYE 2018 compared with the previous year, after accounting for inflation and changes in household composition; this levelling off means that median income has now been rising by an average of 2.2% a year since FYE 2013.
Growth in the median income of individuals living in retired households was also broadly unchanged in FYE 2018 compared with the previous year, with a median of £23,900.
2. Other bulletins in this release
Commentary on household income inequality in financial year ending 2018 is reported in Household income inequality financial year ending 2018.
Back to table of contents3. Analysis of average income
Figure 1: Median income was £28,400 in the financial year ending 2018
Distribution of UK equivalised household disposable income of individuals

Source: Office for National Statistics
Notes:
- Individuals are ranked by their equivalised household disposable incomes, using the modified Organisation for Economic Co-operation and Development (OECD) scale.
Download this image Figure 1: Median income was £28,400 in the financial year ending 2018
.png (7.9 kB) .xlsx (14.5 kB)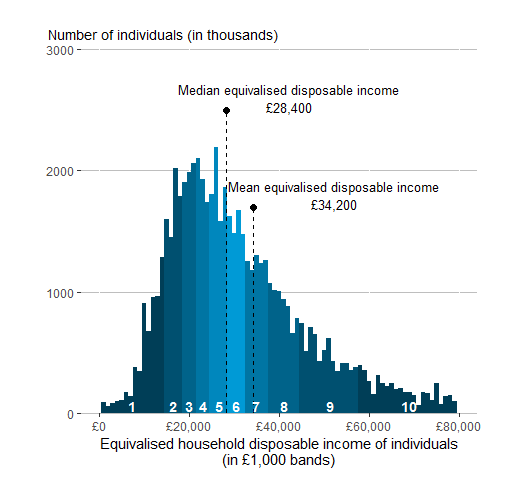
This bulletin looks at two measures of people’s household disposable income: median and mean. Both measures are equivalised, meaning that they take into account that households with more people will need a higher income to achieve the same standard of living as households with fewer members.
The distribution of equivalised disposable income is skewed towards lower income people; mean income (£34,200) is £5,800 larger than median income (£28,400).
Figure 2: Median income broadly unchanged in financial year ending 2018
Median and mean real equivalised household disposable income of individuals, UK, 1997 to financial year ending 2018.
Source: Office for National Statistics
Notes:
- 2017 to 2018, which represents the financial year ending 2018, (April to March), and similarly for all other years expressed in this format.
- Incomes are adjusted for inflation using the Consumer Prices Index including owner occupiers’ housing costs (CPIH) excluding Council Tax.
- Indices are calculated relative to 1977 values.
Download this chart Figure 2: Median income broadly unchanged in financial year ending 2018
Image .csv .xlsMedian income was broadly unchanged in financial year ending (FYE) 2018 compared with the previous year. This follows a period since FYE 2013 where median income grew at 2.2% per year. Median income remains £1,500 higher than the pre-economic downturn level observed in FYE 2008.
Figure 3: The income of the richest fifth of people continues to grow
Mean equivalised household disposable income of individuals by quintile group, UK, financial year ending 2008 to financial year ending 2018 (Index 2007 to 2008 = 100)
Source: Office for National Statistics
Notes:
- 2017 to 2018, which represents the financial year ending 2018, (April to March), and similarly for all other years expressed in this format.
- Incomes are adjusted for inflation using the Consumer Prices Index including owner occupiers’ housing costs (CPIH) excluding Council Tax.
- Individuals are ranked by their equivalised household disposable incomes, using the modified OECD scale.
Download this chart Figure 3: The income of the richest fifth of people continues to grow
Image .csv .xlsIn contrast to median income, mean income increased by 1.9% in FYE 2018, after accounting for inflation and household composition. The difference between growth in mean and median income reflects differences in growth rates between the richest and poorest individuals. The average income of the poorest fifth of the population – when ranked by equivalised household disposable income – contracted by 1.6%, mainly driven by fall in the average value of cash benefits their households receive. The average income of the richest fifth, on the other hand, increased by 4.7% due largely to increases in average household earnings from employment. Over the slightly longer term, it is the average income of the poorest fifth that has risen the most, up 11.6% since FYE 2008, whilst the income of the richest fifth has risen 4.9% over the same period.
Figure 4: Median income of people living in retired households broadly unchanged in financial year ending 2018
Median equivalised disposable household income for individuals living in retired and non-retired households, and all individuals, UK, 1977 to financial year ending 2018
Source: Office for National Statistics
Notes:
- 2017 to 2018, which represents the financial year ending 2018, (April to March), and similarly for all other years expressed in this format.
- Incomes are adjusted for inflation using the Consumer Prices Index including owner occupiers’ housing costs (CPIH) excluding Council Tax.
Download this chart Figure 4: Median income of people living in retired households broadly unchanged in financial year ending 2018
Image .csv .xlsFigure 4 compares growth in the median equivalised disposable income of retired and non-retired individuals with that of the overall population. While the income of retired people remains considerably lower than that of those who are not retired, they have seen faster income growth over the period covered. Since 1977, after adjusting for inflation, the median income of retired individuals increased on average by 2.7% per year, from £8,300 to £23,900. The income of non-retired individuals, on the other hand, increased by 1.9% per year on average, from £13,800 to £29,700.
More analysis on the longer term picture of retired and non-retired income is contained within the article, What has happened to the income of retired households in the UK over the past 40 years?
Back to table of contents4. Average household income data
Effects of taxes and benefits: disposable
Dataset | Released on 26 February 2018
Tables 1 to 11 in the Effects of taxes and benefits: disposable data provide more detailed information on average household income.
5. Glossary
Disposable income
Disposable income is arguably the most widely used household income measure. Disposable income is the amount of money that households have available for spending and saving after direct taxes (such as Income Tax, National Insurance and Council Tax) have been accounted for. It includes earnings from employment, private pensions and investments as well as cash benefits provided by the state.
Equivalisation
Comparisons across different types individuals and households (such as retired and non-retired, or rich and poor) or over time is done after income has been equivalised. Equivalisation is the process of accounting for the fact that households with many members are likely to need a higher income to achieve the same standard of living as households with fewer members. Equivalisation takes into account the number of people living in the household and their ages, acknowledging that while a household with two people in it will need more money to sustain the same living standards as one with a single person, the two-person household is unlikely to need double the income.
This analysis uses the modified Organisation for Economic Co-operation and Development (OECD) equivalisation scale (PDF, 165KB).
Mean and median income
The mean measure of income divides the total income of individuals by the number of individuals. A limitation of using the mean is that it can be influenced by just a few individuals with very high incomes and therefore does not necessarily reflect the standard of living of the “typical” person. However, when breaking down changes in income and direct taxes by income decile or types of households, the mean allows for these changes to be analysed in an additive way.
Many researchers argue that growth in median household incomes provides a better measure of how people’s well-being has changed over time. The median household income is the income of what would be the middle person, if all individuals in the UK were sorted from poorest to richest. Median income provides a good indication of the standard of living of the “typical” individual in terms of income.
Retired and non-retired households
A retired household is one where more than 50% of its income is sourced from retired people. A retired person on ETB requires satisfying one of the following criteria:
their self-defined employment status is “Retired” and they are aged over 50 years
their self-defined employment status is “Sick or Injured”, not seeking work and aged at or above the state pension age (SPA)
As such, analysis of the average income of people living in retired households can include much younger people and potentially exclude older people. However, the strength of this measure is that it highlights those individuals who are most likely to be affected by policy, societal or economic changes that disproportionately impact upon pension income.
Back to table of contents6. Measuring this data
This release provides headline estimates of average disposable income. These data are from the our Living Costs and Food Survey (LCF), a voluntary sample survey of around 5,000 private households in the UK. These statistics are assessed fully compliant with the Code of Practice for Official Statistics and are therefore designated as National Statistics.
ONS is currently working on transforming its data on the distribution of household finances. The first part of this work has concentrated on combining the samples from the LCF and another of ONS’s household surveys, the Survey on Living Conditions (SLC) and harmonising the income collection in these questionnaires. This will result in a dataset formed of a sample of around 17,000 households. This first stage of work was carried out during FYE 2018. Work is currently under way to quality assure these data before publishing initial results later this year.
In addition, ONS is working towards linking data from administrative and other non-survey sources, including HMRC Real Time Information (RTI) and DWP benefits data. Although these other sources also have their own limitations, by using them together with surveys we should be able to produce better data on household income. More information on our plans for transforming ONS's household finance statistics is contained within Transformation of ONS household financial statistics: ONS statistical outputs workplan, 2018 to 2019
Back to table of contents7. Strengths and limitations
However, as with all survey-based sources, the data are subject to some limitations. The Living Costs and Food Survey (LCF) is known to suffer from under-reporting at the top and bottom of the income distribution as well as non-response error (see The effects of taxes and benefits upon household income Quality and Methodology Information report for further details of the sources of error). Further, as these data is based on a survey of the private household population, these statistics do not include those living in communal establishments such as care homes and student halls of residence as well as some core groups of the homeless populations.
The Department for Work and Pensions (DWP) also produces an analysis of the UK income distribution in its annual Households below average income (HBAI) publication, using data from its Family Resources Survey (FRS). While the FRS is subject to the same limitations as other survey sources, it benefits from a larger sample size (approximately 19,000 households) than the LCF and, as such, will have a higher level of precision than ETB estimates. In addition, HBAI includes an adjustment for “very rich” households to correct for the under-reporting using data from HM Revenue and Customs (HMRC’s) Survey of Personal Incomes (SPI), although we are exploring similar adjustments as presented in Using tax data to better capture top earners in household income inequality statistics. These differences make HBAI a better source for looking at income-based analysis that does not need a longer time series (the FRS data are available from financial year ending (FYE) 1995) and when looking at smaller sub-groups of the population, particularly at the upper end of the income distribution.
Back to table of contents8. More about household income
Households below average income (HBAI)
Released 22 March 2018
The Department for Work and Pensions produce statistics on the number and percentage of people living in low-income households in the UK.
Effects of taxes and benefits on UK household income – flash estimate: financial year ending 2018
Bulletin | Released on 25 July 2018
Provides provisional estimates of median equivalised disposable income and measures of income inequality, and includes more detail and analysis relating to the economic and policy context in financial year ending 2018.
Transformation of ONS household financial statistics: ONS statistical outputs workplan, 2018 to 2019
Article | Released on 20 June 2018
Information on our plans for transforming ONS’ Household Finance Statistics, including combining the samples from the Living costs and food survey and the Survey on Living Conditions. It also looks at how we are working towards using administrative data from HMRC and Depart for Work and Pensions.
Using tax data to better capture top earners in household income inequality statistics
Article | [Released on 26 February 2018]
Experimental Statistics examining the impact of replacing incomes at the very top of the distribution with tax records information contained within HMRC’s Survey on Personal Incomes (SPI).
9. You may also be interested in
A guide to sources of data on earnings and income
Article | Updated 4 February 2019
For further information on other sources of income and earnings data, including the appropriate uses of and limitations of each data source see Contact Name
Employee earnings in the UK
Statistical bulletins | Updated 25 October 2018
Important measures of employee earnings, using data from the Annual Survey of Hours and Earnings (ASHE). Figures are presented mainly for full-time employees, although some detail for part-time workers is also included.
Centre for Equalities and Inclusion
Article | Released on 12 December 2018
The Centre for Equalities and Inclusion aims to improve the evidence base for understanding equity and fairness in the UK today, enabling new insights into key policy questions. We are a multi-disciplinary convening centre based at Office for National Statistics, bringing together people interested in equalities data and analysis from across central and local government, academia, business and the third sector.
Personal and economic well-being in the UK: February 2019
Statistical bulletins | Updated 4 February 2019
Estimates of the combined findings for personal well-being (October 2017 to September 2018) and economic well-being (July to September 2018) in the UK. This is part of a new series on people and prosperity.
Wealth in Great Britain Wave 5: 2014 to 2016:
Statistical bulletins | Updated 1 February 2018
Main results from the fifth wave of the Wealth and Assets Survey covering the period July 2014 to June 2016.
Family spending in the UK: April 2017 to March 2018
Statistical bulletins | Updated 24 January 2019
Average weekly household expenditure on goods and services in the UK, by region, age, income, economic status, socio-economic class and household composition.