Table of contents
- Main points
- Summary of latest economic well-being indicators
- Things you need to know about this release
- What were the main changes in economic well-being in Quarter 4 2016?
- Spotlight: International comparisons of economic well-being
- Economic sentiment
- Economic well-being indicators already published
- Links to related statistics
- Quality and methodology
1. Main points
- In Quarter 4 (Oct to Dec) 2016, gross domestic product (GDP) in the UK per head increased by 0.5% compared with the previous quarter and 1.2% compared with the same quarter a year ago (Quarter 4 2015).
- Net national disposable income per head increased by 5.9% between Quarter 4 2015 and Quarter 4 2016, mainly due to a £7.6 billion increase in the income received from the UK’s foreign direct investment abroad.
- Real household disposable income per head declined by 0.5% between Quarter 4 2015 and Quarter 4 2016, largely driven by increasing prices of goods and services.
- In Quarter 4 2016, real household spending per head increased 0.5% compared with the previous quarter – despite a fall in real household disposable income of 0.1% over the same period – meaning that it reached its pre-economic downturn level for the first time.
- Looking at economic well-being internationally, growth in real household disposable income (including non-profit institutions serving households (NPISH)) was slower in the UK compared with the OECD countries between Quarter 1 (Jan to Mar) 2010 and Quarter 3 (July to Sept) 2016 – 0.1% and 0.4% average quarterly growth respectively.
- Between Quarter 3 2016 and Quarter 4 2016, consumers reported a worsening in their perception of both the general economic situation and their own financial situation over the last year.
2. Summary of latest economic well-being indicators
This quarter’s data paints a mixed picture for economic well-being in the UK. Overall, whole economy indicators were positive; with growth in gross domestic product (GDP) per head and net national disposable income per head. This hasn’t translated fully to households though; with incomes declining this quarter due mainly to a rise in prices. Despite the fall in income per person, spending increased and returned to the pre-2008 downturn level for the first time. Finally, economic sentiment worsened this quarter with consumers’ confidence in the general economic situation falling and consumers also feeling less favourable about their own financial situation.
Back to table of contents3. Things you need to know about this release
This release reports measures of economic well-being in the UK . Rather than focusing on traditional measures such as gross domestic product (GDP) alone, these indicators aim to provide a more rounded and comprehensive basis for assessing changes in material well-being.
We prefer to measure economic well-being on a range of measures rather than a composite index. The framework and indicators used in this release were outlined in Economic Well-being, Framework and Indicators, published in November 2014.
Our 10 main economic well-being indicators are:
- gross domestic product (GDP) per head – the value of goods and services produced, adjusted for changes in population
- net national disposable income per head – the income available to all residents in the UK, which differs from GDP per head mainly due to adjustments for capital depreciation – such as the day-to-day wear and tear on vehicles and machinery – and the flows of income with the rest of the world - such as inward-income earned by UK investors on assets overseas, and outward-income foreign investors earn on assets in the UK
- real household disposable income per head – the amount of money households have to spend on consumption, or to save and invest, after taxes, National Insurance, pension contributions and interest have been paid
- real household final consumption expenditure per head – household spending on goods and services
- real median equivalised household income – represents the middle of the income distribution and is a good indication of the standard of living of the “typical” household in terms of income
- whole economy net wealth – represents the market value of financial and non-financial assets in the UK and provides an indication of the sustainability of current levels of production and corresponding income flows
- household and non-profit institutions serving households (NPISH) net wealth – market value of financial and non-financial assets in the household and NPISH sector
- consumers’ perception of their personal financial situation over the past 12 months
- unemployment rate – the proportion of those actively looking for a job who are unemployed
- inflation – change in prices over the last month as measured by the Consumer Prices Index including a measure of owner occupiers’ housing costs (CPIH))
This edition of the economic well-being release introduces a number of improvements. First, it focuses more on new data published this quarter, while providing a summary of already existing data in the “Economic well-being indicators already published” section. Second, we will include a “Spotlight” section, which will investigate issues relating to economic well-being in more detail. This quarter we present international comparisons of economic well-being. We welcome any feedback on the new style and any suggestions for further analysis at economic.wellbeing@ons.gov.uk.
Back to table of contents4. What were the main changes in economic well-being in Quarter 4 2016?
Figure 1: 4 measures of economic well-being Q1 (2008) to Q4 (2016)
United Kingdom
Source: Office for National Statistics
Notes:
- Q1 refers to Quarter 1 (January to March), Q2 refers to Quarter 2 (April to June), Q3 (July to September) and Q4 refers to Quarter 4 (October to December).
Download this chart Figure 1: 4 measures of economic well-being Q1 (2008) to Q4 (2016)
Image .csv .xlsReal GDP per head
Real gross domestic product (GDP) per head increased by 0.5% in Quarter 4 (Oct to Dec) 2016 compared with the previous quarter. This was a slightly slower growth rate than the 0.7% quarterly increase seen in GDP, but 0.2 percentage points higher than quarterly growth recorded in Quarter 3 (July to Sept) 2016. GDP per head grew by 1.1% between 2015 and 2016 – down 0.3 percentage points from growth of 1.4% between 2014 and 2015.
Real net national disposable income (NNDI) per head
Real net national disposable income (NNDI) increased by 5.9% between Quarter 4 2016 and Quarter 4 2015, compared with a 1.2% increase in GDP per head over the same period. Looking at 2016 as a whole, NNDI per head increased by 1.5% between 2015 and 2016, down 0.3 percentage points from growth between 2014 and 2015.
There are 2 main differences between GDP per head and NNDI per head.
First, not all income generated by production in the UK will be payable to UK residents. For example, a country whose firms or assets are predominantly owned by foreign investors may well have high levels of production, but a lower national income once profits and rents flowing abroad are taken into account. As a result, the income available to residents would be less than that implied by measures such as GDP.
Second, NNDI per head is adjusted for capital consumption. GDP is “gross” in the sense that it does not adjust for capital depreciation, that is, the day-to-day wear and tear on vehicles, machinery, buildings and other fixed capital used in the productive process. It treats such consumption of capital as no different from any other form of consumption, but most people would not regard depreciation as adding to their material well-being.
Figure 2: Cumulative contributions to growth in Net National Disposable Income per head since Q1 2008, Chain volume measure, Quarter 1 (Jan to Mar) 2008 to Quarter 4 (Oct to Dec) 2016
United Kingdom
Source: Office for National Statistics
Notes:
- Q1 refers to Quarter 1 (January to March), Q2 refers to Quarter 2 (April to June), Q3 refers to Quarter 3 (July to September) and Q4 refers to Quarter 4 (October to December).
Download this chart Figure 2: Cumulative contributions to growth in Net National Disposable Income per head since Q1 2008, Chain volume measure, Quarter 1 (Jan to Mar) 2008 to Quarter 4 (Oct to Dec) 2016
Image .csv .xlsFigure 2 examines how changes in GDP per head, capital consumption per head and net income from abroad per head have influenced NNDI per head since Quarter 1 2008. It should be noted that net income from abroad is comprised of a number of components which aren’t published on a quarterly basis. In the analysis above, net income from abroad is derived using published information on net national disposable income, GDP and capital consumption.
Net income from abroad = Net national disposable income - GDP + capital consumption
Figure 2 shows that the contraction in GDP per head during the economic downturn provided the largest negative cumulative contribution towards a 10% decline in NNDI per head between Quarter 1 2008 and Quarter 1 2009. After Quarter 1 2009, GDP per head recovered – highlighted in the chart by the reduced negative cumulative contribution from GDP per head – while net income from abroad remained steady. As a result, NNDI per head grew by an average of 0.2% between Quarter 1 2009 and Quarter 4 2011. However, following this, the UK’s net income balance with the rest of the world deteriorated. Figure 3 will look more closely at this; however, the effect was to introduce a gap between GDP per head and NNDI per head. Between Quarter 4 2011 and Quarter 4 2015, GDP per head increased by an average of 0.4% per quarter compared with average quarterly growth in NNDI per head of 0.1%. This meant that while GDP per head reached its pre-economic downturn peak in Quarter 3 2015, NNDI per head didn’t reach this yardstick until Quarter 3 2016. More recently, there has been an improvement with the UK’s net income from abroad, so that NNDI per head was 2.2% above its pre-economic downturn level in Quarter 4 2016 compared with GDP per head, which was 1.7% above its pre-economic downturn level in the same quarter.
Figure 3: Balance of primary incomes and components, £millions, from Quarter 1 (Jan to Mar) 2010 to Quarter 4 (Oct to Dec) 2016
United Kingdom
Source: Office for National Statistics
Notes:
- Q1 refers to Quarter 1 (January to March), Q2 refers to Quarter 2 (April to June), Q3 refers to Quarter 3 (July to September) and Q4 refers to Quarter 4 (October to December).
Download this chart Figure 3: Balance of primary incomes and components, £millions, from Quarter 1 (Jan to Mar) 2010 to Quarter 4 (Oct to Dec) 2016
Image .csv .xlsLooking at the deterioration in net income from abroad, Figure 3 presents the balance of primary incomes and its main components. It should be noted that the balance of primary incomes is only one component of net foreign income from abroad, although it is generally the largest. Further, balance of primary incomes is in current prices, whereas net income from abroad is calculated from series that have been adjusted for the change in prices.
Figure 3 shows that the balance of primary incomes declined from £8,580 million in Quarter 2 2011 to reach a deficit of £12,353 million in Quarter 4 2015. After this it increased by £11,318 million to a deficit of £1,035 million in Quarter 4 2016. A major factor in the decline in the balance of primary income was a fall in the direct investment earnings balance – earnings from cross-border investments made by residents and businesses from one country into another, with the aim of establishing a lasting relationship.
Since 1997, the balance of earnings on foreign direct investment (FDI) (the difference between earnings from direct investment abroad and from foreign direct investment in the UK) made a positive contribution to the UK current account, partly offsetting negative contributions from the other major components. However, the surplus in FDI earnings has fallen since 2011, turning negative in late 2015 – the first deficit since Quarter 4 2008. This deterioration is attributed to falling earnings for UK residents from direct investment abroad and an increase in foreign earnings on direct investment in the UK. More information is available in our analysis of the drivers behind the fall in direct investment earnings and their impact on the UK's current account deficit release.
Household income
Unless stated otherwise, analysis of real household disposable income (RHDI) in this bulletin excludes non-profit institutions serving households (NPISH). We consider this a better indicator of economic well-being as it focuses more on the household experience than the traditional measure, which includes the NPISH sector. Real household and NPISH disposable income per head will continue to be published alongside RHDI per head (excluding NPISH) in the datasets.
In Quarter 4 2016, RHDI per head declined by 0.5% compared with the same quarter a year ago (Quarter 4 2015), but was 5.2% above its pre-economic downturn level. On an annual basis, RHDI per head increased 1.0% in 2016 compared with 2015. This is down from 3.1% growth between 2014 and 2015.
Looking at the historical context, as GDP began to fall in mid-2008, Figure 1 highlights that RHDI per head remained relatively resilient. By Quarter 2 2009, RHDI per head was 3.2% above its pre-economic downturn level. This initial improvement in real household income per head was a result of several factors.
Firstly, household incomes were buoyed by falling mortgage repayments as a result of historic lows in the interest rate. Additionally, automatic stabilisers – such as reduced Income Tax payments and increased benefits as a result of lower employment – supported incomes during worsening conditions in the labour market. However, moving into early 2011, the impact of these factors wore off and inflation rose. Prices grew more strongly than household income and therefore, over time, people found that their income purchased a lower quantity of goods and services.
More recently, growth in household income has begun to wane – average quarterly growth between Quarter 3 2015 and Quarter 4 2016 was 0.0% compared with 0.9% between Quarter 1 2014 and Quarter 3 2015. As explained in the previous edition of the economic well-being bulletin, recent slowing in household income per head has been mainly driven by an increase in the general price level.
Household expenditure
While income is an important measure of material well-being, it is important to also consider how much households actually consume. ONS analysis presented new findings on the relationship between personal well-being, household income and expenditure. Using regression analysis, it concluded that household expenditure appeared to have a stronger relationship with personal well-being than household income.
In Quarter 4 2016, real household spending per head (excluding non-profit institutions serving households) grew 0.5% compared with the previous quarter, continuing the general upward trend seen since Quarter 3 2011. As highlighted in Figure 1, real household spending per head (excluding NPISH) reached its pre-economic downturn level in Quarter 4 2016 for the first time after Quarter 1 2008. This is despite real household disposable income per head (excluding NPISH) being 5.2% above its pre-economic downturn level in Quarter 4 2016.
Back to table of contents5. Spotlight: International comparisons of economic well-being
Figure 4: GDP per head, UK and a range of selected countries, Quarter 1 (Jan to Mar) 2007 to Quarter 3 (July to Sept) 2016
Source: Office for National Statistics, OECD
Download this chart Figure 4: GDP per head, UK and a range of selected countries, Quarter 1 (Jan to Mar) 2007 to Quarter 3 (July to Sept) 2016
Image .csv .xlsThis section compares 2 headline indicators of economic well-being – gross domestic product (GDP) per head and real household disposable income (RHDI) (including non-profit institutions serving households (NPISH)) – in the UK and a selection of EU and Organisation for Economic Co-operation and Development (OECD) countries.
Figure 4 shows that the recovery in GDP per head in the UK has been weaker than the total of the OECD countries and more comparable with the European Union. Average quarterly growth in GDP per head was 0.2% across the OECD countries between Quarter 1 (Jan to Mar) 2007 and Quarter 3 (July to Sept) 2016, compared with 0.1% in the UK and EU over the same period.
However, the UK, EU and the total of OECD countries have followed different growth paths since 2007. Compared with the total of OECD countries and EU, GDP per head contracted more sharply in the UK during the economic downturn, but then recovered more quickly. Between Quarter 1 2007 and Quarter 4 (Oct to Dec) 2011, average quarterly growth in GDP per head in the UK was negative 0.2%, compared with 0.0% in the EU and the total of OECD countries respectively. Between Quarter 1 2012 until Quarter 3 2016, growth in GDP per head in the UK was 0.4% per quarter, compared with 0.3% and 0.2% in the total of OECD countries and EU respectively.
Poland and Greece represent 2 extremes in growth in GDP per head since 2007. Poland was largely unaffected by the economic downturn and recorded 0.8% average annual growth in GDP per head between Quarter 1 2007 and Quarter 3 2016 – the largest average annual growth of all OECD countries. GDP per head in Greece, on the other hand, contracted by 0.7% on average per quarter between Quarter 1 2007 and Quarter 3 2016. Further, GDP per head in Greece contracted in 25 of the 38 quarters between Quarter 1 2007 and Quarter 3 2016 – the highest number of all OECD countries.
Figure 5: Real household (including NPISH) disposable income per head, UK and selected countries, Quarter 1 (Jan to Mar) 2007 to Quarter 3 (July to Sept) 2016
Source: Office for National Statistics, OECD, Eurostat
Download this chart Figure 5: Real household (including NPISH) disposable income per head, UK and selected countries, Quarter 1 (Jan to Mar) 2007 to Quarter 3 (July to Sept) 2016
Image .csv .xlsRHDI (including NPISH) growth in the UK was relatively weak compared with other OECD countries following the economic downturn. Figure 5 highlights that, between Quarter 1 2010 and Quarter 3 2016, RHDI (including NPISH) per head in the UK grew by 0.1% per quarter on average compared with 0.4% in the total of OECD countries.
Stronger growth in the OECD total of countries is largely accounted for by Chile, Poland and Norway – 1.1%, 0.6%, and 0.5% average quarterly growth between Quarter 1 2010 and Quarter 3 2016 respectively. On the other hand, Greece, which recorded the lowest growth rate of GDP per head over recent years, also recorded the lowest growth rate in RHDI (including NPISH) per head. RHDI (including NPISH) per head contracted by an average of 1.5% per quarter between Quarter 1 2010 and Quarter 3 2016.
Figure 6: Contributions to real household (including NPISH) disposable income growth, UK, Greece and Poland, Quarter 1 (Jan to Mar) 2003 to Quarter 3 (July to Sept) 2016

Source: Office for National Statistics, Eurostat, European Central Bank
Download this image Figure 6: Contributions to real household (including NPISH) disposable income growth, UK, Greece and Poland, Quarter 1 (Jan to Mar) 2003 to Quarter 3 (July to Sept) 2016
.png (25.6 kB) .xlsx (10.3 kB)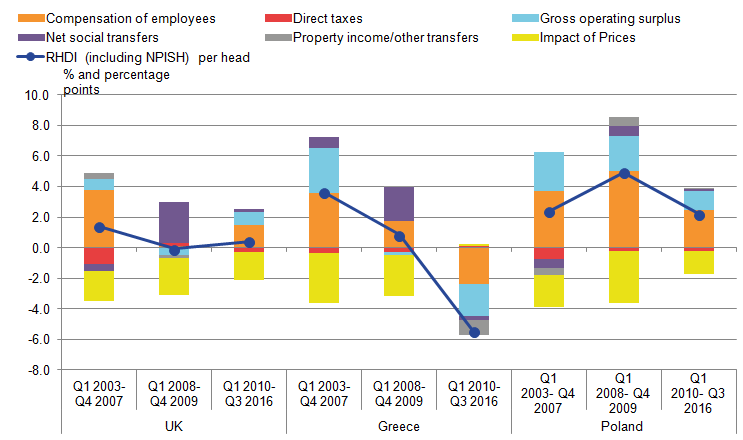
Figure 6 examines the role of different contributions to RHDI (including NPISH) per head growth for the UK, Greece and Poland between Quarter 1 2003 and Quarter 3 2016. It shows that for all 3 countries, growth in compensation of employees per head provided the strongest contribution to RHDI (including NPISH) growth per head before the economic crisis. Compensation of employees includes the wages and salaries payable in cash or in kind to an employee in a return for work done and the social insurance contributions payable by employers.
During the years of economic downturn – 2008 and 2009 – RHDI (including NPISH) per head in UK and Greece was supported by an increase in net social transfers amidst falling contributions from compensation of employees. The story in Poland, on the other hand, was remarkably different. As shown in Figure 5, GDP per head did not contract in Poland during 2008 and 2009, which perhaps explains stronger contributions from compensation of employees.
After 2009, the impact of net transfers began to decline in Greece and the UK. However, the UK’s recovering economy supported a return to positive contributions from compensation of employees and gross operating surplus (which includes mixed income). The only component to support growth in RHDI (including NPISH) per head in Greece was a fall in prices. As a result RHDI (including NPISH) per head contracted by an average of 5.5% per quarter compared with growth of 0.4% in the UK.
Back to table of contents6. Economic sentiment
It is important to consider sentiment, along with other measures of economic well-being, to better understand how changes in official measures of the economy are perceived by individuals. Information regarding perceptions of the economy are sourced from the Eurobarometer Consumer Survey, conducted by GFK on behalf of the European Commission. The Quality and Methodology section provides more information regarding the Eurobarometer Consumer Survey.
General economic situation and perception of financial situation
The Eurobarometer Consumer Survey asks consumers their views on the state of the general economic situation over the previous 12 months. A positive balance means that consumers perceived an improvement within the economy, a zero balance indicates no change and a negative balance indicates a perceived worsening.
Figure 7: Consumer perceptions of general economic situation and their own financial situation over last 12 months, January 2006 to December 2016
Source: European Commission
Notes:
- The source is the Eurobarometer Consumer Survey, which is collected by GfK for the European Commission. Further information can be found in background note 5.
- A negative balance means that, on average, respondents reported the general economic situation. A positive balance means they reported it improved and a zero balance indicators no change.
Download this chart Figure 7: Consumer perceptions of general economic situation and their own financial situation over last 12 months, January 2006 to December 2016
Image .csv .xlsBetween Quarter 3 (July to Sept) 2016 and Quarter 4 (Oct to Dec) 2016, the balance fell from negative 18.8 to negative 23.3, suggesting that households’ perception of the general economic situation has worsened, potentially as a result of the decline in UK’s currency and rising inflation.
The series had been on a general upwards trend in recent years until April 2015, before the trend turned negative in July 2015. Analysis by GFK suggests that the negative trend could potentially be explained by economic uncertainty abroad and later, in 2016, reduced confidence following the European referendum.
The survey also asks respondents about their own financial situation. This has generally been positive since May 2015 (it was negative in July and August 2016), ending a 7 year negative balance since February 2008. In the latest quarter, the balance fell from 1.6 in September 2016 to 0.7 in December 2016, indicating that consumers are less positive about their financial situation. Overall, these indicators taken together suggest that respondents feel that the general economic situation has worsened in recent quarters and that their own financial situation is less certain.
Perception of inflation
The Eurobarometer Consumer Survey also asks respondents about their perception of prices over the previous 12 months. A positive balance suggests that consumers perceive prices to have increased over the previous 12 months, while a negative balance suggests the opposite. In Quarter 4 2016, the balance increased to positive 7.8 from negative 5.3 in Quarter 3 2016.
Figure 8: Comparison between CPIH and individual’s perception of price trends over the last 12 months, January 2006 to December 2016
United Kingdom
Source: Office for National Statistics, European Commission
Notes:
- The Eurobarometer Consumer Survey is collected by GfK for the European Commission.
Download this chart Figure 8: Comparison between CPIH and individual’s perception of price trends over the last 12 months, January 2006 to December 2016
Image .csv .xlsConsumers’ perception of inflation remained negative for 19 months between April 2015 and November 2016. This corresponds with a low CPIH rate during this period – the 12-month rate was under 1% from December 2014 to July 2016 and has steadily increased since October 2015.
Back to table of contents7. Economic well-being indicators already published
Between 2014 and 2015, the total net worth of the UK increased by 5.9% to £8.3 trillion. The largest contribution to this was from the household and non-profit institutions serving households (NPISH) sector, which contributed 4.9 percentage points to the total growth.
Between 2014 and 2015, household wealth increased by 4.1%. This was as a result of a 6.5% increase in the amount of wealth in non-financial assets (for example, buildings and machinery).
In the year to December 2016, the 12-month CPIH (Consumer Prices Index with owner occupiers’ housing costs) rate increased from 1.3% to 1.8% to reach its highest level since June 2014. The increase in prices was mainly driven by a rise in prices for transport and restaurant and hotels.
The unemployment rate for those aged 16 to 64 remained unchanged at 4.9% between the 3 months to September 2016 and the 3 months to December 2016. The employment rate (the proportion of people aged from 16 to 64 who were in work) was 74.6% in the 3 months to December 2016 – the highest rate since comparable records began in 1971.
The median UK household disposable income was £26,300 in the financial year ending 2016 (2015/16); this was £600 higher than the previous year and £1,000 higher than the pre-downturn value of £25,400 in the financial year ending 2008 (2007/08) (after accounting for inflation and household composition).
The wealthiest 10% of households owned 45% of aggregate total wealth in July 2012 to June 2014 and were 2.4 times wealthier than the second wealthiest 10%. Over the same period the wealthiest 10% of households were 5.2 times wealthier than the bottom 50% of households (the bottom 5 deciles combined), who owned 9% of aggregate total wealth.
Back to table of contents9. Quality and methodology
Release policy
The data used in this version of the release are the latest available at 31 March 2017. This release uses the latest population estimates with the exception of the latest year where population projections are used and are consistent with mid-year estimates published 23 June 2016. These may be revised later once ONS publishes headline population estimates for 2017.
Basic quality and methodology information
Basic quality and methodology information for all indicators in this statistical bulletin can be found on our website:
- National Accounts Quality and methodology Information report
- Consumer Price Indices Quality and methodology Information report
- Wealth and Assets Survey Quality and methodology Information report
- Effects of Taxes and Benefits Quality and methodology information report
- Labour Market Quality and methodology Information reports
These contain important information on:
- the strengths and limitations of the data and how it compares with related data
- users and uses of the data
- how the output was created
- the quality of the output including the accuracy of the data
Revisions and reliability
All data in this release will be subject to revision in accordance with the revisions policies of their original release. Estimates for the most recent quarters are provisional and are subject to revision in the light of updated source information. We currently provide an analysis of past revisions in statistical bulletins, which present time series. Details of the revisions are published in the original statistical bulletins.
Most revisions reflect either the adoption of new statistical techniques or the incorporation of new information, which allows the statistical error of previous estimates to be reduced.
Only rarely are there avoidable “errors”, such as human or system failures and such mistakes are made quite clear when they do occur.
For more information about the revisions policies for indicators in this release:
- National Accounts revisions policy – covers indicators from the Quarterly National Accounts, UK Economic Accounts and the National Balance Sheet
- Wealth and Assets Survey revisions policy – covers indicators on the distribution of wealth
- Effect of Taxes and Benefits on household incomes revisions policy – covers indicators on the distribution of income
- Labour Market Statistics revisions policy – covers indicators from labour market statistics
- Consumer Price Inflation - revisions policy – covers indicators from consumer price indices
Our Revisions policies for economic statistics webpage is dedicated to revisions to economic statistics and brings together our work on revisions analysis, linking to articles, revisions policies and important documentation from the former Statistics Commission's report on revisions.
Data that come from the Eurobarometer Consumer Survey and Understanding Society releases are not subject to revision as all data are available at the time of the original release. These data will only be revised in light of methodological improvements or to correct errors. Any revisions will be made clear in this release.
Interpreting the Eurobarometer Consumer Survey
The Eurobarometer Consumer Survey, sourced from GFK on behalf of the European Commission, asks respondents a series of questions to determine their perceptions on a variety of factors, which collectively give an overall consumer confidence indicator. For each question, an aggregate balance is given which ranges between negative 100 and positive 100.
Balances are the difference between positive and negative answering options, measured as percentage points of total answers. Values range from negative 100, when all respondents choose the negative option (or the most negative one in the case of 5-option questions) to positive 100, when all respondents choose the positive (or the most positive) option.
The questions used in this release are:
Question 1: How has the financial situation of your household changed over the last 12 months? It has...
- got a lot better
- got a little better
- stayed the same
- got a little worse
- got a lot worse
- don’t know
Question 3: How do you think the general economic situation in the country has changed over the past 12 months? It has...
- got a lot better
- got a little better
- stayed the same
- got a little worse
- got a lot worse
- don’t know
Question 5: How do you think that consumer prices have developed over the last 12 months? They have...
- risen a lot
- risen moderately
- risen slightly
- stayed about the same
- fallen
- don’t know
Further information on this consumer survey is available from the Business and Consumer Survey section of the European Commission website.
Measuring national well-being
This article is published as part of our Measuring National Well-being programme. The programme aims to produce accepted and trusted measures of the well-being of the nation – how the UK as a whole is doing. Further information on Measuring National Well-being is available on our website with a full list of well-being publications.