Table of contents
- Main points
- Things you need to know about this release
- Cash-basis RHDI increased by 0.6% in the latest quarter, but has remained relatively flat since the second half of 2015
- Cash-basis RHDI per head increased by 0.4% in the latest quarter but showed no growth compared with Quarter 2 (Apr to June) 2017
- The cash-basis household saving ratio was negative for the third successive quarter in Quarter 2 (Apr to June) 2018
- Quality and methodology
- Acknowledgements
1. Main points
- Cash-basis real household disposable income (RHDI) increased by 0.6% in Quarter 2 (April to June) 2018; this was a greater increase than national accounts RHDI which increased by 0.4%.
- The increase in RHDI in the latest quarter was driven primarily by increases in social assistance benefits in cash and wages and salaries.
- Though cash-basis RHDI has increased in successive quarters, it has remained relatively flat since the second half of 2015.
- In 2017, cash-basis RHDI fell by 0.6%; this was the second successive year of decline and is consistent with successive annual falls in national accounts RHDI.
- The cash-basis saving ratio was negative 0.6% in the latest quarter; compared with negative 0.8% in the previous quarter.
- This was the third successive quarter in which the cash-basis saving ratio has been negative, meaning that households’ spending exceeded their gross disposable income, on a cash basis, in Quarter 2 (April to June) 2018.
2. Things you need to know about this release
This bulletin provides Experimental Statistics on the impact of removing "imputed" transactions from real household disposable income (RHDI) and the saving ratio to better represent the economic experience of UK households. It is an update to data for the experimental publication Alternative measures of UK households’ income and saving: January to March 2018, which was published on 04 July 2018. These data estimate disposable income and the saving ratio less the transactions that are imputed and unobserved by households. The following section, as well as Section 6 explain the removal of such transactions in greater detail.
This bulletin compares experimental cash-basis measures of RHDI and the saving ratio with the internationally comparable national accounts defined methodology, as published in the UK Quarterly sector accounts: April to June 2018 on 28 September 2018.
Today we are also releasing an article describing wider measures of economic well-being. These measures focus on per head values to highlight the household perspective of economic statistics, including real household disposable income.
While there are similarities in the presentation of these data and those in this publication, the use of different methodologies mean caution should be used when comparing data across these publications. Some of these differences include the exclusion of transactions, the use of different deflators and data presented on an aggregate and per head basis.
Why do we estimate cash measures of RHDI and the saving ratio?
Estimates of RHDI and the saving ratio published in the Quarterly sector accounts include transactions that are not directly observed by households. For example, imputed rental represents the value of housing services that owner-occupiers derive from their homes. This is the amount that they would have to pay in rental to achieve the same consumption of housing services. While this concept is important when measuring economic activity and in like-for-like international comparisons, it is not expenditure (or income) directly observed by homeowners. As a result, the national accounts measure of RHDI can differ from the perceived experience of households.
We therefore consider “cash-basis RHDI”. This measure removes imputed rental and other imputed transactions resulting in a measure of RHDI that is a closer representation of disposable income as measured by social surveys. This is mainly achieved by following guidance from the Organisation for Economic Co-operation and Development Framework for Statistics on the Distribution of Household Income, Consumption and Wealth and the United Nations Economic Commission for Europe (UNECE) Canberra Group Handbook on Household Income Statistics.
We also consider a “cash-basis saving ratio”. This measure removes imputed transactions from the use of disposable income account. For example, the adjustment for the change in pension entitlements is removed, while imputed rental and financial intermediation services indirectly measured (FISIM) are both removed from the national accounts measure of final consumption expenditure. Their removal result in a measure of gross saving that reflects households’ saving (excluding pension contributions) in the respective quarter or year.
Estimates within this release
Data within this bulletin are estimated in current prices (also called nominal terms), except for cash-basis RHDI, which is estimated by deflating gross disposable income using the cash basis households’ final consumption expenditure implied deflator. This cash-basis deflator excludes the effect of price changes that are not directly experienced by households, that is, imputed rentals of housing and FISIM. Cash-basis RHDI therefore better reflects the real purchasing power of households in terms of the quantity of goods and services they would be able to purchase if observed prices remained constant over time.
Current price series are expressed in terms of the prices during the time period being estimated. In other words, they describe the prices recorded at the time of production or consumption and include the effect of price inflation over time. RHDI, on the other hand, is a measure of the real purchasing power of households’ income and it enables users to make comparisons of households’ disposable income over time.
All data in this bulletin are adjusted for seasonality, unless otherwise stated. Seasonal adjustment removes seasonal or calendar effects from data to enable more meaningful comparisons over time.
The Population estimates for UK, England and Wales, Scotland and Northern Ireland used in this release are those published on 28 June 2018 and the population projections used are those published on 26 October 2017.
Revisions within this release
This bulletin includes new data for the latest available quarter, Quarter 2 (Apr to June) 2018. It also includes revisions from Quarter 1 (Jan to Mar) 2017 onwards in line with the National Accounts Revisions Policy.
Back to table of contents3. Cash-basis RHDI increased by 0.6% in the latest quarter, but has remained relatively flat since the second half of 2015
Cash-basis real household disposable income (RHDI) increased by 0.6% in Quarter 2 (Apr to June) 2018, compared with the previous quarter. National accounts RHDI increased by 0.4% over the same period as gross disposable income increased at a faster pace than price rises. For both measures, this marked a slowdown in growth compared with Quarter 1 (Jan to Mar) 2018, when cash-basis RHDI increased by 0.8% and national accounts RHDI grew by 0.7%. Comparing on a quarter on same quarter a year ago basis, both measures of RHDI increased by 0.6% in Quarter 2 2018.
Figure 1: Quarter on previous quarter growth in cash-basis real household disposable income and national accounts real household disposable income, percent
Quarter 2 (Apr to June) 2013 to Quarter 2 (Apr to June) 2018
Source: Office for National Statistics
Notes:
- Q1 refers to Jan to Mar, Q2 refers to Apr to June, Q3 refers to July to Sept, Q4 refers to Oct to Dec.
Download this chart Figure 1: Quarter on previous quarter growth in cash-basis real household disposable income and national accounts real household disposable income, percent
Image .csv .xlsCash-basis gross household disposable income (GHDI) increased, quarter on quarter, by £1.8 billion in Quarter 2 2018. Much of this growth was attributable to an increase of £0.9 billion in social assistance benefits in cash (a component of social benefits other than transfers in kind) and an increase in wages and salaries of £0.7 billion. This was partially offset by a decrease in dividends received by households of £0.7 billion.
The increase in cash-basis GHDI contributed 0.7 percentage points to the quarter on previous quarter growth in cash-basis RHDI, partially offset by a 0.1 percentage point increase in inflation as measured by the cash-basis households’ final consumption expenditure implied deflator. As shown in Figure 2, this quarter saw a moderation in both the increase in cash-basis gross disposable income growth and the rate of price increases compared with the previous quarter. For a further explanation of the calculation of cash-basis RHDI, please see Section 6.
National accounts GHDI contributed 0.6 percentage points to the quarterly growth in national accounts RHDI, partially offset by a 0.2 percentage point increase in inflation as measured by the households’ final consumption expenditure implied deflator.
While national accounts GHDI increased by £1.9 billion in Quarter 2 2018, cash-basis GHDI increased by slightly less, £1.8 billion. The difference in the quarterly growth between the two series is explained by the exclusion of small increases in imputed transactions (£0.4 billion), partially offset by a fall of £0.2 billion in the net service charge paid by households to banks when depositing and borrowing money (known as Financial Intermediation Services Indirectly Measured (FISIM)). For a further explanation of the cash-basis GHDI methodology, see Section 6.
Figure 2 shows the impact of inflation (the cash-basis households’ final consumption expenditure implied deflator) on cash-basis gross disposable income to calculate real household disposable income over the past five years. This chart corresponds to Figure 1 in the Quarterly Sector Accounts bulletin which shows the impact of inflation on real households’ disposable income on a national accounts basis.
Figure 2: Contributions to cash-basis real household disposable income growth, quarter on previous quarter, percentage points
Quarter 2 (Apr to June) 2013 to Quarter 2 (Apr to June) 2018
Source: Office for National Statistics
Notes:
- Sum of contributions to cash basis real household disposable income may not add to totals due to rounding.
- Q1 refers to Jan to Mar, Q2 refers to Apr to June, Q3 refers to July to Sept, Q4 refers to Oct to Dec.
Download this chart Figure 2: Contributions to cash-basis real household disposable income growth, quarter on previous quarter, percentage points
Image .csv .xlsDespite successive quarters of RHDI growth on both a cash basis and national accounts basis, the longer-term trend is of relatively flat cash-basis RHDI from the second half of 2015. Figure 3 illustrates the quarterly value of cash-basis RHDI and its quarterly growth from Quarter 2 2013 to Quarter 2 2018.
Figure 3: Cash-basis real household disposable income (RHDI), £ billion, and quarter on previous quarter growth in cash-basis real household disposable income, percentage points
Quarter 2 (Apr to June) 2013 to Quarter 2 (Apr to June) 2018
Source: Office for National Statistics
Notes:
- Sum of contributions to cash basis real household disposable income may not add to totals due to rounding.
- Q1 refers to Jan to Mar, Q2 refers to Apr to June, Q3 refers to July to Sept, Q4 refers to Oct to Dec.
Download this chart Figure 3: Cash-basis real household disposable income (RHDI), £ billion, and quarter on previous quarter growth in cash-basis real household disposable income, percentage points
Image .csv .xlsBetween Quarter 2 2013 to Quarter 3 (July to Sept) 2015, the average quarterly growth in cash-basis RHDI was 1.3%. However, between Quarter 4 (Oct to Dec) 2015 and Quarter 2 2018, the average quarterly growth fell to negative 0.2%. That cash-basis RHDI has been relatively flat over the past three years means that households have not experienced an increase in their purchasing power during this time.
Both cash-basis and national accounts RHDI declined for successive years in 2016 and 2017. On a cash basis, RHDI fell by 0.3% in 2016 and by 0.6% in 2017. On a national accounts basis, RHDI fell by 0.2% in 2016 and 0.1% in 2017. For both measures, this marked the first time since 2011 that RHDI declined in successive years.
Revisions to cash-basis real household disposable income (RHDI)
This bulletin includes revisions to data from Quarter 1 (Jan to Mar) 2017 in line with the National Accounts Revisions Policy.
In the five quarters open to revisions, cash-basis RHDI was revised up by an average of £0.9 billion. Cash-basis RHDI was revised up in four of the five quarters; there was a small downward revision of £0.1 billion to cash RHDI in Quarter 4 (Oct to Dec) 2017.
Figure 4 shows that revisions to wages and salaries were the main source of these revisions, with an average upward revision of £1.9 billion per quarter as new data for the public sector have been incorporated from Quarter 1 2017. Additionally, the alignment of private sector wages and salaries to comparable labour market data has been reviewed, also resulting in upward revisions to wages and salaries in all quarters.
Figure 4: Impact of revisions to cash-basis real household disposable income, £ billion
Quarter 1 (Jan to Mar) 2017 to Quarter 1 (Jan to Mar) 2018
Source: Office for National Statistics
Notes:
- Sum of contributions to cash-basis real household disposable income may not add to totals due to rounding.
- Q1 refers to Jan to Mar, Q2 refers to Apr to June, Q3 refers to July to Sept, Q4 refers to Oct to Dec.
Download this chart Figure 4: Impact of revisions to cash-basis real household disposable income, £ billion
Image .csv .xlsRevisions to the cash-basis households’ final consumption expenditure implied deflator were on average negative £0.1 billion throughout the five quarters, while the impact of revisions to other transactions were, on average, negative £1.0 billion.
The largest impact of revisions on quarter on previous quarter growth rates were in Quarter 1 (Jan to Mar) 2017, from negative 1.3% to negative 0.8% and in Quarter 4 (Oct to Dec) 2017, from negative 0.3% to negative 0.8%.
The difference between revisions to national accounts RHDI and cash-basis RHDI are explained by the exclusion of upward revisions to the transactions excluded from cash-basis RHDI, the largest of which were upward revisions to gross operating surplus of £0.4 billion, on average, across the five quarters.
Back to table of contents4. Cash-basis RHDI per head increased by 0.4% in the latest quarter but showed no growth compared with Quarter 2 (Apr to June) 2017
Real household disposable income (RHDI) per head is calculated by dividing RHDI by the population estimate and projections, which are outlined in Section 2 of this bulletin. RHDI per head increased, quarter on previous quarter, on both a cash basis and national accounts basis in Quarter 2 (Apr to June) 2018. Cash-basis RHDI per head increased by 0.4%, while RDHI per head on a national accounts basis increased by 0.2%. As is usually the case, the effect of population changes means that RHDI per head growth is slightly weaker than RHDI growth.
Cash-basis RHDI per head was flat between Quarter 2 2017 and Quarter 2 2018 while national accounts RHDI per head fell by 0.1% during the same period. For both measures, RHDI per head was about the same value as it was in Quarter 1 (Jan to Mar) 2016.
Back to table of contents5. The cash-basis household saving ratio was negative for the third successive quarter in Quarter 2 (Apr to June) 2018
For the third successive quarter, the cash-basis household saving ratio was negative in Quarter 2 (Apr to June) 2018. The last time such a sequence occurred was between Quarter 2 2007 to Quarter 1 (Jan to Mar) 2008, when the cash-basis saving ratio was negative for four successive quarters. A negative cash-basis saving ratio indicates that when imputed transactions and pension savings are removed from households’ spending and saving, households’ spending continued to exceed their gross disposable income in the latest quarter.
In Quarter 2 2018, the cash-basis saving ratio was negative 0.6%. This represents an increase compared with the previous two quarters; the cash-basis saving ratio was negative 1.0% in Quarter 4 (Oct to Dec) 2017, and negative 0.8% in Quarter 1 2018. While the cash-basis saving ratio remains negative, it is not an historically low cash-basis saving ratio; it has been lower in fifteen quarters since Quarter 1 1997, and was lowest in Quarter 1 1999 when it was negative 3.3%. In comparison, the national accounts saving ratio increased to 3.9% in Quarter 2 2018 from 3.6% in Quarter 1 2018. This was the third-lowest since Quarter 1 1997, and the fourth-lowest since we first began recording the national accounts saving ratio in 1963. It should be noted that Quarter 1 1997 is the first quarter for which cash-basis saving ratio data is available.
Figure 5 shows the quarterly cash-basis saving ratio and national accounts saving ratio from Quarter 1 1997 to Quarter 2 2018.
Figure 5: UK households’ cash-basis saving ratio and national accounts saving ratio, quarterly, seasonally adjusted, percent
Quarter 1 (Jan to Mar) 1997 to Quarter 2 (Apr to June) 2018
Source: Office for National Statistics
Notes:
- Q1 refers to Jan to Mar, Q2 refers to Apr to June, Q3 refers to July to Sept, Q4 refers to Oct to Dec.
Download this chart Figure 5: UK households’ cash-basis saving ratio and national accounts saving ratio, quarterly, seasonally adjusted, percent
Image .csv .xlsThe increase in the cash-basis saving ratio in the latest quarter was the result of gross disposable income increasing by more than households’ spending. Cash-basis gross disposable income increased by £1.8 billion, partially offset by a £1.4 billion increase in cash-basis final consumption expenditure. This led to an increase in the money households had available to save, known as cash-basis gross saving, of £0.4 billion.
The largest upward contributions to the £1.8 billion increase in cash-basis gross disposable income came from social assistance benefits received, which increased by £0.9 billion and a £0.7 billion increase in wages and salaries paid to households. These increases were partially offset by a £0.7 billion decrease in dividends paid to households. The £1.4 billion increase in cash-basis final consumption expenditure was mainly driven by life insurance and, to a lesser extent, transport expenditure.
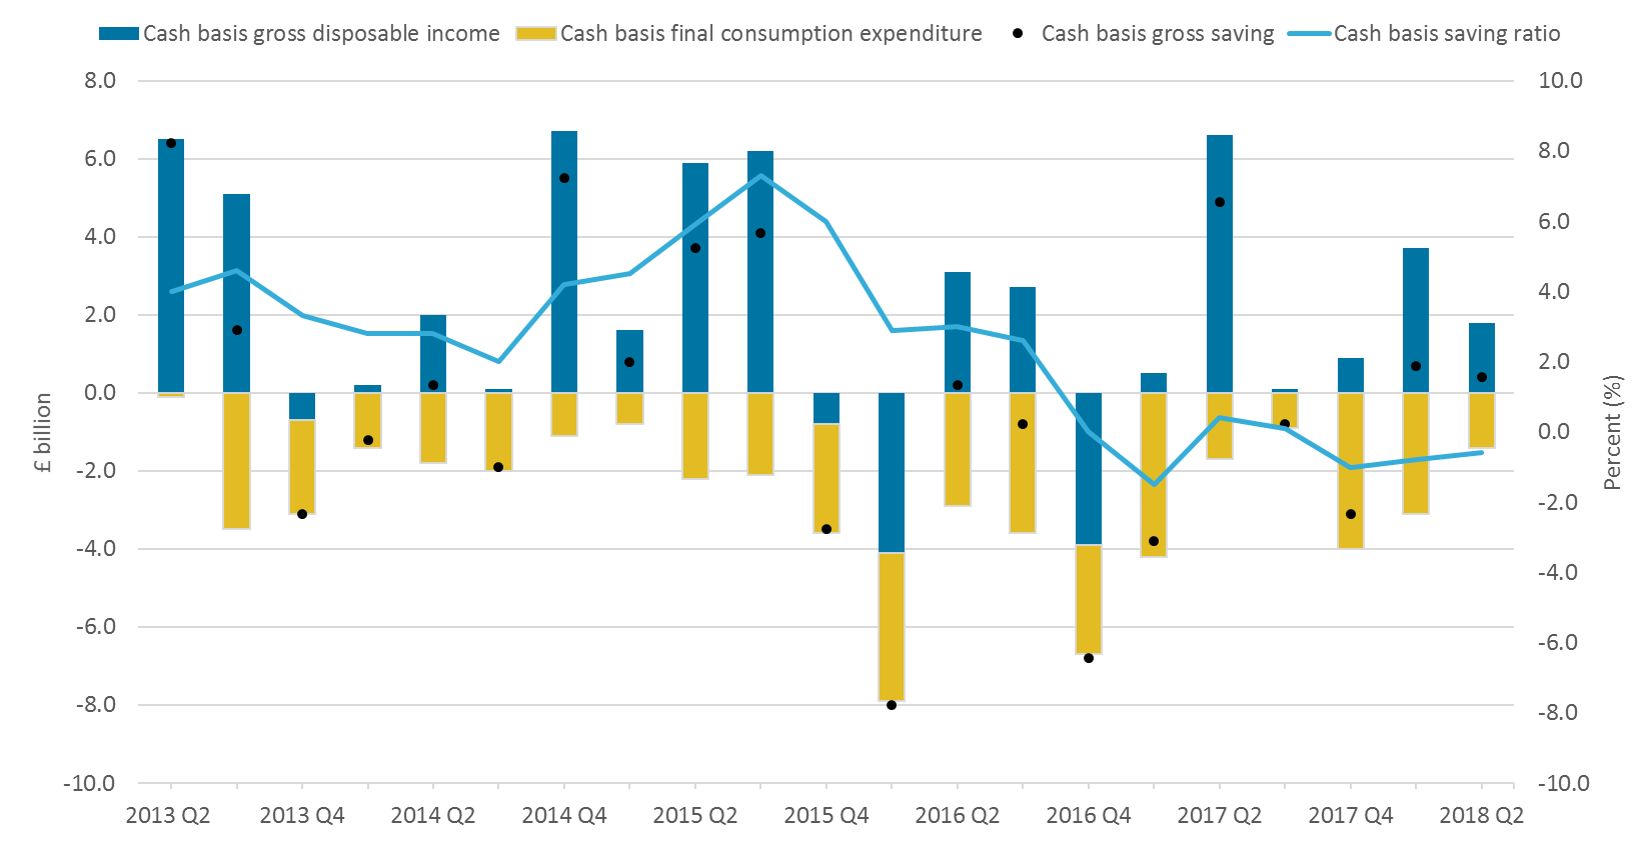
Figure 6 shows the quarterly changes in cash-basis gross disposable income, cash-basis final consumption expenditure and cash-basis gross saving, and how this is reflected in movements in the cash-basis saving ratio. This corresponds with Figure 5 in the Quarterly Sector Accounts bulletin, which shows the quarterly contributions to the national accounts saving ratio.
Increases in gross disposable income increase gross saving, and therefore the saving ratio, whereas increases in spending reduce households’ gross saving and the saving ratio. These changes, quarter on quarter, are represented by the stacked bars. The dots represent the net position of these bars because gross saving is gross disposable income less final consumption expenditure.
Figure 6: Contributions to the cash-basis households’ saving ratio, seasonally adjusted, £ billion, percent
Quarter 2 (Apr to June) 2013 to Quarter 2 (Apr to June) 2018
Source: Office for National Statistics
Notes:
- Cash basis saving ratio calculated as cash basis gross saving divided by cash basis gross disposable income.
- Cash basis gross saving calculated as cash basis gross disposable income minus cash basis final consumption expenditure.
- Saving ratio (%) refers to the axis on the right-hand side (RHS). All other series refer to the axis on the left-hand side (LHS).
- Q1 refers to Jan to Mar, Q2 refers to Apr to June, Q3 refers to July to Sept, Q4 refers to Oct to Dec.
Download this image Figure 6: Contributions to the cash-basis households’ saving ratio, seasonally adjusted, £ billion, percent
.png (124.7 kB) .xlsx (116.0 kB)
The increase in the cash-basis saving ratio of 0.2 percentage points in the latest quarter, was marginally smaller than the 0.3 percentage point increase in the national accounts saving ratio. The 0.1 percentage point difference is explained by the removal of transactions in the cash methodology compared with the national accounts methodology. See Section 6 for a fuller explanation.
The exclusion of the adjustment for the change in pension entitlements (which measures households net deferred saving into pensions) from the cash-basis saving ratio methodology was the primary reason for the smaller increase in the saving ratio on a cash basis than on a national accounts basis. The adjustment for the change in pension entitlements increased by £1.3 billion in Quarter 2 2018, which alongside small increases in other excluded transactions meant that households’ total resources on a cash basis increased by £1.4 billion less than on a national accounts basis. This was partially offset by the exclusion of spending on imputed transactions from cash-basis final consumption expenditure, which grew by £0.5 billion last quarter. Therefore, cash-basis gross saving increased by £0.9 billion less on a cash basis than on a national accounts basis, leading to a smaller rise in the cash-basis saving ratio.
Figure 7 explains this visually. The stacked columns show the contributions to the quarterly change in gross saving, and therefore the change in the saving ratio, on a national accounts basis and a cash basis in Quarter 2 2018. A stacked column also separately shows the contributions of the transactions excluded from the cash-basis saving ratio. The quarterly change in the value of gross saving is the net value of the upward and downward contributions represented by the dots.
Figure 7: Contributions to the change, quarter on previous quarter, in gross saving on a cash basis and a national accounts basis, £ billion
Quarter 2 (Apr to June) 2018
Source: Office for National Statistics
Download this chart Figure 7: Contributions to the change, quarter on previous quarter, in gross saving on a cash basis and a national accounts basis, £ billion
Image .csv .xlsAnnually, the cash-basis saving ratio fell to negative 0.5% in 2017, its lowest level since 2007 when it was negative 0.9%. This represents the first year in a decade during which, when imputed transactions are removed from their spending and saving, households’ spending exceeded their gross disposable income. Households’ spending previously exceeded their disposable income, and therefore recorded a negative cash-basis saving ratio on an annual basis, in 1999 and for five consecutive years between 2003 and 2007.
Revisions to the cash-basis saving ratio
This bulletin includes revisions to data from Quarter 1 (Jan to Mar) 2017 in line with the National Accounts Revisions Policy.
The cash-basis saving ratio was revised upwards by an average of 0.5 percentage points in the first three quarters open to revision, and revised downwards by 0.1 percentage points in Quarter 4 (Oct to Dec) 2017 and Quarter 1 2018.
In all five quarters open to revisions, there were upward revisions to wages and salaries, which averaged £1.9 billion per quarter. Between Quarter 1 2017 and Quarter 3 (July to Sept) 2017, these revisions were the primary driver of the upward revisions to cash-basis gross saving and the cash-basis saving ratio. In the latter two quarters open to revision, upward revisions to wages and salaries were more than offset by downward revisions to net property income received and upward revisions to cash-basis final consumption expenditure, leading to a downward revision of 0.1 percentage point in the cash-basis saving ratio in these two quarters.
The upward revisions to households’ expenditure in Quarter 4 (Oct to Dec) 2017 and Quarter 1 2018 were predominantly driven by the inclusion of new data on households’ expenditure on motor cars. In Quarter 1 2018, new data on households’ expenditure on life insurance have also added to the revision.
Figure 8: Impact of revisions to cash-basis gross saving, £ billion Quarter 1 (Jan to Mar) 2017 to Quarter 1 (Jan to Mar) 2018
Source: Office for National Statistics
Notes:
- Q1 refers to Jan to Mar, Q2 refers to Apr to June, Q3 refers to July to Sept, Q4 refers to Oct to Dec.
Download this chart Figure 8: Impact of revisions to cash-basis gross saving, £ billion Quarter 1 (Jan to Mar) 2017 to Quarter 1 (Jan to Mar) 2018
Image .csv .xls6. Quality and methodology
This is an experimental product and we are continually reviewing the methodology used to produce the cash measures of real household disposable income (RHDI) and the saving ratio as well as how we present the product. Following user feedback, we have added the time series (1997 onwards) of transactions removed from the cash-based measures of RHDI and the saving ratio in the Alternative measures of RHDI and saving ratio. We hope this will make it easier for users to follow through the methodology using a single dataset.
How do we estimate cash measures of RHDI?
Real household disposable income (RHDI) is a measure of the real purchasing power of household income, in terms of the physical quantity of goods and services they would be able to purchase if prices remained constant over time. It is calculated using the national accounts gross disposable household income (GHDI; calculated in current prices) and adjusting it to remove the effects of inflation.
GHDI on a national accounts basis is calculated as total income received from wages (and the self-employed), pension contributions, social benefits and net property income, less taxes on income and wealth. The income earned on financial assets, such as interest and dividends, plus the income received from allowing other institutional units to use non-produced assets (rent on land) is known as property income. It is essentially income made on investments, as opposed to income from property (for example, dwellings) as the name may suggest.
This differs from the cash-basis measure, where we remove transactions that are not directly observed by households, to better reflect the conditions they are experiencing.
There are 11 transactions, that are, or include, imputed transactions, included in the national accounts calculation of GHDI but excluded from the cash measure of GHDI. These are:
- B.2g (resource): Gross operating surplus
- D.12 (resource): Employers’ social contributions
- P.119 (resource): (Plus) Financial intermediation services indirectly measured (FISIM)
- D.442 (resource): Property income payable on pension entitlements
- D.4432 (resource): Investment income attributable to collective investment fund shareholders – retained earnings
- P.119 (use): (Less) Financial intermediation services indirectly measured (FISIM)
- D.612 (resource): Employers’ imputed social contributions
- D.72 (resource): Non-life insurance claims
- D.611 (use): Employers’ actual social contributions
- D.612 (use): Employers’ imputed social contributions
- D.614 (use): Households’ social contribution supplements
Within the national accounts, there are accounting identities, which mean that the values of some of the previous transactions net to zero:
- employers’ social contributions (D.12r) is equal and opposite to the sum of Employers’ actual social contributions (D.611u) and Employers’ imputed social contributions (D.612u)
- income payable on pension entitlements (D.442r) is equal and opposite to Households’ social contributions supplements (D.614u)
Therefore, only the removal of the following six transactions explains the differences between GHDI on a cash basis and a national accounts basis:
- B.2g (resource): Gross operating surplus
- P.119 (resource): (Plus) Financial intermediation services indirectly measured (FISIM)
- D.4432 (resource): Investment income attributable to collective investment fund shareholders – retained earnings
- P.119 (use): (Less) Financial intermediation service indirectly measured (FISIM)
- D.612 (resource): Employers’ imputed social contributions
- D.72 (resource): Non-life insurance claims
Once we have calculated GHDI on a cash basis, we use a deflator to remove the effect of price inflation and price changes observed by households to calculate real household disposable income (RHDI) on a cash basis. Previously, GHDI on a cash basis was deflated by using the national accounts households’ final consumption expenditure implied deflator. The deflator used now is the national accounts household expenditure deflator less imputed rental and financial intermediation services indirectly measured (FISIM). This cash-basis deflator represents more closely price changes experienced by households.
How do we estimate cash measures of the saving ratio?
The saving ratio estimates the amount of money households have available to save (gross saving) as a percentage of their gross disposable income.
To estimate cash measures of the saving ratio, gross saving is calculated as households’ total available resources (that is, GHDI) less household consumption (expenditure on goods and services for consumption). This differs from the national accounts calculations, in which pension accumulations are added to total available resources.
Household consumption (final consumption expenditure) on a cash basis is calculated by subtracting the following imputed transactions from the national accounts measure of final consumption expenditure:
- imputed rental
- financial intermediation services indirectly measured (FISIM)
The saving ratio on a cash basis is, therefore, gross saving on a cash basis expressed as a percentage of GHDI on a cash basis (which is equal to the cash measure of total available resources). The difference between the national accounts saving ratio and the cash-basis saving ratio is caused by the value of the transactions excluded from the calculation of gross disposable household income and the transactions removed from national accounts gross saving.
Table 1 presents the quarterly change in the value of the transactions that are included in the calculation of the national accounts gross disposable income and the saving ratio, but are excluded from the calculation of cash-basis gross disposable income and the cash-basis saving ratio. The values in the table explain the difference in the changes between Quarter 1 (Jan to Mar) 2018 and Quarter 2 (Apr to June) 2018.
Table 1: Change, quarter on previous quarter, in the value of transactions removed from the national accounts methodology to calculate cash-basis gross disposable income and cash-basis gross saving, £ million Quarter 2 (Apr to June) 2018
| Transaction removed | CDID | Quarterly change, £ million |
|---|---|---|
| Gross operating surplus (B.2g) | CAEO | 180 |
| Employers' social contributions* (D.12r) | DTWP | 1018 |
| Financial Intermediation Services Indirectly Measured (FISIM) (P.119r) | CRNC | 498 |
| Investment income payable on pension entitlements* (D.442r) | KZL5 | 585 |
| Retained earnings attributable to collective investment fund shareholders (D.4432r) | MN7M | 15 |
| Financial Intermediation Services Indirectly Measured (FISIM) (P.119u) | CRNB | -730 |
| Employers' imputed social contributions (D.612r) | L8RQ | 0 |
| Non-life insurance claims (D.72r) | RNLU | 165 |
| Employers' actual social contributions* (D.611u) | L8NM | 912 |
| Employers' imputed social contributions* (D.612u) | MA4B | 106 |
| Households' social contribution supplements* (D.614u) | L8QA | 585 |
| Adjustment for the change in pension entitlements (D.8r) | RNMB | 1259 |
| Imputed rental for housing (removed from cash basis final consumption expenditure) | GBFJ | 165 |
| Financial Intermediation Services Indirectly Measured (FISIM) (removed from cash basis final consumption expenditure) | C68W | 381 |
| Source: Office for National Statistics | ||
| Notes: | ||
| 1. Transactions marked with an asterisk (*) are those whose values, in accordance with the European System of Accounts 2010 (ESA10), net to 0. | ||
| 2. The removal of the transactions in the table not marked with an asterisk (*) explain the difference between gross disposable income, gross saving and final consumption expenditure on a cash basis. | ||
| 3. Codes (in brackets) used in Table 1 are European System of Accounts 2010 (ESA 2010) codes. | ||
| 4. CDIDs are unique random identifiers for individual time series. They do not themselves have any specific meaning but enable users to reference this table with the accompanying data tables provided. | ||
Download this table Table 1: Change, quarter on previous quarter, in the value of transactions removed from the national accounts methodology to calculate cash-basis gross disposable income and cash-basis gross saving, £ million Quarter 2 (Apr to June) 2018
.xls (186.9 kB)7. Acknowledgements
We continue to welcome feedback from users on the future content of this bulletin and publication tables and are particularly interested to know how you make use of these data to inform your work. Please email us at sector.accounts@ons.gov.uk.
Back to table of contents