Table of contents
- Main points
- Statistician’s comment
- Things you need to know about this release
- UK population rising to 69.2 million in mid-2026
- How do births, deaths and migration affect the projections?
- A growing number of older people
- Changes since the 2014-based projections
- How does the UK compare with other countries?
- Links to related statistics
- Quality and methodology
1. Main points
The UK population is projected to increase by 3.6 million (5.5%) over the next 10 years, from an estimated 65.6 million in mid-2016 to 69.2 million in mid-2026.
England is projected to grow more quickly than the other UK nations: 5.9% between mid-2016 and mid-2026, compared with 4.2% for Northern Ireland, 3.2% for Scotland and 3.1% for Wales.
Over the next 10 years, 46% of UK population growth is projected to result from more births than deaths, with 54% resulting from net international migration.
The UK population is projected to pass 70 million by mid-2029 and be 72.9 million in mid-2041.
There will be an increasing number of older people; the proportion aged 85 and over is projected to double over the next 25 years.
The UK population growth rate is slower than in the 2014-based projections; the projected population is 0.6 million less in mid-2026 and 2.0 million less in mid-2041.
2. Statistician’s comment
“Over the period between mid-2016 and mid-2026 the population of the UK is projected to grow from 65.6 million to 69.2 million, reaching 70 million by mid-2029. England is projected to grow more quickly than the other UK nations.
“Over that period 54% of growth is projected to result directly from net international migration. The other 46% is because there will be more births than deaths.
“These projections suggest slower growth than the previous (2014-based) projections. This is because of lower assumptions about future levels of fertility and international migration, and an assumption of a slower rate of increase in life expectancy.”
Andrew Nash, Population Projections Unit, Office for National Statistics.
Back to table of contents3. Things you need to know about this release
The 2016-based national population projections provide statistics on the potential future size and age structure of the population of the UK and its constituent countries. We base them on the mid-2016 population estimates and a set of underlying assumptions about future fertility, mortality and migration. They supersede the 2014-based projections.
Population projections are not forecasts and will inevitably differ to a greater or lesser extent from actual future population change. There is already a margin of error in the underlying data – for example, estimates of the current population and past migration flows. In addition, our assumptions about the future cannot be certain as patterns of births, deaths and migration are always liable to change and can be influenced by many factors.
Two factors that may affect future population are political and economic changes but it is not possible to know in advance what impact these will have. On that basis the projections do not attempt to predict the impact of the UK leaving the EU. However, the projections of people of State Pension age do reflect future changes under existing legislation.
Projections inevitably become increasingly uncertain the further into the future they go. This bulletin focuses on the first 25 years of the projections, up to mid-2041. The data files include projections going forward 100 years, up to mid-2116. However, such long-term projections should inevitably be treated with great caution as much may change over that timescale.
As well as the principal projection we have also published a number of variant projections based on alternative assumptions about future fertility, mortality and migration. These do not represent upper or lower bounds but do illustrate what the population could look like if, for example, international migration were either higher or lower than assumed for the principal projection.
Back to table of contents4. UK population rising to 69.2 million in mid-2026
The UK population, 65.6 million in mid-2016, is projected to rise to 69.2 million over the decade to mid-2026, pass 70 million by mid-2029 and rise to 72.9 million in mid-2041.
The total projected increase in the UK population over the next 25 years is less than that over the past 25 years (Figure 1). Between mid-1991 and mid-2016 the population grew by 8.2 million (14.3%); between mid-2016 and mid-2041 it is projected to grow by another 7.3 million (11.1%).
Figure 1: UK population estimates, mid-1991 to mid-2016, and projections to mid-2041
Source: Office for National Statistics
Download this chart Figure 1: UK population estimates, mid-1991 to mid-2016, and projections to mid-2041
Image .csv .xlsFocusing on the 10 years between mid-2016 and mid-2026 (Table 1), the total projected growth for the UK is 3.6 million, or 5.5%. This represents an average annual growth rate of 0.5%. Projected growth varies substantially between the four nations of the UK: England’s population is projected to grow 5.9% over this period; for Northern Ireland the figure is 4.2%, while for Scotland and Wales the figures are 3.2% and 3.1% respectively.
Table 1: Estimated and projected population of the UK and constituent countries, mid-2016 to mid-2041
| millions | ||||||
| 2016 | 2021 | 2026 | 2031 | 2036 | 2041 | |
|---|---|---|---|---|---|---|
| UK | 65.6 | 67.6 | 69.2 | 70.6 | 71.8 | 72.9 |
| England | 55.3 | 57.0 | 58.5 | 59.8 | 60.9 | 62.0 |
| Wales | 3.1 | 3.2 | 3.2 | 3.2 | 3.3 | 3.3 |
| Scotland | 5.4 | 5.5 | 5.6 | 5.6 | 5.7 | 5.7 |
| Northern Ireland | 1.9 | 1.9 | 1.9 | 2.0 | 2.0 | 2.0 |
| Source: Office for National Statistics | ||||||
| Notes: | ||||||
| 1. Figures may not sum because of rounding. | ||||||
Download this table Table 1: Estimated and projected population of the UK and constituent countries, mid-2016 to mid-2041
.xls (18.9 kB)Over the full 25 years between mid-2016 and mid-2041, England is projected to have the largest increase in population, at 12.1%. The figures for the other UK countries are 7.6% for Northern Ireland, 5.3% for Scotland and 4.6% for Wales.
Back to table of contents5. How do births, deaths and migration affect the projections?
During the 10 years between mid-2016 and mid-2026, the projections for the UK as a whole suggest:
- 7.7 million people will be born
- 6.1 million people will die
- 5.2 million people will immigrate long-term to the UK
- 3.2 million people will emigrate long-term from the UK
This means that of the 3.6 million increase in total population, 1.6 million (46%) is projected to result from the higher number of births than deaths and 1.9 million (54%) is projected to result directly from net international migration.
Over the full 25-year period from mid-2016 to mid-2041 the proportion of growth resulting from the balance of births and deaths is projected to be lower, at 39%. This is mainly because the number of deaths is projected to rise as large numbers of those born in the baby boom immediately after World War 2 die later in the period.
As well as the direct impact, international migration has an indirect impact on the population in terms of its effect on the numbers of births and, to a lesser extent in the shorter term, deaths. For example, women immigrating to the UK who subsequently have children will increase the numbers of births. Conversely, women emigrating before they have children will decrease the number of births.
Once the indirect effect is taken into account, international migration accounts for 77% of the projected UK population growth between mid-2016 and mid-2041. Because migrants are concentrated at young adult ages, the impact of migration on the projected number of women of childbearing age is especially important over this period.
International migration to and from the UK before the projection base year of 2016 will also influence future population growth, in the sense that past migrants and their descendants will contribute to the projected numbers of births and deaths. However, our assumptions of future fertility and mortality are based on past trends of all residents, irrespective of where they were born.
Back to table of contents6. A growing number of older people
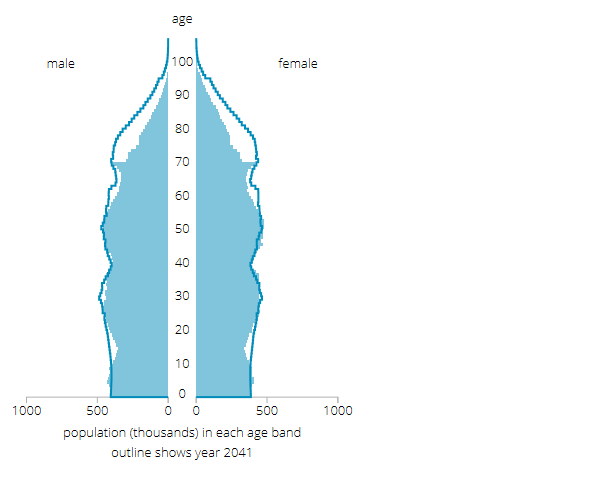
The age structure of the population is constantly evolving as a result of births, deaths, migration and everyone getting older. The population pyramid in Figure 2 compares the age structure of the population in mid-2016 with the projected age structure in mid-2041.
Figure 2: Age structure of the UK population, mid-2016 and mid-2041
Source: Office for National Statistics
Download this image Figure 2: Age structure of the UK population, mid-2016 and mid-2041
.png (14.8 kB) .xls (30.2 kB)
The pyramid for mid-2016 includes more females than males at older ages, reflecting their higher life expectancy. The spike at ages 68 and 69 years reflects the baby boom after World War 2 and the wider area around age 50 years reflects the baby boom of the 1960s. The narrowing in the teenage years corresponds with the particularly low birth rates around the turn of the millennium.
In mid-2041 all these features are still present in the pyramid, with the peaks and troughs now located 25 years higher up the age scale. However, the numbers in each group have changed as a result of migration and deaths. The number of younger adults is similar to mid-2016 but there are more teenagers because we have assumed fertility rates will remain higher than they were around the year 2000.
The largest difference, however, is that in mid-2041 there are projected to be many more people at older ages. This partly reflects the 1960s baby-boomers now being in their 70s, but also the continued increase in life expectancy meaning that more people live to very old ages. In mid-2016 there were 1.6 million people aged 85 and over; by mid-2041 this is projected to double to 3.2 million.
Figure 3 shows the changing age structure by life stage – children, working age and pensionable age – taking into account the planned increases in State Pension age (SPA) to 67 years old for both sexes by 2028. The number of children (those aged 0 to 15 years) is similar in each year, but the numbers of people of working age and pensionable age are projected to grow.
Figure 3: UK population by life stage, mid-2016 and mid-2041
Source: Office for National Statistics
Notes:
- Children are defined as those aged 0 to 15 years.
- Working age and pensionable age populations are based on State Pension age (SPA) for the stated year. Under current legislation SPA in mid-2041 will be 67 years old for both sexes.
Download this chart Figure 3: UK population by life stage, mid-2016 and mid-2041
Image .csv .xlsThe numbers of people in each life stage are important when considering dependency ratios, which inform government financial planning. A common measure is the Old Age Dependency Ratio (OADR), defined as the number of people of pensionable age for every 1,000 people of working age. This is projected to rise from 305 in mid-2016 to 370 by mid-2041. If SPA were to stay at mid-2016 levels the OADR in mid-2041 would be 442.
Back to table of contents7. Changes since the 2014-based projections
The 2016-based projections differ from the previous set, the 2014-based projections. This is partly because they are based on the population estimate from mid-2016 rather than mid-2014, as well as the latest data on births, deaths and migration. However, we have also changed our assumptions about the future. Full information is available in the supporting methodological documents but, in summary:
- we have assumed lower long-term net international migration
- we have assumed that women will have fewer children
- actual life expectancy has increased less than projected since mid-2014; this means that the life expectancy values for 2016 are lower, and also reduces the rate of increase in subsequent years
- we have no longer assumed a faster rate of increase in life expectancy for those born between 1923 and 1938 (also known as the “golden cohort”)
Table 2: Summary of changes to longer-term assumptions in UK projections, 2014-based and 2016-based
| 2014-based | 2016-based | |
|---|---|---|
| Net annual long-term international migration (after mid-2022) | 185,000 | 165,000 |
| Long-term average number of children per woman | 1.89 | 1.84 |
| Life expectancy at birth, males, mid-2041 (years) | 84.3 | 83.4 |
| Life expectancy at birth, females, mid-2041 (years) | 87.1 | 86.2 |
| Source: Office for National Statistics | ||
| Notes: | ||
| 1. Life expectancies are period expectations of life for mid-2041, meaning they are based on the mid-year mortality rates projected for that year. They do not account for the continuing increase in life expectancy projected after that point. | ||
Download this table Table 2: Summary of changes to longer-term assumptions in UK projections, 2014-based and 2016-based
.xls (18.9 kB)The mid-2016 UK population estimate was 76,000 higher than projected in the 2014-based projections, meaning a slightly higher starting point. However, the changes indicated in Table 2 all work to reduce future population growth. In consequence, comparing the 2014-based projections with the 2016-based projections:
- the projected UK population in mid-2026 was 69.8 million; this has been reduced to 69.2 million
- the projected UK population in mid-2041 was 74.9 million; this has been reduced to 72.9 million
- the UK population was projected to pass 70 million by mid-2027; it is now projected to do so by mid-2029
- the Old Age Dependency Ratio in mid-2041 was projected to be 374; it is now projected to be 370
8. How does the UK compare with other countries?
The European Union (EU) statistical office, Eurostat, publishes population projections for the current members of the EU. They are 2015-based and use different methods from Office for National Statistics (ONS). Eurostat projects that the UK population at the start of 2040 will be 75.0 million. This is substantially higher than our (2016-based) mid-2040 projection of 72.7 million.
Eurostat’s projections suggest that the total population of the current EU members will increase by 4% between 2015 and 2040, varying between 53% growth for Luxembourg and a 27% decline in population for Lithuania.
On that basis the UK’s projected growth of 16% between 2015 and 2040 is well above the EU average. It is also the highest growth rate among the four largest nations in the EU – over the same period France’s population is projected to grow by 10% and Germany’s by 4%, while Italy’s population is projected to see a slight population decline.
The United Nations (UN) also produces population projections. Their methods are different again, projecting a UK population of 73.1 million in mid-2040. This is a 12% increase on mid-2015, compared with a projected world population increase of 25% over the same period.
The UN’s projected increases for the world’s three most populous nations, also for the period mid-2015 to mid-2040, are 1% for China, 23% for India and 17% for the US. At opposite ends of the scale, Niger’s population is projected to grow by 150% while Latvia’s is projected to decline by 19% (the UN projects the decline in Lithuania will be a more modest 13%).
These comparisons demonstrate that projected population growth or decline varies considerably across the globe. It also shows that different methods can lead to substantially different results.
Back to table of contents10. Quality and methodology
The National population projections Quality and Methodology Information report contains important information on:
- the strengths and limitations of the data and how it compares with related data
- uses and users of the data
- how the output was created
- the quality of the output including the accuracy of the data
We have also published a number of other methodological documents, including a general background and methodology report, and more detail on fertility, mortality and migration.
Back to table of contents