1. Main points
The highest 1-year and 5-year survival estimates in England, for 14 commonly diagnosed cancer sites, were in prostate cancer for men (96.3% and 88.3%, respectively) and in breast cancer for women (95.6% and 86.0%, respectively) diagnosed between 2011 and 2015.
Across Cancer Alliances, the ranges between the highest and lowest 1-year survival estimates for breast (in women) and prostate (in men) were 1.5 and 2.2 percentage points, respectively.
For cancer of the kidney, cervix (in women), stomach and lung, the age-standardised 1-year survival estimates, across Cancer Alliances, had ranges greater than 8 percentage points; with kidney cancer having the largest difference between the highest and lowest 1-year estimates of 9.9 percentage points.
The largest increase to the annual change in 5-year net survival (measured over eight years) among Cancer Alliances for men was for myeloma cancer in Thames Valley (3.5% per year) and for women was for kidney cancer in Kent and Medway (3.4% per year).
Survival estimates are presented for oesophagus, stomach, colon, lung, breast (in women), cervix (in women), prostate (in men) and bladder cancer, along with six cancer sites (cancers of the rectum, colorectum, uterus (in women) and kidney, and myeloma and non-Hodgkin lymphoma), which are presented for the first time.
2. Collaboration
The cancer registration and survival data in this bulletin has been collected and calculated by the National Cancer Registration and Analysis Service (NCRAS) within Public Health England (PHE) and published in partnership with the Office for National Statistics (ONS).

3. Things you need to know about this release
What’s included in this bulletin?
This bulletin provides five-year age-standardised net 1-year and 5-year survival estimates (based on the complete approach); unstandardised time series; eight-year trend analysis; and measures of precision for adults (aged 15 to 99 years) diagnosed with one of 14 common cancers in England between 2011 and 2015, followed up for their vital status for at least one whole calendar year to 31 December 2016.
The 14 cancer sites presented in this bulletin represent almost three quarters of new cancers (excluding non-melanoma skin cancer) diagnosed in England in 2015. These cancers are included in the analysis as they have a wide range of pathways for diagnosis and treatment, and different levels of survival. Estimates of 1-year and 5-year net survival are presented for each sex, and for both sexes combined where appropriate.
Following advice from key stakeholders, sub-national survival estimates are presented for the latest NHS geographical areas. Results are presented for England as a whole, and for three levels of organisation of the NHS in England – four NHS Regions, 19 Cancer Alliances (average population about 2.9 million) and 44 Sustainability and Transformation Partnerships (STP) areas (average population about 1.2 million). This sub-national analysis focuses on these areas which are leading the local delivery of the improved cancer outcomes set out in Achieving world-class cancer outcomes: A Strategy for England 2015-2020. Further details of these health geographies can be found in the Quality and Methodology Information report.
What’s changed in this release?
Methods were reviewed as part of the new partnership with Public Health England. The main change in methodology is the change in the age-standardisation method, with the implementation of the International Classification of Survival Standard (ICSS) which will enable sub-national comparisons within England and will be a step forward towards national comparisons within the UK and international comparisons of survival estimates. Furthermore, this brings the methodology in line with existing cancer outputs produced jointly by Public Health England and Office for National Statistics as explained in the Quality and Methodology section.
Survival estimates are presented for oesophagus, stomach, colon, lung, breast (in women), cervix (in women), prostate (in men) and bladder cancer, as previously presented in the historic back series. Additional survival estimates are also now available due to changes in methodology.
In particular, by using five years of aggregated data, it is now possible to produce robust age-standardised estimates for a more representative selection of cancer sites at sub-national levels. Therefore, the analysis includes survival estimates for cancers of the rectum, colorectum, uterus (in women) and kidney, along with myeloma and non-Hodgkin lymphoma for the first time.
To summarise, the main changes are:
the adoption of the International Classification of Survival Standard (ICSS) international cancer patient population for age standardising survival ratios
using the complete approach on five years of aggregated data for age-standardised survival estimates
expanding the analysis to include a wider range of cancer sites
How to interpret these statistics
These sub-national cancer survival estimates are based on net survival, which is calculated by comparing the survival of cancer patients with that of the general population.
Age-standardised survival estimates are presented for adults who were diagnosed during 2011 to 2015 and followed up for at least one whole calendar year (to 31 December 2016). Estimates are age-standardised to adjust for changes in the age profile of cancer patients over time and differences between geographical areas.
For some cancer sites at lower geographic breakdowns, the small populations result in increased variability in estimates. We have provided a graph displaying the minimum, maximum, and national estimates for each cancer site in Figure 3 to show the variability at that level. This is provided for Cancer Alliances rather than STPs due to there being an increase in variability and in the amount of suppressed data at STP level.
Confidence intervals (at the 95% level) are included in the datasets, to give an indication of the precision of the survival estimates.
Unstandardised estimates are provided for an eight-year period for both 1-year and 5-year survival in the datasets. From each eight-year period, an average annual change has been created to help explain the improvements in survival over that period. For this bulletin, unstandardised survival estimates are presented in the datasets for 5-year survival for each year during the period 2004 to 2011, and for 1-year survival during 2008 to 2015.
These cancer survival estimates are designated as National Statistics. National Statistics are a subset of official statistics, which have been certified by the UK Statistics Authority as compliant with its Code of Practice for Official Statistics.
Back to table of contents4. Geographic patterns of cancer survival
England
In England as a whole, 1-year survival estimates were above 75% and 5-year survival estimates were above 50% for the majority of cancer sites, with the exception of cancer of the lung, oesophagus and stomach.
The highest 1-year and 5-year survival estimates in England, from the 14 cancer sites observed, were in prostate cancer for men (96.3% and 88.3%, respectively) and in breast cancer for women (95.6% and 86.0%, respectively) diagnosed between 2011 and 2015.
For the 10 cancer sites recorded for both sexes, 1-year cancer survival is generally higher in men than in women, except for kidney cancer, lung cancer and non-Hodgkin lymphoma. Kidney cancer survival for both men and women was the same at 76.6%. Lung cancer survival was 35.4% for men compare with 42.0% for women, while non-Hodgkin lymphoma survival was 78.0% for men and 80.5% for women. For lung cancer, this can be attributed to difference in cigarette consumption between men and women as discussed in Cancer Registration Statistics, England: 2015. For these 10 cancer sites, differences can be seen in Figure 1.
The largest difference in 1-year survival between men and women was for bladder cancer (13.1 percentage points): at 78.7% for men and 65.6% for women. This sex difference in bladder cancer survival has been reported worldwide and a number of reasons such as tumour biology, sex hormones and earlier diagnosis in men have been suggested to explain the difference. Further details can be found in the following research: disparity in bladder cancer outcomes and gender inequalities in the promptness of diagnosis of bladder and renal cancer after symptomatic presentation.
Figure 1: Age-standardised 1-year net survival (%) for adults diagnosed during the period 2011 to 2015 and followed up to 2016: England, 14 common cancers, by sex
Source: National Cancer Registration and Analysis Service within Public Health England; Office for National Statistics
Notes:
Survival estimates were age-standardised using a standard set of age-specific weights.
Adults aged 15 to 99 years.
The International Classification of Diseases Tenth 10th Revision (ICD-10) was used to classify cancer sites.
Download this chart Figure 1: Age-standardised 1-year net survival (%) for adults diagnosed during the period 2011 to 2015 and followed up to 2016: England, 14 common cancers, by sex
Image .csv .xlsFigure 2 shows a different pattern in survival between men and women at the England-level for 5-year cancer survival. Five-year cancer survival for men is higher than for women in only half of the cancer sites compared. Women have a higher 5-year survival than men for kidney, lung, oesophagus and stomach cancer, along with non-Hodgkin lymphoma. The largest differences, in 5-year survival, between men and women were for non-Hodgkin lymphoma (69.4% in women and 64.9% in men) and lung cancer (17.5% in women and 13.1% in men).
Figure 2: Age-standardised 5-year net survival (%) for adults diagnosed during the period 2011 to 2015 and followed up to 2016: England, 14 common cancers, by sex
Source: National Cancer Registration and Analysis Service within Public Health England; Office for National Statistics
Notes:
Survival estimates were age-standardised using a standard set of age-specific weights.
Adults aged 15 to 99 years.
The International Classification of Diseases Tenth 10th Revision (ICD-10) was used to classify cancer sites.
Download this chart Figure 2: Age-standardised 5-year net survival (%) for adults diagnosed during the period 2011 to 2015 and followed up to 2016: England, 14 common cancers, by sex
Image .csv .xlsThese findings are in line with the national cancer survival bulletin which focuses on 1-year and 5-year survival for adults diagnosed with one of 25 common cancers in England. This sub-national survival bulletin, builds on this analysis and includes trend analysis to assess improvements over time.
Trends in cancer survival are shown in the datasets as the annual change in net survival over the eight-year periods 2004 to 2011 (for 5-year survival), and 2008 to 2015 (for 1-year survival). This is presented as the average difference from one year to the next.
In England as a whole and for both sexes combined, 1-year survival improved by up to 1.6% (lung cancer in women) a year between 2008 and 2015 for all but one of the 14 cancers examined in this report. There was a small reduction (of 0.1%) in 1-year bladder cancer survival in both men and women. Further details regarding the possible explanation for this reduction can be found in the Site specific information section.
For 5-year survival estimates, the annual change in net survival over the eight-year period from 2004 to 2011 increased for all of the 14 cancer sites reported in this bulletin except male bladder cancer. The increases ranged from 0.1% (for bladder cancer for all persons) to 2.1% (for myeloma in women). Five-year net survival for male bladder cancer remained unchanged over the eight-year period from 2004 to 2011.
NHS Regions
At the NHS region level, the cancer site with the highest 1-year survival for men was prostate (96.7%) in the Midlands and East of England region, and for women it was breast (95.9%) in the South of England region. These were also the cancer sites with the highest 5-year survival for each sex; for men, the highest survival is now observed in London (89.9%).
The variation between NHS regions is smaller than that seen at the lower geographies since they contain larger populations across only four areas. Therefore, when looking at the ranges, we have highlighted sites that have a range of more than 5 percentage points, since most sites don’t vary by much more than this.
For women, the range in 1-year survival between NHS regions was more than 5 percentage points for cancers of the kidney and stomach. These cancer sites also had some of the wider ranges for 5-year survival, along with cancers of the cervix, colon and myeloma.
For men, kidney cancer was the only site where the range in 1-year survival between NHS regions was more than 5 percentage points. However, a range in 5-year survival greater than 5 percentage points could be seen for myeloma, kidney, stomach, rectum and bladder cancers.
The annual change in net survival for persons increased across all four NHS regions for most cancers sites, with increases up to 1.7% (for cancer of the kidney in the London region) for 1-year survival and up to 2.2% (for myeloma cancer in the North of England region) for 5-year survival.
The largest annual improvement in 1-year survival for men amongst the four NHS regions was for myeloma cancer in the North of England with 1.4% per year. For women, the largest improvement in 1-year survival was the average annual increase of 2.4% for kidney cancer in London.
For 5-year survival, the largest improvements in NHS regions for men were for kidney and myeloma cancer in London and the North of England, respectively (2.0% per year). For women, the largest improvement was also for myeloma cancer, in both the North of England and the Midlands and East of England regions (2.6% per year).
Cancer Alliances
For men, 1-year survival for cancers of the kidney, lung and prostate increased in all 19 Cancer Alliances (CAs), with the annual change in net survival increasing from between 0.1% to 1.9% per year. Apart from bladder cancer, the 1-year cancer survival estimates in men for the other cancer sites increased for the majority of CAs. For cancer of the bladder in both sexes, 10 out of 19 CAs saw a small decrease in the annual change in net survival over the eight-year period of 2008 to 2015.
Five-year survival for cancers of the lung, colon and colorectum for men increased in all 19 CAs, with the annual change in net survival increasing from between 0.1% to 2.0% per year.
For women, the annual change in 1-year net survival for kidney and lung cancers rose in all 19 CAs, with the annual increase ranging from 0.2% to 3.1% per year for kidney and from 1.0% to 2.2% per year for lung cancer. Annual changes in 1-year net survival for bladder, cervix, myeloma, colon and colorectum cancers in women all decreased in at least one-quarter of CAs.
Decreases in the annual change in net survival across the CAs were less visible in the 5-year cancer survival estimates for women, with only cancer of the bladder and myeloma having decreases in survival estimates in more than two CAs.
The largest increase to the annual change in 5-year net survival among Cancer Alliances for men was for myeloma cancer in Thames Valley (3.5% per year) and for women was for kidney cancer in Kent and Medway (3.4% per year).
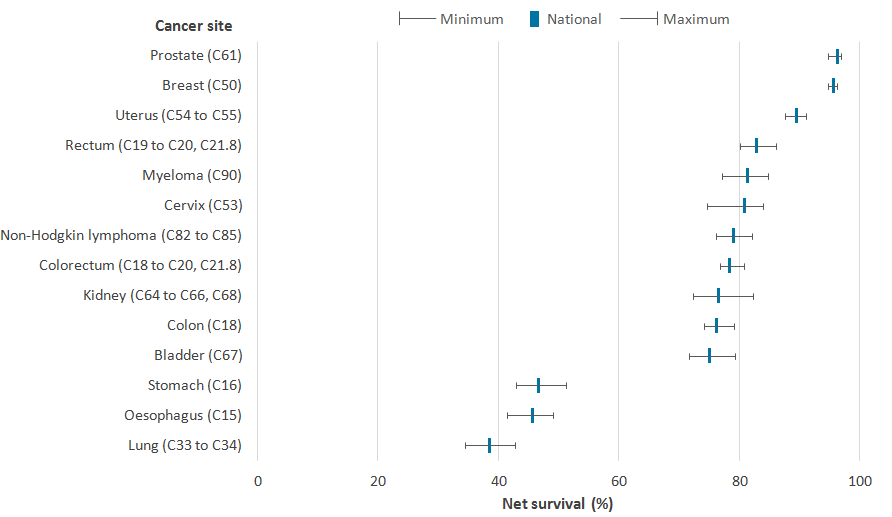
Figure 3 shows the national cancer net survival estimate for each cancer site and the range in survival by CA. For cancer of the kidney, cervix (in women), stomach and lung, the age-standardised 1-year survival estimates, across Cancer Alliances, had ranges greater than 8 percentage points; with kidney cancer having the largest difference between the highest and lowest 1-year estimates of 9.9 percentage points.
Across Cancer Alliances, the ranges between the highest and lowest 1-year survival estimates for breast (in women) and prostate (in men) were 1.5 and 2.2 percentage points, respectively. Less variation in survival estimates across CAs was evident in cancer sites with relatively high survival, as survival ranged from 94.7% to 96.2% for breast cancer (in women) and 94.7% to 96.9% for prostate cancer (in men).
Figure 3: Age-standardised 1-year net survival (%) for adults in England and the range of survival by Cancer Alliances, diagnosed during the period 2011 to 2015 and followed up to 2016
Source: National Cancer Registration and Analysis Service within Public Health England; Office for National Statistics
Notes:
Survival estimates were age-standardised using a standard set of age-specific weights.
Adults aged 15 to 99 years for all persons except for sex-specific cancers (breast, cervix and uterus for women and prostate for men).
The International Classification of Diseases Tenth 10th Revision(ICD-10) was used to classify cancer sites.
Download this image Figure 3: Age-standardised 1-year net survival (%) for adults in England and the range of survival by Cancer Alliances, diagnosed during the period 2011 to 2015 and followed up to 2016
.png (24.3 kB) .xls (18.4 kB)
Sustainability and Transformation Partnerships
Sustainability and Transformation Partnerships (STPs) are smaller areas than Cancer Alliances, and more variation can be expected due to smaller populations (average population of approximately 1.2 million compared to 2.9 million in Cancer Alliances).
Where robust estimates are available, wide differences in age-standardised survival between the 44 STPs in England were seen for patients diagnosed during the five-year period 2011 to 2015 for each of the 14 cancers examined. Please note, a full comparison of 5-year survival estimates and the annual change in net survival is not reported on due to the suppression of estimates which are not deemed to be robust.
For women, the range in 1-year survival estimates between STPs was more than 15 percentage points for cancers of the bladder, kidney, oesophagus, stomach, cervix and myeloma. The largest variation in 1-year survival across STPs in women was seen in stomach and oesophageal cancer, where the range in survival differed by more than 20 percentage points (24.1 and 21.6 percentage points, respectively). Whilst for men, the range in 1-year survival between STPs was only more than 15 percentage points for oesophageal cancer (with survival estimates ranging between 38.6% and 54.8%).
Back to table of contents5. Who uses these statistics and for what purpose?
Sub-national survival estimates are presented for the latest geographies: Cancer Alliances and Sustainability and Transformation Partnerships. Cancer Alliances (CAs) were established in addition to the three National Cancer Vanguard sites to lead local implementation of the 2015 cancer strategy. Sustainability and Transformation Partnerships (STPs) are local partnerships produced collaboratively by NHS organizations and councils in 44 areas which aim to improve health and care by setting out practical ways to improve NHS services and health outcomes. Previous editions of this bulletin have presented cancer survival estimates for Clinical Senates, Area Teams, Government Office Regions, Strategic Health Authorities (SHA) and Cancer Networks which are no longer applicable.
Therefore, these Official Statistics on cancer survival form an evidence base to inform cancer policy and programmes that aim to improve cancer outcomes. The statistics are commissioned by the Department of Health and are used to:
help inform government policy on cancer
provide non-government bodies with accurate and timely data on the disease
provide citizens with accessible data on the disease to help inform debate
Health policy-makers use population-based cancer survival statistics to plan services aimed at cancer prevention and treatment. Cancer survival estimates feed in to national cancer plans, such as Achieving world-class cancer outcomes: A Strategy for England 2015-2020. The report recommends six strategic priorities to help improve cancer survival in England by 2020.
Cancer survival estimates also feed into outcomes strategies that set out how the NHS, public health and social care services will contribute to the progress agreed with the Secretary of State, in each of the high-level outcomes frameworks. The indicators set for the Compendium of Population Health Indicators include 1-year and 5-year survival from bladder, breast, cervical, colorectal, lung, oesophagus, prostate and stomach cancers.
Back to table of contents7. Quality and methodology
The Cancer Survival Quality and Methodology Information report contains important information on:
the strengths and limitations of the data and how it compares with related data
uses and users of the data
how the output was created
the quality of the output including the accuracy of the data
Changes to methodology
From February 2018, age-standardised estimates for adults have been calculated using the International Cancer Survival Standard (ICSS) age-weightings. The impact of the change to methods of adopting the ICSS international cancer patient population for age standardising survival ratios is detailed in the following paper: The impact of updating cancer survival methodologies for sub-national estimates; geographic patterns of cancer survival in England. In summary, the benefits are:
they are publicly and readily available
these weights are widely used, for example, in the UK by Northern Ireland and Scotland and internationally by the United States National Cancer Institute and by the International Cancer Benchmark Partnership
it will help to enable national and international comparisons of survival estimates
the ICSS weights continue to vary by tumour type reflecting age distributions of the different cancers
this change will bring consistency across cancer survival estimates.
Additionally, the complete approach has been used to estimate survival rather than the cohort approach that was used previously. There was also a change from combining three years of diagnosis data to combining five years of data. This change allowed for more cancer sites to be included in the analysis (as highlighted in Table 1); fewer estimates were suppressed due to more diagnoses being included. Further details on the differences in survival approaches can be found in the Quality and Methodology Information report.
Table 1: Codes in the International Classification of Diseases, tenth revision (ICD-10)
| Cancer | ICD-10 code |
|---|---|
| Bladder | C67 |
| Breast | C50 |
| Cervix | C53 |
| Colon | C18 |
| Colorectum* | C18 to C20, C21.8 |
| Kidney* | C64 to C66, C68 |
| Lung | C33 and C34 |
| Myeloma* | C90 |
| Non-Hodgkin lymphoma* | C82 to C85 |
| Oesophagus | C15 |
| Prostate | C61 |
| Rectum* | C19 to C20, C21.8 |
| Stomach | C16 |
| Uterus* | C54 and C55 |
| Source: World Health Organization. International Classification of Diseases and Related Health Problems, Tenth Revision (ICD-10) and International Classification of Diseases for Oncology, Second Edition (ICD-O2). Geneva: World Health Organization. | |
| Notes: | |
| 1. * denotes survival estimates for this cancer site are presented in this bulletin for the first time. | |
Download this table Table 1: Codes in the International Classification of Diseases, tenth revision (ICD-10)
.xls (33.3 kB)Site specific information
Transitional-cell papillomas of the bladder diagnosed from 2000 onwards were reclassified from malignant to non-malignant. Non-malignant tumours are excluded from survival analyses. Survival from transitional-cell papillomas is high. Excluding them from the analyses reduces the overall estimate of survival from bladder cancer. Geographic variation in the speed with which these changes in pathological classification were applied still affects geographic patterns of survival.
The introduction of the Prostate-Specific Antigen (PSA) test during the 1990s increased the diagnosis of asymptomatic prostate cancers. Men with these tumours have higher survival.
Further information regarding the methodology to aid interpretation of these statistics is provided below:
Net survival estimates
Age-standardised net survival was estimated for the combined years 2011 to 2015. Where it was not possible to age-standardise due to robustness, the unstandardised estimate has been presented instead, and this is clearly marked in the tables (:). In a few instances, it was not even possible to present an unstandardised estimate, again due to robustness. Again, this is clearly marked in the tables (--). Unstandardised 5-year survival was estimated between 2004 and 2011 while 1-year survival was estimated between 2008 and 2015. In some cases, it was not possible to calculate the unstandardised estimate for adults diagnosed with a particular cancer in a particular geography in a particular year. This has been clearly marked in the tables (:).
Robustness criteria
There were four criteria when considering robustness of a survival estimate:
whether there were at least 10 patients at the beginning of last year of survival, the first year of follow-up for 1-year survival and the fifth year of follow-up for 5-year survival
in addition, if there were at least two deaths within the last year of survival. For the single year unstandardised estimates, we removed the requirement for at least two deaths as this would have suppressed even more estimates
if the standard error for the survival estimate was less than 0.2
whether there was a significant increase in survival from one year to the next
Annual trend
The annual trend in survival is the slope estimated by variance-weighted least-squares regression of the annual survival estimates. This represents the average annual change in net survival over eight consecutive years. Due to the year-on-year variability of the survival estimates in smaller areas (for example, Sustainability and Transformation Partnerships), the average annual trend may be increasing over eight years, even though a drop in survival may be observed between two consecutive years.
The annual trend in survival is only reported if at least five annual survival estimates were available and the absolute difference in survival between two consecutive years did not exceed 20 percentage points. The p-value indicates whether or not the average annual change in survival is statistically significant. A p-value lower than 0.05 indicates that we can be more than 95% confident that the trend represents a real change and did not just occur by chance.
Further information regarding the applied methodology is available in the following publications:
Cancer Survival Group. 2004. Life tables for England and Wales by sex, calendar period, region and deprivation. London School of Hygiene and Tropical Medicine (updated 8 January 2016).
Clerc-Urmès I, Grzebyk M, Hédelin G. Net survival estimation with stns. Stata J 2014; 14: 87 to 102.
Corazziari I, Quinn M, Capocaccia R. 2004. Standard cancer patient population for age standardising survival ratios. European Journal of Cancer. 40: pages 2,307 to 2,316
Li, R, and others. 2014. Control of data quality for population-based cancer survival analysis. Cancer Epidemiology. 38: pages 314 to 320.
Pohar Perme M, Stare J, Estève J. On estimation in relative survival. Biometrics 2012; 68: 113 to 20.
9. Acknowledgements
This work uses data provided by patients and collected by the NHS as part of their care and support. All personal data is handled confidentially by Office for National Statistics (ONS) and Public Health England (PHE), in accordance with relevant legislation and codes of conduct.
Back to table of contents