Table of contents
- Main findings
- Collaboration
- Things you need to know about this release
- The most common cancers registered were breast, prostate, lung and colorectal cancers
- Cancer diagnoses and deaths from cancer increase with age
- The three most common cancers vary by sex and age group
- Cancer incidence is highest in the north of England and lowest in London
- Cancer incidences increase while deaths from cancer decrease over time
- What statistics do we calculate?
- Data quality
- Background notes
1. Main findings
The number of new diagnosed cases of cancer in England continues to rise and in 2015 there were almost 300,000 cancers registered – an equivalent to 822 per day.
Breast (15.4%), prostate (13.4%), lung (12.5%) and colorectal (11.6%) cancer continue to account for over half of the malignant cancer registrations in England for all ages combined.
More cancers were registered in males (153,061) than females (146,862). Across the majority of cancer sites more males are diagnosed with cancer than females. This is a persistent feature of the data, reported in previous registration years.
Cancer is primarily a disease of older people, with adults aged 65 and over accounting for 65.2% of the total cancers registered in 2015.
Age-standardised rates of cancer registrations per 100,000 people have increased in both males and females for the period 1995 to 2015. During this period, cancer incidence rates have increased from 648.8 to 667.4 per 100,000 males and from 469.6 to 542.8 per 100,000 females.
The average rate of cancer incidence in England was 595.8 per 100,000 people, but this varied across the country from 566.6 per 100,000 people in London to 649.8 per 100,000 people in the North East.
Back to table of contents2. Collaboration
This publication is produced in partnership with Public Health England. The cancer registration data were collected by the National Cancer Registration and Analysis Service (NCRAS) in Public Health England.
3. Things you need to know about this release
Cancer registrations in England can take up to 5 years after the end of a given calendar year to reach 100% completeness, due to the continuing accrual of late registrations. Therefore, published figures for 2015 are likely to increase in future publications when late registrations are included. Refreshed data for previous years are shown in our time series in the reference tables (Tables 10 and 11).
It is important to note the following with regards to the cancer registrations included in this analysis:
only malignant neoplasms (cancers as described by the World Health Organisation (WHO) ICD-10 codes C00 to C97) have been included in this bulletin, however, the reference tables contain certain in-situ neoplasms, benign neoplasms and neoplasms of uncertain or unknown behaviour for completeness
unless stated otherwise, analysis in this bulletin excludes cancer registrations of non-melanoma skin cancer (NMSC); this common practice in cancer analysis due to the unreliability in estimates caused by variation in policies and practices for the recording of NMSC (see Section 10 for more detail)
the 2015 data has been assessed as 98% complete and there are likely to be late registrations provided after this publication (see Section 10 for more detail)
This work uses data provided by patients and collected by the NHS as part of their care and support.
Back to table of contents4. The most common cancers registered were breast, prostate, lung and colorectal cancers
In England, 299,923 new cancer diagnoses were registered in 2015 with more cancers being registered in males (153,061) than females (146,862). Generally, cancer incidence rates have increased from 648.8 per 100,000 males and 469.6 per 100,000 females in 1995 to 667.4 per 100,000 males and 542.8 per 100,000 females in 2015.
The majority (93%) of cancer registrations were registered in 24 sites of the body, of which breast, prostate, lung and colorectal cancer account for just over half (53%) of registrations (Figure 1).
Figure 1: The number of cancer registrations by the 24 major sites, Persons, England, 2015
Source: Office for National Statistics
Notes:
- The International Classification of Diseases Tenth 10th Revision (ICD-10) was used to classify cancer sites. Non-melanoma skin cancers (ICD-10 C44) were excluded.
- All ages combined.
Download this chart Figure 1: The number of cancer registrations by the 24 major sites, Persons, England, 2015
Image .csv .xlsBreast cancer was the most common cancer diagnosed in 2015, with 46,083 cases registered; 45,764 of which were registered to females, accounting for nearly 1 in 3 (31.2%) of female cancer registrations. The age-standardised incidence rate for breast cancer has increased from 163.6 in 2005 to 170.2 cases per 100,000 females in 2015.
Prostate cancer was the most common cancer diagnosed in males in 2015 with 40,331 cases registered, which accounted for 1 in 4 (26.3%) male cancer registrations. The age-standardised cancer incidence rate for prostate cancer has increased from 166.5 in 2005 to 176.4 cases per 100,000 males in 2015.
The second most common cancer for both males and females was lung cancer. In 2015, there were 37,637 (20,017 males and 17,620 females) cases of lung cancer registered in England. Lung cancer accounted for 13.1% of total cancer registrations for males and 12.0% for females. The age-standardised rate for lung cancer has decreased in males from 127.9 in 1995 to 89.4 cases per 100,000 males in 2015, whilst female age-standardised rates for lung cancer have increased in this same period, from 51.4 in 1995 to 65.6 cases per 100,000 females in 2015.
Colorectal cancer was the third most common cancer for males and females. In 2015 there were 34,729 cases, with 19,178 for males and 15,551 for females. The age-standardised rate for colorectal cancer was 84.6 cases per 100,000 males and 56.8 cases per 100,000 females in 2015, compared with 84.5 cases per 100,000 males and 55.3 cases per 100,000 females in 1995.
Further analysis looking at trends over time is provided in Section 8.
Back to table of contents5. Cancer diagnoses and deaths from cancer increase with age
The majority of cancer cases are registered in the older age groups. Cancer occurring in children, teenagers and young adults (aged 0 to 24) accounted for 1.1% of the total cancer registrations, whereas registrations for those aged 65 and over accounted for 65.2% of the total registrations. Figure 2 shows the number of cancer registrations and the age-specific rates per 100,000 people. Notably, age-specific rates are increasing with age, with the highest rate of new cancer diagnoses in male and females aged 85 to 89.
There are differences between the sexes across the age groups. For those aged 20 to 59, rates of cancer were higher in females than in males and for those aged 40 to 44 in particular, the rate for females was more than double that for males. Much of this difference is due to the high incidence of breast cancer among females in these age groups; in 2015, breast cancer accounted for 43.2% of cancers among females aged 20 to 59.
Rates of cancer were higher in males than females for those aged 60 and over; prostate cancer accounted for 34.5% of all malignant cancers among males aged 65 to 69.
The World Health Organisation (WHO) explains that ageing is a “fundamental factor for the development of cancer. The incidence of cancer rises dramatically with age, most likely due to a build up of risks for specific cancers that increase with age.”
Figure 2: Number of cancer registrations and age-specific cancer incidence rates (per 100,000) in England, 2015

Source: Office for National Statistics
Notes:
- Excluding non melanoma skin cancer (ICD-10 code C44).
Download this image Figure 2: Number of cancer registrations and age-specific cancer incidence rates (per 100,000) in England, 2015
.png (25.9 kB) .xls (27.1 kB)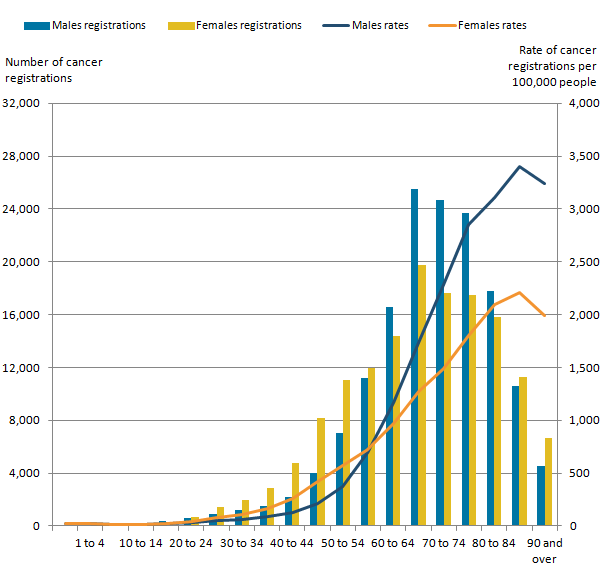
Figure 3 shows the number of deaths from cancer and that the age-specific rates of deaths from cancer increases with age (per 100,000 people). It is important to note that the data presented in Figures 2 and 3 are from different cohorts of patients and so direct comparisons should not be made. For example, someone who died from cancer in 2015 may well have been registered with cancer prior to 2015 and so will not be included in the 2015 cancer incidence figures.
Male age-specific rates of deaths from cancer increase more with age than females. The largest difference in mortality rate is for adults aged 90 and over, where the rates of deaths from cancer is 1,955 cases per 100,000 for females compared with 3,818 cases per 100,000 for males.
Figure 3: Number of deaths from cancer and age-specific rates of deaths from cancer (per 100,000) in England, 2015

Source: Office for National Statistics
Notes:
- Excluding non melanoma skin cancer (ICD-10 codeC44).
- This data is based on mortality data available on NOMIS.
Download this image Figure 3: Number of deaths from cancer and age-specific rates of deaths from cancer (per 100,000) in England, 2015
.png (22.8 kB) .xls (18.9 kB)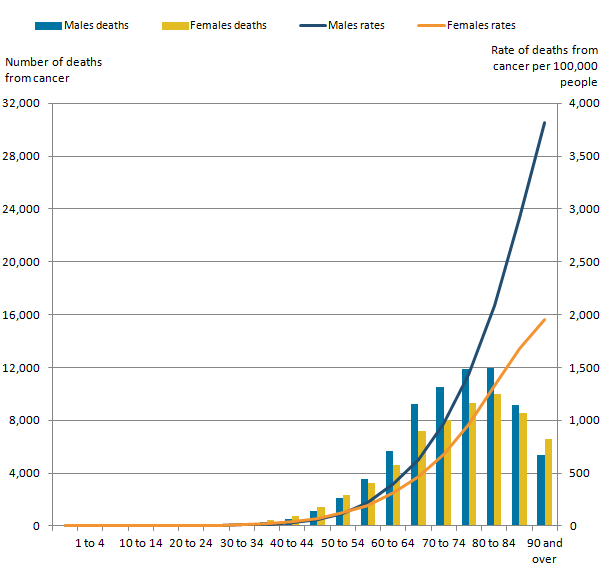
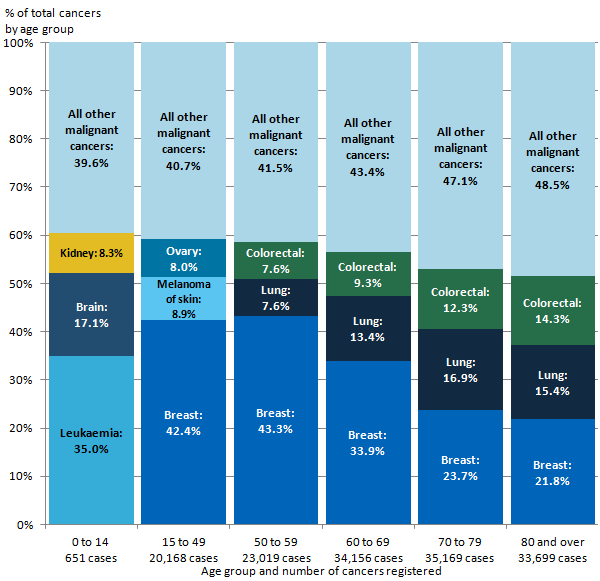
6. The three most common cancers vary by sex and age group
Prostate, breast, lung and colorectal cancer are found to be the most common cancers across England (see Table 1), and this is the case across the UK , according to Cancer Research UK, and worldwide, according to the World Health Organisation (WHO). However, it is interesting to note that the most common cancers in England, vary by sex and age group as Figures 4 and 5 show. For instance:
leukaemia, brain, Non-Hodgkin’s Lymphoma (males) and kidney (females) were the most common cancer registrations in childhood (those aged 0 to 14); these cancers accounted for over half of the 1,442 cancer cases registered in children
for males aged 15 to 49, testicular, skin melanoma and colorectal cancer were the three most common cancer registrations;- for females, the most common cancer registrations were breast, melanoma of the skin and ovarian cancer
for those aged 50 and over, prostate, breast, lung and colorectal cancer were the most common cancer cases registered; for example, in 2015 the number of breast cancer cases registered for those aged 50 to 59 and 60 to 69 in 2015 was 9,975 and 11,574 respectively, whilst 14,609 cases of prostate cancer were registered for those aged 70 to 79 and 7,211 cases were registered for men aged 80 and over
It should be mentioned that the most common cancers vary by the age group used to categorise the data. The age groups we use were chosen to align with the age breakdown in our cancer survival bulletins, which are designed to align with the NHS Outcomes Framework Indicators.
Figure 4: The three most common cancers for males by age group, England, 2015

Source: Office for National Statistics
Notes:
- Excluding non melanoma skin cancer (ICD-10 code C44).
Download this image Figure 4: The three most common cancers for males by age group, England, 2015
.png (35.5 kB) .xls (18.9 kB)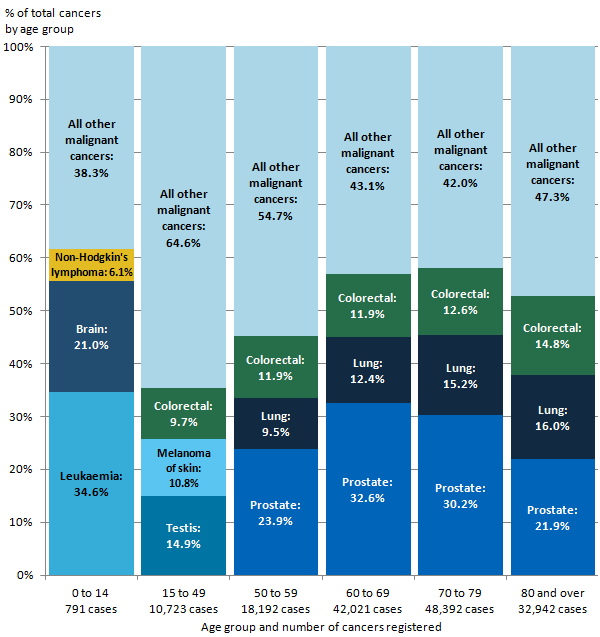
Figure 5: The three most common cancers for females by age group, England, 2015
Source: Office for National Statistics
Notes:
- Excluding non melanoma skin cancer (ICD-10 code C44).
Download this image Figure 5: The three most common cancers for females by age group, England, 2015
.png (32.0 kB) .xls (18.9 kB)
When interpreting Figures 4 and 5 it is important to note that the number of cases differs between age groups.
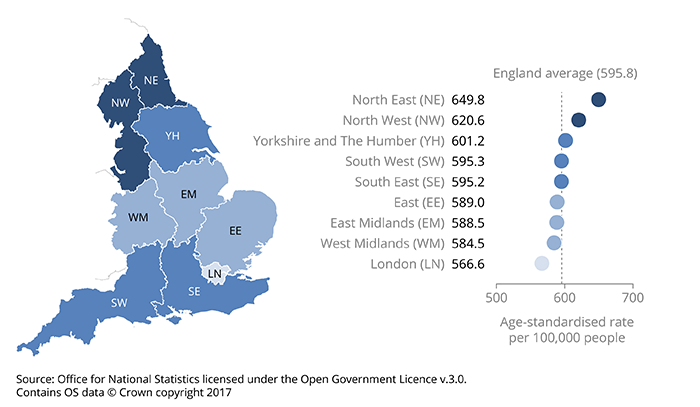
Back to table of contents7. Cancer incidence is highest in the north of England and lowest in London
Figure 6: Age-standardised cancer incidence rates (per 100,000 people) by English regions, all cancers, all persons, 2015
Source: Office for National Statistics licensed under the Open Government Licence v.3.0. Contains OS data © Crown copyright 2017
Notes:
- Excluding non-melanoma skin cancer (ICD-10 C44).
- All persons combined. Separate age-standardised rates for males and females can be found in the reference table provided.
Download this image Figure 6: Age-standardised cancer incidence rates (per 100,000 people) by English regions, all cancers, all persons, 2015
.png (102.6 kB) .xls (19.5 kB)
The age-standardised cancer incidence rate in 2015 varied across the English regions. For all persons, the rate ranged from 566.6 (London) to 649.8 (North East) per 100,000 people and the average in England was 595.8 per 100,000 (as shown in Figure 6). The age-standardised cancer incidence rate was 14.7% higher in the North East compared with London. This regional variation in cancer incidence rates has increased from 9.1% in 2014 to 14.7% in 2015.
When looking at the age-standardised rate, the regional variations differ by specific cancers, for example:
for prostate cancer, London had the highest rate, at 194.0 per 100,000 males; this was followed by the South East with 192.9 per 100,000 males; in contrast, the North East had the lowest rate at 149.8 per 100,000 males
the colorectal incidence rate for males was highest in the North East at 92.7 per 100,000 and lowest in London at 75.3 per 100,000; the incidence rate for females was highest in the East of England at 59.8 per 100,000 and lowest in London at 51.8 per 100,000 females
lung cancer showed the greatest variation between the north and south regions; 120.5 per 100,000 males and 99.9 per 100,000 females were diagnosed in the North East compared with 76.0 per 100,000 males and 53.2 per 100,000 females in the South West
breast cancer incidence rates for females ranged from 159.3 per 100,000 females in London to 182.4 per 100,000 in the South East
It is important to note that caution should be taken when interpreting regional variations. There are regional differences in lifestyle behaviours, such as the variance in drinking habits and smoking prevalence across the country. Furthermore, factors should be considered like prostate-specific antigen testing, which is not a national screening programme. Any regional differences in the availability and uptake of this test may contribute to regional differences in the age-standardised rate.
Back to table of contents8. Cancer incidences increase while deaths from cancer decrease over time
Generally, cancer incidence rates have increased. Advances in medicine have resulted in early detection of cancers, increasing the detection of cancer while reducing the number of people dying from the disease. Therefore, cancer mortality rates have generally decreased over time, despite the increase in cancer incidence. England’s cancer survival estimates are increasing over time as a result. The England cancer mortality is a subset taken from the Deaths Registered in England and Wales: 2015 (DR Series).
As shown in Figure 7, the gap between incidence and death from cancer, for all cancers combined, widens in later years.
In 2015, the cancer incidence rates increased for both males and females at 667.4 and 542.8 per 100,000 people respectively, from 648.8 per 100,000 males and 469.6 per 100,000 females in 1995.
In 1995, the cancer mortality rates were higher for both males and females, at 427.8 and 268.4 per 100,000 respectively and fell to 329.5 per 100,000 males and 226.6 per 100,000 females in 2015. The rising trend in incidence and reduction in the cancer mortality rate is reflected in the positive trend in survival for the majority of cancers over the same period, as discussed in the Cancer survival in England statistical bulletins.
Figure 7: Directly age-standardised rates per 100,000 people of newly diagnosed cases of cancer and deaths from cancer: England, 1995 to 2015
Source: Office for National Statistics
Notes:
- The International Classification of Diseases Tenth Revision (ICD-10) was used to classify cancer sites for incidence data for all years.
- Mortality rates for years 1995 to 2000 inclusive have been mapped from The International Classification of Diseases Ninth Revision (ICD-09) and can be downloaded from the data supporting this figure.
- Excluding non-melanoma skin cancer (ICD-10 C44).
- All ages combined.
Download this chart Figure 7: Directly age-standardised rates per 100,000 people of newly diagnosed cases of cancer and deaths from cancer: England, 1995 to 2015
Image .csv .xlsFor the most common cancers in males and females (male prostate and female breast), the increase in the number of diagnosed cancers contrasts with the decreasing mortality, indicating that the number of patients surviving from prostate and breast cancer has improved over this time period (Figures 8 and 9). Early detection and diagnoses of cancers leads to quicker treatment, resulting in improved survival. It is important to note that screening is only available for some cancers and this varies across the country. For example, there is a national screening programme for breast cancer for women (aged 50 to 70) in England, but Prostate-Specific Antigen (PSA) testing is not a national screening programme.
Figure 8: Directly age-standardised rates per 100,000 females of newly diagnosed cases of breast cancer and deaths from breast cancer, England, 1995 to 2015
Source: Office for National Statistics
Notes:
- The International Classification of Diseases Tenth Revision (ICD-10) was used to classify cancer sites for incidence data for all years.
- Mortality rates for years 1995 to 2000 inclusive have been mapped from The International Classification of Diseases Ninth Revision (ICD-09).
- All ages combined.
Download this chart Figure 8: Directly age-standardised rates per 100,000 females of newly diagnosed cases of breast cancer and deaths from breast cancer, England, 1995 to 2015
Image .csv .xls
Figure 9: Directly age-standardised rates per 100,000 males of newly diagnosed cases of prostate cancer and deaths from prostate cancer, England, 1995 to 2015
Source: Office for National Statistics
Notes:
- The International Classification of Diseases Tenth Revision (ICD-10) was used to classify cancer sites for incidence data for all years.
- Mortality rates for years 1995 to 2000 inclusive have been mapped from The International Classification of Diseases Ninth Revision (ICD-09).
- All ages combined.
- The increase in incidence over time is partly due to prostate-specific antigen (PSA) testing which began in the early 1990s.
Download this chart Figure 9: Directly age-standardised rates per 100,000 males of newly diagnosed cases of prostate cancer and deaths from prostate cancer, England, 1995 to 2015
Image .csv .xlsAfter breast and prostate cancers, the most commonly diagnosed cancers in both males and females are lung and colorectal cancer.
Lung cancer shows a contrasting trend over the years for males and females (Figure 10). The incidence rate for males decreased from 127.9 diagnoses per 100,000 in 1995 to 89.4 diagnoses per 100,000 in 2015. Mortality rates decrease alongside incidences for males and drop by 40.2%, from 117.2 per 100,000 in 1995 to 70.1 per 100,000 in 2015.
In contrast, lung cancer incidence for females has increased by 27.6% over the same period from 51.4 diagnoses per 100,000 in 1995 to 65.6 diagnoses per 100,000 in 2015. Mortality rates for females remain fairly consistent since 1995 with only a slight increase of 5.0% to 2015, rising from 45.9 per 100,000 in 1995 to 48.2 per 100,00 in 2015.
Figure 10: Directly age-standardised rates per 100,000 people of newly diagnosed cases of lung cancer and deaths from lung cancer, England, 1995 to 2015
Source: Office for National Statistics
Notes:
- The International Classification of Diseases Tenth Revision (ICD-10) was used to classify cancer sites for incidence data for all years.
- Mortality rates for years 1995 to 2000 inclusive have been mapped from The International Classification of Diseases Ninth Revision (ICD-09).
- All ages combined.
Download this chart Figure 10: Directly age-standardised rates per 100,000 people of newly diagnosed cases of lung cancer and deaths from lung cancer, England, 1995 to 2015
Image .csv .xlsThe gap in lung cancer incidence between males and females has been narrowing for a number of years. There has been a steady decrease in male lung cancer since the 1980s, whereas lung cancer incidence among females has steadily been increasing since the 1970s. The change in incidence could be explained by smoking, which is identified as the most common cause of lung cancer. Figure 11 shows the decline in average daily cigarette consumption since 1974, as described in Adult Smoking Habits in the UK: 2015. Over time, average daily cigarette consumption among men who smoke has typically been higher than in female smokers. Despite this, in recent years the gap between male and female cigarette consumption has been narrowing.
Figure 11: Average daily cigarette consumption among male and female smokers in the UK, 1974 to 2015
Source: Office for National Statistics
Notes:
- Data has been extracted from the recent ONS Adult Smoking Habits in the UK:2015 bulletin.
- The average refers to the mean.
- Data are weighted from 2000 onwards.
- Data on cigarette use were collected on a two-year basis prior to 2000.
- Estimates prior to 2005 are based on fiscal year as opposed to calendar year.
Download this chart Figure 11: Average daily cigarette consumption among male and female smokers in the UK, 1974 to 2015
Image .csv .xlsColorectal incidence and mortality rates have remained relatively consistent from the period 1995 to 2015 for both males and females (Figure 12). Incidences show little change from 1995, while there is a general decrease in mortality from colorectal cancer over the period. Recent trends in colorectal cancer could be influenced by the impact of bowel cancer screening, which was introduced in 2006. These trends could also be influenced by the reduction of risk factors associated with bowel cancer (for example, diet and smoking).
Figure 12: Directly age-standardised rates per 100,000 people of newly diagnosed cases of colorectal cancer and deaths from colorectal cancer, England, 1995 to 2015
Source: Office for National Statistics
Notes:
- The International Classification of Diseases Tenth Revision (ICD-10) was used to classify cancer sites for incidence data for all years.
- Mortality rates for years 1995 to 2000 inclusive have been mapped from The International Classification of Diseases Ninth Revision (ICD-09).
- All ages combined.
Download this chart Figure 12: Directly age-standardised rates per 100,000 people of newly diagnosed cases of colorectal cancer and deaths from colorectal cancer, England, 1995 to 2015
Image .csv .xls9. What statistics do we calculate?
Cancer incidence rate
The number of new cancer registrations in a specific population during a particular time period per 100,000 people. This is calculated using the following equation:
Cancer incidence rate= (total number of cancer registrations / by total population) X 100,000.
A cancer incidence rate can be calculated by specific age groups; this is referred to as an age-specific cancer incidence rate. We calculate incidence rates for ICD-10 codes C00 to C97 and D00 to D48 (excluding D04, D10 to D31, D34 to D35.1, and D35.5 to D36), all of which can be found in the reference table provided.
Age-standardised cancer incidence rate
A weighted average of the age-specific cancer incidence rates, the weights used are age-specific proportions of a standardised population (2013 European Standard Population (ESP)). By standardising cancer incidence rates with the ESP, geographical and time comparisons can be made, as the differing age structure of a particular population has been accounted for.
Also included in our reference tables are mortality to incidence ratios and the standardised registration ratio (SRR).
Mortality to incidence ratios
Cancer mortality to incidence ratios are calculated by dividing the number of deaths from cancer by the number of cancer diagnoses for each given cancer site, sex and region. It is important to note that the number of deaths from cancer might include people who were diagnosed before 2015; therefore, caution should be taken when interpreting these statistics.
Standardised registration ratio (SRR)
A cancer incidence rate (age and sex specific) is taken as a standard rate; we take England as the standard. The standard rate is then applied to another index population of known age structure (for example, the South West of England) to calculate how many registrations would have been expected in this index population had they, at each age group, experienced the standard cancer incidence rate (in this example, England).
The “expected” incidence is then compared with the observed incidence rate in the index population (in this example, the South West), with the ratio being multiplied by 100 to give the standardised registration ratio, in which 100 is the value for the standard rate (in this example, England). An SRR of 106 would mean the cancer incidence in the index region (in this example, the South West) is 6% higher than the standard rate (England). Conversely, an SRR of 94 would mean the cancer incidence was 6% lower.
Cancer registration data collection in England
Cancer registrations in England are submitted to Office for National Statistics (ONS) by the National Cancer Registration and Analysis Service (NCRAS) in Public Health England. The registration of cancer cases is a dynamic process where the data files, both at NCRAS and at ONS, are always open and changing. Cancer data files are dynamic in a number of ways, such as:
new cancer cases will be registered; this can include new “late” registrations, where a case is registered after the cancer registry or ONS, or both, have published for a particular year
cancer records can be amended: for example, the site code of a record would be modified if later more accurate information became available
cancer records can be cancelled, although this is unusual
Data are submitted to the NCRAS from a range of health care providers and other services (for example, pathology laboratories). As the data come from different sources, the quality and accuracy of the data submitted may vary.
The NCRAS carefully collate and validate all the data for each patient, before sending a subset of the data, defined as the cancer registration minimum dataset, to ONS for further validation and processing. The extensive checks run by us include the compatibility of the cancer site and the associated histology, and are closely based on those promoted by the International Agency for Research on Cancer.
Once all the expected records for any one incidence year have been received and validated, we take a snapshot of the dataset, which allows us to publish the numbers and rates of all types of cancer by age, sex and region of residence. Cancer incidence tables for this release were created from a snapshot taken in December 2016. It is important to remember that the snapshot of cancer registration data will be different year-on-year due to the dynamic nature of the dataset. Therefore, you will find that the incidence count for 2014 (for example) differs in the current publication compared with the previous publication.
Taking a new snapshot of the dynamic National Cancer Registry database usually results in a difference between what was previously published and what is published from this snapshot dataset. The balance between ensuring completeness of the data but publishing cancer incidence figures in a timely manner is a necessary compromise. The gap between what was first published for a registration year and the most recent cancer incidence figures has varied considerably over time, as shown in Figure 13. Over the 43-year period reported, differences between what has been previously published and the current number (refreshed in 2017) of registrations for each year average less than 5%.
Figure 13: Number of neoplasm registrations previously published in the annual report (MB1 series) and currently on the ONS National Cancer Registry database, England, 1971 to 2014
Source: Office for National Statistics
Notes:
- Figures for 1971 to 1994 have been extracted from the “frozen” historical data-set.
- The published figures for 1971 to 1978 correspond to all malignancies, not all registrations. From 1979 the numbers refer to all malignant and benign cancer registrations including non-melanoma skin cancer (C44).
- Successful work has been completed to code a backlog of cases for non-melanoma skin cancer (C44) since 2013, which will show an increase in the published data in 2014.
- Refreshed figures at January 2017. Previously published figures are taken from the corresponding cancer registration report. For example, figures for 2014 were taken from the report published in May 2016.
Download this chart Figure 13: Number of neoplasm registrations previously published in the annual report (MB1 series) and currently on the ONS National Cancer Registry database, England, 1971 to 2014
Image .csv .xls10. Data quality
The figures for numbers and rates of “all cancers” in this release refer to all malignant neoplasms (ICD-10 C00 to C97), excluding non-melanoma skin cancer (ICD-10 C44). Although non-melanoma skin cancer (NMSC) is very common, the available figures are known to be under-estimates and unreliable for comparison purposes. This is because the policies and practices for the recording of NMSC have varied among the cancer registries. Therefore, NMSC registrations have been excluded from the figures for “all cancers” in this publication.
Known data quality matters this year:
the increase in prostate cancer in 2013 has been assessed as primarily being due to changes in systems to collect and record clinically diagnosed cases. The incidence of prostate cancer in 2014 and 2015 is at a similar level prior to 2013
any regional differences in benign, uncertain and unknown neoplasms should be interpreted with caution; there is known historic variation in the way cancer registries recorded these tumours across the country and they do not receive as much analytical attention and scrutiny as the invasive cancers
the last 5 years of cancer registrations are more likely to be subject to change as we refresh the dataset in future publications, as most changes will occur within the latest 5 years; any commentary based on these last few years is less reliable as we estimate it to be only 98% complete, and commentaries relating to less than the last 5 years are meant as current observations of the data and should not be taken as long-term estimates on cancer trends
Further details about the cancer registration data can be found in the Cancer Registration Statistics Quality and Methodology Information report and in previous annual publications.
Users and uses of cancer statistics
Main users of cancer registration statistics include:
Department of Health
academics and researchers
cancer charities
cancer registries
other government organisations
Office for National Statistics researchers
the media
general public
The main uses of cancer registration statistics include:
providing an evidence base to inform cancer policy and programmes
informing cancer research
feeding into cancer information leaflets, web pages and campaigns to raise cancer awareness
producing National Statistics on cancer incidence and survival
briefing parliamentary ministers
providing answers to parliamentary questions
providing bespoke tables for customers
Policy context
Cancer incidence (number of cancer cases registered) data allow policy makers to measure the extent of cancer within the population in England. Cancer incidence data are used alongside cancer prevalence, mortality and survival data to allow policy makers to ascertain the burden of cancer in England.
Cancer incidence data directly help to form policy on the prevention of cancer. The incidence data are also important in calculating cancer survival (in conjunction with mortality data), which is then used to determine a number of policy streams within government and also to monitor a number of performance indicators for the English healthcare system. The indicators set for the NHS Outcomes Framework include 1-year and 5-year cancer survival indicators for all cancers combined and for colorectal, breast and lung cancers combined.
Back to table of contents11. Background notes
The age-standardised rates in this release are expressed per 100,000 population and are standardised to the European Standard Population 2013 (ESP 2013). They are standardised to allow for more robust comparisons between males and females, years and geographical areas. Previously published rates for 1995 to 2011, based on ESP 1976, have been recalculated using the ESP 2013. Rates will therefore differ from those previously published. More information is available in The impact of using 2013 European Standard Population to calculate mortality and cancer incidence rates.
Cancer incidence rates are based on the latest mid-year population estimates for the reference year at the time of publication.
Cancer incidence data from the National Cancer Registry at Office for National Statistics (ONS) are used to calculate National Statistics on cancer survival.
By most common we mean the three cancers (by sex) with the greatest number of cases registered in 2015. Furthermore, we look at only cancers, which are coded in the International Statistical Classification of Diseases 10th Revision (ICD-10) as C00 to C97, excluding C44 (non melanoma skin cancer), and therefore exclude non-malignant codes D00 to D48.
In common with cancer registries in other countries, cancer registrations in England can take up to 5 years after the end of a given calendar year to reach 100% completeness, due to the continuing accrual of late registrations. The figure of 98% is an estimate of completeness based on the figures published for 3 previous years’ data (2012 to 2014), compared with the number of late registrations subsequently received for these years in the refreshed time series from 1995 to 2015, published in 2017. It is therefore the difference between what figures have been published in all ONS cancer incidence publications within a given reporting year, versus late registrations received after the publication date cut-off and updated in a subsequent year. It is not an estimate of the number of cancers that never get recorded.
The agreed procedures to be followed by the cancer registries and ONS, when submitting and processing data, are set out in the “Registry/ONS Interface Document”. These are summarised by three levels of quality status, where levels one and two can be included in tables. It is a requirement that when a registry’s data for a particular year are complete, no more than 0.5% of records should have a quality recorded as Status 3, and over the past 15 years the proportion of records with serious errors has consistently been 0.1% or less. The quality status of all the records on the ONS cancer registration database from 1971 to 2015 is shown in Table 14 of the reference tables associated with this publication.
Special extracts and tabulations of cancer data for England are available to order (subject to legal frameworks, disclosure control, resources and agreement of costs, where appropriate). Such enquiries should be made to the Cancer Analysis Team via email at cancer.newport@ons.gov.uk or by telephone at +44 (0)1633 651848.
Details of our publication scheme are also available.
As a valued user of our statistics, we would welcome your feedback on this release. In particular, the content, format and structure.
Details of the policy governing the release of new data are available from the UK Statistics Authority.
Additional Information
Further cancer statistics are also available.
Information about statistics on cancer registrations that we publish can be found in the Cancer Registration Statistics Quality and Methodology Information report. Quality and Methodology Information reports are overview notes which pull together important qualitative information on the various dimensions of the quality of statistics as well as providing a summary of the methods used to compile the output. Information about main users of these statistics is also provided.
Acknowledgements
The National Cancer Registry at the Office for National Statistics wishes to acknowledge the work of all the staff working in the National Cancer Registration and Analysis Service (NCRAS), Public Health England, which provided the raw data for these analyses.
More information about the NCRAS is available via Public Health England.
The Director of Disease Registration (which incorporates cancer registration) for Public Health England is Dr Jem Rashbass of the National Cancer Registration and Analysis Service. For more information or any enquiries, please email NCRASenquiries@phe.gov.uk or telephone +44 (0)20 7654 8000.
The contact details for the Welsh, Scottish and Northern Ireland Cancer Registries are as follows:
Welsh Cancer Intelligence Surveillance Unit
wcu.stats@wales.nhs.uk
+44 (0)29 2037 3500
Scottish Cancer Registry
nss.isdcancerstats@nhs.net
+44 (0)131 275 7050
Northern Ireland Cancer Registry
nicr@qub.ac.uk
+44 (0)28 9097 6028
The cancer registries are all members of the United Kingdom and Ireland Association of Cancer Registries (UKIACR).
Back to table of contents