Table of contents
- Main points
- Latest indicators at a glance
- Business impact of the coronavirus
- Social impacts of the coronavirus on Great Britain
- Company incorporations and voluntary dissolution applications
- Online price change in food and drink basket
- Online job adverts
- Footfall
- Roads and traffic camera data
- Shipping
- Data
- Glossary
- Measuring the data
- Strengths and limitations
- Related links
1. Main points
According to the Business Impact of Coronavirus (COVID-19) Survey, 15% of the workforce of UK businesses that have not permanently ceased trading were on partial or full furlough leave (an increase from 9% in Wave 17). See Section 3.
According to the latest Opinions and Lifestyle Survey, the proportion of adults in Great Britain shopping for things other than food and medicine remained low, at 12%. See Section 4.
Prices of items in the food and drink basket decreased by 0.1% in the latest week. See Section 6.
Between 13 November and 20 November 2020, total online job adverts increased by 2 percentage points but is still only 71% of the level seen in the same week last year. See Section 7.
According to Springboard, in the week ending 22 November 2020, overall UK footfall was at 45% of the level seen at the same time last year. See Section 8.
On Monday 23 November 2020, the volume of all motor vehicle traffic remained 22 percentage points below the levels seen on the first Monday of February 2020. See Section 9.
In the week ending 22 November 2020, the average number of daily ships visits in the UK decreased to 277 visits from 291 in the previous week. See Section 10.
Results presented throughout this bulletin are experimental and may be subject to revision.
2. Latest indicators at a glance
Embed code
Source: Office for National Statistics – Faster indicators
Back to table of contents5. Company incorporations and voluntary dissolution applications
Incorporations
Figure 2: In the week ending Friday 20 November 2020, there were 18,310 company incorporations, its highest in six weeks and also higher than the same week in the previous year (12,584)
Total weekly company incorporations, UK, from week ending Friday 4 January 2019 to week ending Friday 20 November 2020
Source: Companies House and Office for National Statistics
Notes:
- Week 1 refers to the period week ending 4 January 2019 and week ending 3 January 2020. Week 47 refers to the period week ending 15 November 2019 and week ending 20 November 2020.
- The dip in December 2019 is explained by two bank holidays in the week ending Friday 27 December 2019.
- Weekly data are for week commencing Saturday to Friday, as incorporation requests received on Saturdays and Sundays are typically processed on subsequent weekdays. For more information, see the accompanying Companies House methodology page.
Download this chart Figure 2: In the week ending Friday 20 November 2020, there were 18,310 company incorporations, its highest in six weeks and also higher than the same week in the previous year (12,584)
Image .csv .xlsVoluntary dissolution applications
Figure 3: In the week ending Friday 20 November 2020, there were 5,367 voluntary dissolution applications , an increase from the previous week but lower than the same week in the previous year (6,070)
Total weekly company voluntary dissolution applications, UK, from week ending Friday 4 January 2019 to week ending Friday 20 November 2020
Source: Companies House and Office for National Statistics
Notes:
- Week 1 refers to the period week ending 4 January 2019 and week ending 3 January 2020. Week 47 refers to the period week ending 15 November 2019 and week ending 20 November 2020.
- The dip in December 2019 is explained by two bank holidays in the week ending Friday 27 December 2019.
- Weekly data are weeks from Saturday to Friday, as voluntary dissolution requests received on Saturdays and Sundays are typically processed on subsequent weekdays. For more information, see the accompanying Companies House methodology page.
- Increased Companies House operational activity during week ending 8 November 2019 caused a spike in total weekly company voluntary dissolution applications. This data point should be treated with caution.
Download this chart Figure 3: In the week ending Friday 20 November 2020, there were 5,367 voluntary dissolution applications , an increase from the previous week but lower than the same week in the previous year (6,070)
Image .csv .xlsFor more information on other measures of company closures not presented here, see Weekly indicators of company creations and closures from Companies House methodology: August 2020.
Back to table of contents6. Online price change in food and drink basket
A timely indication of weekly online price change for a selection of food and drink products from several, large UK retailers has been developed, covering the period 1 June to 22 November 2020. Details of the methodology used for these indicators can be found in Online price changes methodology. This analysis is experimental and should not be compared with our regular consumer price statistics.
The data time series, weekly growth rates, and contributions to the weekly change for all individual food and drink items, along with sample sizes, are published in a dataset alongside this release.
The addition of data, originally missing from the collection in the week ending 15 November 2020, has resulted in minor revisions to that week’s figures.
Online prices of items in the food and drink basket decreased overall by 0.1% between the week ending 15 November 2020 and the week ending 22 November 2020. This is the sixth consecutive week of price decreases across all food and drink items. Figure 4 presents the contributions to the latest weekly change from each of the main categories of items.
Figure 4: Prices of items in the food and drink basket decreased by 0.1% in the latest week.
Contributions to online price change of a selection of food and drink products, UK, percentage point contributions to the percentage change between the week ending 15 November 2020 and the week ending 22 November 2020
Source: Office for National Statistics - Online price collection
Notes:
- Contributions may not always sum to the weekly change, as a result of rounding.
Download this chart Figure 4: Prices of items in the food and drink basket decreased by 0.1% in the latest week.
Image .csv .xlsThere were two main contributors to the overall price fall in the latest week. Firstly, the category of mineral waters, soft drinks and juices contributed negative 0.04 percentage points to the overall fall in the food and drink basket in the latest week, over half of which came from price decreases for fizzy drinks. Fruit prices also contributed negative 0.04 percentage points, half of which came from price decreases for peanuts, although 11 of the 18 “fruit” items showed price decreases.
Spirits was also a large contributor to the overall price fall in the latest week. This category contributed negative 0.03 percentage points to the overall fall, driven by price falls for all spirit items except alcopops.
Several categories experienced price rises, partially offsetting these falls in the latest week. This includes bread and cereals, which was the main contributor to last week’s overall price fall.
Figure 5 with the data time series for the all-item index and some of the leading categories of the weekly change, shows that the all-item index has been on a broadly downward trend since the beginning of June 2020. It has now fallen for the sixth consecutive week.
Mineral waters, soft drinks and juices, and spirits have shown broadly similar trends over the last few months, with prices peaking in early October 2020 before steadily falling in recent weeks. Fruit prices peaked at the end of October 2020, but prices have also started to drop. All three categories are now slightly below their starting point in June 2020.
The oils and fats category, while having a minor contribution to the week-on-week changes, has shown a continuous decline since June 2020 and is now 6.3% lower than its starting point.
Within the oils and fats category, margarine and olive oil have been the biggest drivers behind the downward trend.
Figure 5: The all-item index has remained below its initial level (first week in the series) for the entire data time series and has now fallen for the sixth consecutive week
Online price change of selected food and drink products: index week commencing 1 June 2020 = 100, UK
Source: Office for National Statistics - Online price collection
Notes:
- The time series for all individual food and drink items are published in a dataset alongside this release.
Download this chart Figure 5: The all-item index has remained below its initial level (first week in the series) for the entire data time series and has now fallen for the sixth consecutive week
Image .csv .xls7. Online job adverts
These figures use job adverts provided by Adzuna, an online job search engine, and include experimental estimates of online job adverts by Adzuna category and by UK country and NUTS1 region. The number of job adverts over time is an indicator of the demand for labour. The Adzuna categories used do not correspond to Standard Industrial Classification (SIC) categories, so these values are not directly comparable with the Office for National Statistics (ONS) Vacancy Survey.
Users should be aware that we have changed the presentation of our online job advert data to show the percentage change from the same week in the previous year of each category. This replaces our previous analyses, which compared the current period with a whole of 2019 average, and removes some of the seasonality that previous comparisons may have contained.
Users should also be aware that the 2019 average data will still be published alongside the percentage change from the same week in the previous year.
Figure 6: Between 13 November and 20 November 2020, total online job adverts increased by two percentage points but are still only 71% of the level seen in the same week last year
Total weekly job adverts on Adzuna, UK, 4 January 2019 to 20 November 2020, percentage change from the same week in the previous year
Embed code
Notes:
The observations were collected on a roughly weekly basis; however, before June 2020 they were not all observed at the same point in each week, leading to slightly irregular gaps between some observations.
These series have a small number of missing weeks, mostly in late 2019, and the latest is in January 2020. These values have been imputed using linear interpolation. The data points that have been imputed are clearly marked in the accompanying dataset.
Further category breakdowns are included in the Online job advert estimates dataset, and more details on the methodology can be found in Using Adzuna data to derive an indicator of weekly vacancies.
In the latest week, total online job adverts saw a slight increase of two percentage points but are still only 71% of the level seen in the same week last year, compared with 69% in the previous week.
Catering and hospitality saw the largest annual decrease to just 25% of the level of online job adverts seen in the same period last year. Healthcare and education remain the categories with the highest volume of online job adverts in comparison with a year ago. Both are around 80% of the level seen in the same period last year.
Excluding the “unknown” category, in comparison with the previous week, the number of online job adverts increased in 21 of the Adzuna categories, decreased in five categories, and stayed the same in the remaining two. The largest weekly increase came from “charity/volunteering”, which increased by 10 percentage points, followed by “other/general”, which increased by nine percentage points on the week.
The largest weekly decrease of five percentage points came from “energy/oil and gas”. Please note the trends of all the categories discussed can be seen in the accompanying dataset.
Figure 7: Online job adverts for all UK regions increased in the latest week
Total weekly job adverts on Adzuna, UK, 4 January 2019 to 20 November 2020, percentage change from the same week in the previous year
Embed code
Notes:
There is a level shift in the Northern Ireland series from 17 October 2019 due to a large source of Northern Ireland job adverts being removed, and another level shift from 7 August 2020 because of a new source being included.
The October 2020 spike and most recent weekly increase in the Northern Ireland series should be treated with caution because of the increased coverage from a year ago.
8. Footfall
These figures are provided by Springboard, a provider of data on customer activity. They measure the volume of footfall compared with the same day the previous year at the overall level and across the categories of high streets, retail parks and shopping centres. For example, Sunday 22 November 2020 was compared with Sunday 24 November 2019.
Figure 8: In the week ending 22 November 2020, overall UK footfall was at 45% of the level seen at the same time last year, similar to last week’s footfall
Volume of footfall, percentage change from the same day the previous year, UK, 1 March to 22 November 2020
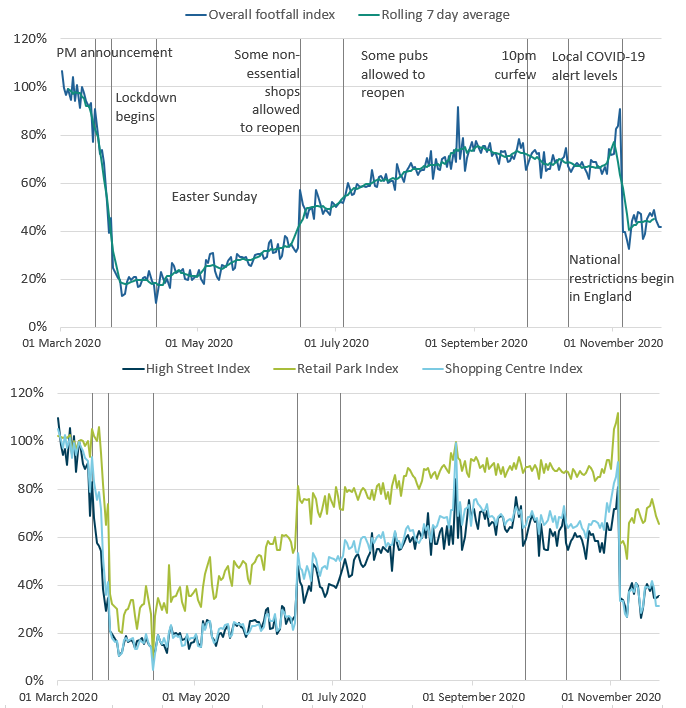
Source: Springboard and the Department for Business, Energy and Industrial Strategy
Notes:
- “PM announcement” refers to the advisory announcement on 16 March 2020 to avoid non-essential travel, bars, restaurants and other indoor leisure venues, and to work from home if possible.
- From Thursday 5 November until Wednesday 2 December 2020, England has entered a period of national restrictions which, amongst other measures, has asked the public to stay at home except for specific purposes and has closed certain businesses and venues. This includes pubs, bars, dine-in restaurants and non-essential retail.
Download this image Figure 8: In the week ending 22 November 2020, overall UK footfall was at 45% of the level seen at the same time last year, similar to last week’s footfall
.png (98.5 kB)
Figure 8 shows that in the latest week, the overall seven-day average footfall remained similar to the previous week, at 45% of the level seen the same day last year. This remains above the spring lockdown low point seen in the week ending 12 April 2020.
Footfall across all retail locations in the UK increased slightly in the latest week compared with the previous week. Footfall across retail parks in the UK increased in the latest week compared with the previous week by three percentage points to 71% of levels seen last year. Footfall on high streets and shopping centres each saw a slight increase, to 37% of levels seen the same time last year.
Figure 9: Footfall in Northern Ireland has increased substantially compared with last week ahead of new restrictions coming into force from 27 November 2020.
Overall volume of daily footfall, percentage change from the same day the previous year, UK, 1 March to 22 November 2020
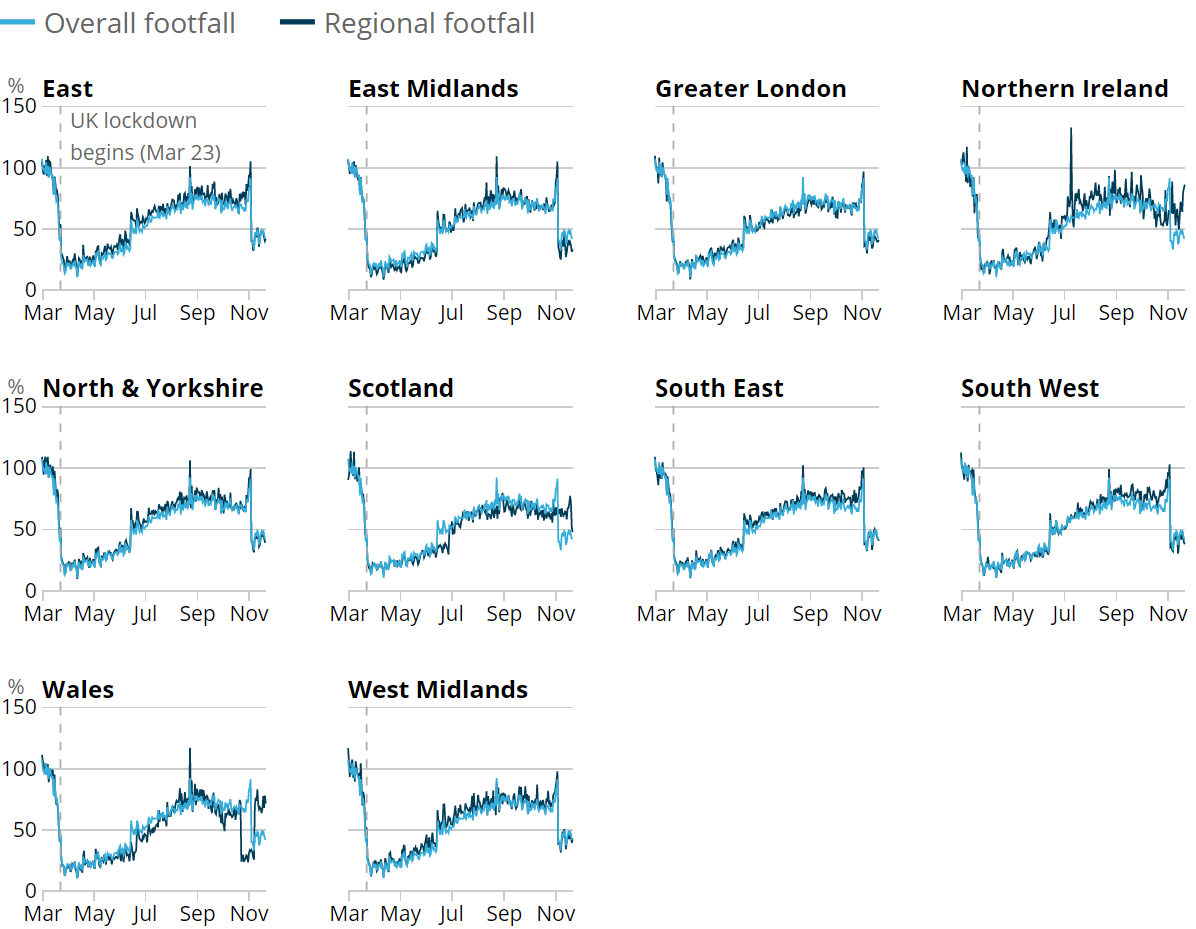
Source: Springboard and the Department for Business, Energy and Industrial Strategy
Notes:
- On Monday 12 October 2020 new local COVID Alert Levels were announced in England introducing a new three-tier system. A firebreak for Wales was introduced on Friday 23 October 2020 which ended on 9 November 2020. Non-essential shops in Northern Ireland, which reopened on 12 June 2020, are allowed to remain open under the latest restrictions agreed by the executive. In Scotland, shops can remain open but new rules for the hospitality sector took effect on 9 October 2020.
- From Thursday 5 November until Wednesday 2 December 2020, England has entered a period of national restrictions which, amongst other measures, has asked the public to stay at home, except for specific purposes and has closed certain businesses and venues. This includes pubs, bars, dine-in restaurants and non-essential retail.
Download this image Figure 9: Footfall in Northern Ireland has increased substantially compared with last week ahead of new restrictions coming into force from 27 November 2020.
.png (152.4 kB)
Figure 9 shows the volume of footfall in each English region and UK country compared with the same day the previous year. In the latest week, (week ending 22 November 2020) footfall increased substantially in Northern Ireland to 73% of levels seen last year, a 12 percentage point increase on the previous week. This can be explained by the temporary removal of some restrictions under Northern Ireland’s circuit breaker and a surge in retail activity ahead of new restrictions coming into force from 27 November 2020. Footfall increased slightly in Scotland and across all English regions except the East Midlands.
Wales experienced a decline of two percentage points on the previous week. Despite this, Wales continues to see volumes of weekly footfall similar to those seen before the national firebreak, which ended on 9 November 2020. The East Midlands also saw a slight decrease in footfall.
A full list of national restrictions is available from the Department of Health and Social Care for England, from the Scottish Government for Scotland, the Welsh Government for Wales and from nidirect for Northern Ireland.
Back to table of contents9. Roads and traffic camera data
Road traffic in Great Britain
The Department for Transport (DfT) produces daily road traffic estimates using data from around 275 automatic traffic count sites across Great Britain covering all road types, which are published weekly.
The daily DfT estimates are indexed to the first week of February 2020 and the comparison is with the same day of the week. The data provided are useful as an indication of traffic change rather than actual traffic volumes. More information on the methods, quality and economic analysis for these indicators can be found in the methodology article.
Figure 10: On Monday 23 November 2020, the volume of all motor vehicle traffic remained 22 percentage points below the levels seen on the first Monday of February 2020
Daily road traffic index: 100 = same traffic as the equivalent day of the week in the first week of February, 1 March 2020 to 23 November 2020, non-seasonally adjusted, Great Britain
Source: Department for Transport - road traffic statistics: management information
Notes:
- From Thursday 5 November until Wednesday 2 December, England has entered a period of national restrictions which, amongst other measures, has asked the public to stay at home.
Download this chart Figure 10: On Monday 23 November 2020, the volume of all motor vehicle traffic remained 22 percentage points below the levels seen on the first Monday of February 2020
Image .csv .xlsRoad traffic levels across the vehicle categories on Monday 23 November 2020 remained similar to the previous week. Road traffic across total motor vehicles was 22 percentage points lower than the first Monday in February 2020, the same level as the previous week.
Both light commercial vehicle traffic and heavy goods vehicle traffic increased by one percentage point when compared with the previous week; the car traffic level remained the same. However, other than heavy goods vehicles (HGVs), traffic levels in all categories remain substantially lower than before 5 November 2020, when national restrictions began in England.
Traffic camera activity
Traffic cameras are a valuable source for understanding the level of activity in towns and cities as well as changing patterns of mobility. The UK has thousands of publicly accessible traffic cameras with providers ranging from national agencies to local authorities.
Further information on the methodology used to produce these data is available in our methodology article and Data Science Campus blog.
In the accompanying dataset, the following categories are available as non-seasonally adjusted, seasonally adjusted and trend data:
cars
motorbikes (only available for London and the North East)
buses
trucks
vans
pedestrians and cyclists
The categories are available for the following regions, which give a broad coverage across the UK and represent a range of different-sized settlements in urban and rural settings:
Figure 11: In the week ending 22 November 2020, average counts of all traffic camera activity increased in London when compared with the previous week
Activity in selected areas, daily counts of cars, buses, pedestrians and cyclists, seasonally adjusted, March to November 2020, UK
Embed code
Notes:
The regions shown here were selected to be representative of the regions available.
Traffic camera images capture the appearance of buses, but they give no indication of the number of passengers using public transport.
Pre-March 2020 lockdown averages are calculated from when the series started, 11 March to 22 March 2020 for London.
Greater Manchester moved into Tier 3 "very high" coronavirus alert level on 23 October 2020. London moved into Tier 2 on 16 October 2020. Northern Ireland introduced a four week "circuit breaker" with additional restrictions on 16 October 2020.
From Thursday 5 November until Wednesday 2 December 2020, England has entered a period of national restrictions which, amongst other measures, has asked the public to stay at home.
In London, in the latest week (week ending 22 November 2020), average counts of all categories increased when compared with the previous week, although they remained lower than the counts pre-March 2020 lockdown. Cars were at 72% of their pre-March 2020 lockdown levels, trucks at 83%, and pedestrians and cyclists 73%.
In Greater Manchester, average counts of cars increased slightly when compared with the previous week, by 3%, but all other categories showed a very small decrease.
In Northern Ireland, average counts of cars and pedestrians and cyclists increased slightly but average counts of buses, trucks and vans all decreased slightly.
Back to table of contents10. Shipping
These shipping indicators are based on counts of all vessels, cargo and tanker vessels and passenger vessels. As discussed in Faster indicators of UK economic activity: shipping, we expect the shipping indicators to be related to the import and export of goods.
Figure 12: In the week ending 22 November 2020, the average number of daily ships visits in the UK decreased to 277 visits from 291 in the previous week
Daily movements in shipping visits, UK, seasonally adjusted, 1 January 2020 to 22 November 2020
Source: exactEarth
Download this chart Figure 12: In the week ending 22 November 2020, the average number of daily ships visits in the UK decreased to 277 visits from 291 in the previous week
Image .csv .xls
Figure 13: In the week ending 22 November 2020, the number of daily cargo ship visits in the UK remained stable at an average of 103 visits
Daily movements in shipping visits, UK, seasonally adjusted, 1 January to 22 November 2020
Source: exactEarth
Notes:
- The vertical lines indicate important events. In order, the events are: Storm Ciara; FCO advises against all non-essential international travel; March lockdown begins; UK international travel quarantine begins; travel corridors to 59 countries come into force; Storm Ellen; Storm Francis; Storm Alex; Storm Aiden.
- The number of visits for Hull are included in these data from 1 June onwards.
- The seasonally adjusted and trend estimates are estimated using a modified version of the seasonal adjustment method TRAMO-SEATS. More information is available in the Coronavirus and the latest indicators for the UK economy and society methodology.
- The seasonal adjustment method may be limited as this is a short time series.
- Daily and weekly shipping visits and unique visits are available by port in the dataset, along with non-seasonally adjusted aggregate series.
Download this chart Figure 13: In the week ending 22 November 2020, the number of daily cargo ship visits in the UK remained stable at an average of 103 visits
Image .csv .xls11. Data
Weekly and daily shipping indicators
Dataset | Released 26 November 2020
The weekly and daily shipping indicators dataset associated with the faster indicators of UK economic activity.
Online job advert estimates
Dataset | Released 26 November 2020
Experimental job advert indices covering the UK job market.
Traffic camera activity
Dataset | Released 26 November 2020
Experimental dataset for busyness indices covering the UK.
Online weekly price changes
Dataset | Released 26 November 2020
The online price changes for a selection of food and drink products from several large UK retailers. These data are experimental estimates developed to deliver timely indicators to help understand the impact of the coronavirus (COVID-19) pandemic.
12. Glossary
Company incorporations
Incorporations are when a company is added to the Companies House register of limited companies. This can also include where an existing business applies to become a limited company, where it was not one before.
Faster indicator
A faster indicator provides insights into economic activity using close-to-real-time big data, administrative data sources, rapid response surveys or Experimental Statistics, which represent useful economic and social concepts.
Voluntary dissolution applications
A voluntary dissolution application is when a company applies to begin dissolution proceedings. As such, they effectively chose to be removed from the Companies House register. For a company to be eligible to voluntarily dissolve, it should not have completed any trading activity for a period of three months.
Back to table of contents13. Measuring the data
Detailed information on the data sources, quality and methodology of the different indicators included in this bulletin is available in the Coronavirus and the latest indicators of the UK economy and society methodology.
We will summarise any crucial updates to the quality or methodology in this section in the future.
Back to table of contents14. Strengths and limitations
Detailed information on the strengths and limitations of the different indicators included in this bulletin is available in the Coronavirus and the latest indicators of the UK economy and society methodology.
We will summarise any crucial updates or warnings in this section in the future.
Back to table of contents
4. Social impacts of the coronavirus on Great Britain
This section includes some headline results from Wave 34 of the Opinions and Lifestyle Survey (OPN) covering the period 18 to 22 November 2020.
Travelling to work
In the week ending 22 November 2020, the proportion of adults in Great Britain who:
worked exclusively from home remained stable at 30%
travelled to work increased by five percentage points to 56%
neither travelled to work nor worked from home decreased by four percentage points to 14%
Shopping
The proportions of adults that shopped for food and medicine, and things other than food and medicine, have remained relatively stable, at 71% and 12% respectively. These levels could be attributed to recent national restrictions in England.
Face coverings
The proportion of adults who have used a face covering remained stable at 97%. Further breakdowns such as the situations when a face covering was worn (for example, while shopping) and by the Great Britain countries, will be available in Coronavirus and the social impacts on Great Britain published on 27 November 2020.
Figure 1: The proportion of adults shopping for things other than food and medicine remained low, at 12%
Proportion of adults, Great Britain, 14 May to 22 November 2020
Source: Office for National Statistics – Opinions and Lifestyle Survey
Notes:
Download this chart Figure 1: The proportion of adults shopping for things other than food and medicine remained low, at 12%
Image .csv .xls