Table of contents
- Main points
- Latest indicators at a glance
- OpenTable seated diner reservations
- Online job adverts
- Value Added Tax returns
- Business impacts and insights
- Roads and traffic camera data
- UK spending on debit and credit cards
- Retail footfall
- Shipping
- Social impact of the coronavirus
- Company incorporations and voluntary dissolution applications
- Weekly online food and drink basket
- Data
- Glossary
- Measuring the data
- Strengths and limitations
- Related links
1. Main points
Estimates for UK seated diner reservations on 12 April 2021 were at 79% of their level seen on the equivalent Monday of 2019. This is the first time the level has exceeded 2% since before the announcement of the latest lockdown in England on 4 January 2021 and coincides with the easing of hospitality restrictions in England on 12 April 2021 (OpenTable). See Section 3.
Total UK online job adverts on 9 April 2021 equalled their February 2020 average level to become the highest level seen since 6 March 2020; this was partly driven by a notable increase to the “catering and hospitality” category, which also reached its highest level since March 2020 (Adzuna). See Section 4.
There were 25,320 new VAT reporters in March 2021, the highest number of new reporters seen since August 2016 when there were 26,440 (Her Majesty’s Revenue and Customs (HMRC)). See Section 5.
In Quarter 1 (Jan to Mar) 2021, a net 1% of 287,880 firms reported an increase in turnover at the total industry level when compared with the previous quarter (Her Majesty’s Revenue and Customs (HMRC)). See Section 5.
Initial results from Wave 28 of the Business Insights and Conditions Survey (BICS) found that 36% of currently trading UK businesses reported a negative impact on their turnover compared with what is normally expected for this time of year, a decrease from 40% in Wave 27. See Section 6.
The volume of motor vehicle traffic on 12 April 2021 was at 91% of the level seen in the first week of February 2020; this is 7 percentage points higher than the level seen on 29 March 2021 and the highest level seen since November 2020 (Department for Transport (DfT)). See Section 7.
Traffic camera activity in London in the week ending 11 April 2021 remained above or around levels seen in the week before the first lockdown (Transport for London). See Section 7.
The aggregate CHAPS-based indicator of credit and debit card purchases decreased by 4 percentage points in the week to 8 April 2021 to 83% of its February 2020 average; this is in-part a fallback from the recent bank holiday weekend (Bank of England's CHAPS data). See Section 8.
Retail footfall was strongest in the West Midlands and the East of England in the week to 10 April 2021, each at 46% of their level in the equivalent week of 2019; retail footfall was weakest in Northern Ireland at 35% of its level in the equivalent week of 2019 (Springboard). See Section 9.
There was an average of 331 daily ship visits in the week ending 11 April 2021, a 7% decrease from 356 the previous week (exactEarth). See Section 10.
There were 17,881 company incorporations and 5,059 voluntary dissolution applications in the week to 9 April 2021, a 19% increase and 2% decrease from the previous week, respectively (Companies House). See Section 11.
The overall price of items in the online food and drink basket decreased by 0.1% in the week ending 11 April 2021 (Online price collection). See Section 12.
Results presented throughout this bulletin are experimental and may be subject to revision.
2. Latest indicators at a glance
Embed code
Download the data
Back to table of contents3. OpenTable seated diner reservations
OpenTable is a leading provider of online restaurant reservations, and these data are publicly available in their The state of the restaurant industry dashboard. These data show the impact of recent events and restrictions on the hospitality industry using a sample of restaurants on the OpenTable network across all channels: online reservations, phone reservations, and walk-ins.
On Monday 12 April 2021, estimates for UK seated diner reservations were at 79% of the level seen on the equivalent Monday of 2019, the first time their level has exceeded 2% since before the announcement of the latest lockdown in England on 4 January 2021. This coincides with the easing of lockdown restrictions in England on this day, allowing restaurants to open for outdoor dining. The equivalent figures for London and Manchester were 47% and 153%, respectively.
Back to table of contents4. Online job adverts
Job adverts by category
These figures use job adverts provided by Adzuna, an online job search engine, and include experimental estimates of online job adverts by Adzuna category and by UK country and International territorial level 1 (ITL1) region. The number of job adverts over time is an indicator of the demand for labour. The Adzuna categories used do not correspond to Standard Industrial Classification (SIC) categories, so these values are not directly comparable with the Office for National Statistics (ONS) Vacancy Survey.
Figure 1: On 9 April 2021, total UK online job adverts reached 100% of their February 2020 average level, the highest proportion seen since 6 March 2020
Index of job adverts on Adzuna by category, 100 = average job adverts in February 2020, 4 January 2019 to 9 April 2021, non-seasonally adjusted
Embed code
Notes:
- The observations were collected on a roughly weekly basis; however, before June 2020 they were not all observed at the same point in each week, leading to slightly irregular gaps between some observations.
- Data have not been seasonally adjusted. Job adverts observed in February 2020 are generally representative of their level throughout the year.
- These series have a small number of missing weeks in the data, the latest of which is in February 2021. Values for missing weeks have been imputed using linear interpolation. The data points that have been imputed are clearly marked in the accompanying dataset.
- February 2020 average job adverts were calculated using an arithmetic mean of the four recorded observations that month.
- Further category breakdowns are included in the Online job advert estimates dataset, and more details on the methodology can be found in Using Adzuna data to derive an indicator of weekly vacancies.
According to Adzuna, on 9 April 2021, total online job adverts reached 100% of their February 2020 average level, a 3 percentage point increase from 1 April 2021. This is the highest proportion of online job adverts observed since 6 March 2020, before the first national lockdown was imposed across the UK.
Excluding the “unknown” category, compared with 1 April 2021, the volume of online job adverts increased in 16 out of the 28 categories, fell in 11 and was unchanged in one. The largest increases since 1 April 2021 were in “legal” and “catering and hospitality”, which rose by 12 percentage points and 10 percentage points to 81% and 58% of their February 2020 average levels, respectively. This is the highest proportion of online job adverts for “catering and hospitality” seen since 20 March 2020, following its notable uptick in recent weeks. Another notable increase was recorded in “healthcare and social care”, rising by 8 percentage points. However, this increase was partly driven by a large number of new adverts from a single company.
The largest decrease since 1 April 2021 was in “travel and tourism”, which fell by 16 percentage points to 84% of its February 2020 average level on 9 April 2021. This substantial dip follows the gradual increase seen in this category over the last few months.
Job adverts by region
Figure 2: Total online job adverts in Scotland rose by 12 percentage points to 102% of their February 2020 average on 9 April 2021, the highest increase from 1 April seen across all UK countries and regions
Index of job adverts on Adzuna by region, 100 = average job adverts in February 2020, 4 January 2019 to 9 April 2021, non-seasonally adjusted
Embed code
Notes:
- There is a level shift in the Northern Ireland series from 17 October 2019 because of a large source of Northern Ireland job adverts being removed, and another level shift from 7 August 2020 because of a new source being included.
- Data have not been seasonally adjusted. Job adverts observed in February 2020 are generally representative of their level throughout the year.
- These series have a small number of missing weeks in the data, the latest of which is in February 2021. Values for missing weeks have been imputed using linear interpolation. The data points that have been imputed are clearly marked in the dataset.
- February 2020 average job adverts were calculated using an arithmetic mean of the four recorded observations that month.
According to Adzuna, on 9 April 2021, the volume of online job adverts had increased in 6 out of the 12 UK ITL1 regions, fallen in three and remained unchanged in three, when compared to 1 April 2021. The largest increase was recorded in Scotland, where the volume of online job adverts rose by 12 percentage points to 102% of their February 2020 average level, the highest proportion recorded for Scotland since 13 February 2020. The second largest increase was recorded in London, where online job adverts rose by 6 percentage points to 84% of their February 2020 average level, the highest proportion for London seen since 20 March 2020.
The largest decrease between the 1 April and 9 April 2021 was recorded in Northern Ireland, which fell by 22 percentage points.
Back to table of contents5. Value Added Tax returns
New reporters
The new reporters index measures the number of firms sending Value Added Tax (VAT) returns for the first time, which is related to the number of firm creations.
Figure 3: New VAT reporters in March 2021 increased from February 2021 levels to 25,320, the highest number of new reporters since August 2016
The number of new firm reporters, January 2015 to March 2021, non-seasonally adjusted, UK
Source: Her Majesty’s Revenue and Customs (HMRC)
Download this chart Figure 3: New VAT reporters in March 2021 increased from February 2021 levels to 25,320, the highest number of new reporters since August 2016
Image .csv .xlsIn March 2021, there were 25,320 new VAT reporters, a 26% increase from 20,160 in February 2021. This is also substantially higher than the March 2020 level of 17,840. The number of new VAT reporters in March 2021 was the highest number seen since August 2016 (26,440).
Business Turnover Estimates
Turnover diffusion indices are an aggregate measure used to track whether the majority of firms are reporting an increase or decrease in turnover in their VAT returns. They are calculated as the percentage of firms with increasing turnover minus the percentage with decreasing turnover.
The heatmap in Figure 4 is a visual way of showing the VAT diffusion indices based on the standard deviation from their historical 2008 to 2019 average. Larger deviations are more darkly coloured, with red representing a negative change, and teal a positive change, when compared with the previous period.
The monthly estimate of gross domestic product (GDP) for February 2020 was published on Tuesday 13 April 2021. March 2021 estimates of Retail sales in Great Britain will be published on Friday 23 April 2021. It is important to note that the timely VAT indicators are not attempting to forecast or predict GDP or other headline economic statistics, and the indicators should not be interpreted in this way.
Figure 4: In Quarter 1 (Jan to Mar) 2021, a net 1% of 287,880 firms reported an increase in turnover at the total industry level when compared with Quarter 4 (Oct to Dec) 2020
Heatmap of business turnover estimates, UK, diffusion index standard deviation from the mean, up to Quarter 1 (Jan to Mar) 2021 and February 2021. New reporters, UK, up to March 2021
Embed code
Notes:
- Agri - Agriculture, forestry and fishing, All - All industries, SA - Seasonally adjusted, NSA - Not seasonally adjusted.
- All industries are unweighted: each firm contributing to the index has the same weight regardless of turnover, size or industry.
- The thresholds for the colours in the heatmap are based on standard deviations from the mean of the indicator between 2008 and 2019.
- Note the monthly turnover estimates are based on a small sample of around 35,000 firms reporting their turnover, so are subject to volatility.
- The average firm contributions by industry for the monthly (M2) turnover estimates using SIC 2007 are dominated by agriculture, forestry and fishing (A), followed by wholesale and retail (G) and construction (F). More information is available in the methodology article.
Figure 4 shows that in Quarter 1 (Jan to Mar) 2021, compared with the previous quarter, the all-industry diffusion index was 0.6 standard deviations (light green) above its historical average from 2008 to 2019 with a diffusion index of 0.01. This means that in Quarter 1 2021, a net 1% of 287,880 firms reported an increase in turnover from Quarter 4 (Oct to Dec) 2020.
Across all major industries (services, production, construction, and agriculture), turnover estimates were mixed. Production saw a turnover of negative 0.1 standard deviations below the 2008 to 2019 historical average, whilst agriculture had a turnover estimate of 0.0 standard deviations above the historical average (white). Both of these industries had a diffusion index of 0.00. Both services and construction were seeing increasing turnover, at 1.0 and 0.7 standard deviations above their historical averages (light green).
However, the all-industry index for Quarter 1 2021, compared with Quarter 1 2020 was 2.3 standard deviations below its historical average (light red). This indicates that far more firms across all major industries are seeing decreasing turnover than increasing turnover compared with Quarter 1 2020.
The month-on-year ago all-industry turnover estimate for February 2021 remains negative, at 0.8 standard deviations below the historical average (pink), at a diffusion index of negative 0.02. This implies that, in February 2021, a net 2% of 36,240 firms reported a fall in turnover when compared with February 2020.
Across all major industries, indices were negative. Services saw the lowest index at 1.4 standard deviations below its historical average and a diffusion index of negative 0.05. Production saw a turnover of 1.3 standard deviations below its historical average (pink). Both construction and agriculture each saw slightly decreasing turnover at 0.5 and 0.1 standard deviations below their historical averages, respectively.
Figure 4 also shows that the month-on-month industry diffusion index for February 2021 compared with January 2021 was positive at 1.9 standard deviations above the 2008 to 2019 historical average (teal), with a diffusion index of 0.06. This means that out of 38,180 firms who reported their turnover during this period, a net 6% reported increasing turnover. All major industries also reported month-on-month increasing turnover. The services industry reported the largest turnover of 3.1 standard deviations above the historical average (teal), with a diffusion index of 0.11. Production also saw a positive diffusion index, at 2.4 standard deviations (teal), whilst construction and agriculture each saw slightly higher turnover at 0.7 and 0.4 standard deviations above their historical averages, respectively.
The monthly and quarterly diffusion indices can exhibit different trends, as only a subset of firms contribute towards the monthly diffusion indices. Quarterly returns are allocated to the calendar quarter in which two or more of the months lie. For example, a quarterly return covering the period December 2020 to February 2021 will be allocated to Quarter 1 (Jan to Mar) 2021. At this stage of the quarterly data cycle, there is limited information about March 2021 feeding into the Quarter 1 2021 estimates.
For more information on how the quarterly reporting periods are derived, see VAT reporting periods in Section 2 of the VAT methodology article. The number of firms contributing towards each of the diffusion indices is published in the dataset.
Back to table of contents6. Business impacts and insights
Initial results from Wave 28 of the Business Insights and Conditions Survey (BICS) cover the reference period 22 March to 4 April 2021, with a response rate of 21.2% (8,265 responses). The survey was live for the period 6 to 13 April 2021.
These dates should be kept in mind in relation to local and national restrictions in place during the reference period and the date when the business responded.
For experimental single site weighted regional estimates that have been updated up to Wave 26 (22 February to 21 March 2021), please see Understanding the business impacts of local and national restrictions: March 2021.
Figure 5: 76% of businesses were currently trading in Wave 28, similar to the previous wave but lower than 84% in mid-December 2020
Headline indicators from the Business Insights and Conditions Survey (BICS), 22 March to 13 April 2021
Embed code
Notes:
- Initial weighted results, Wave 28 of Office for National Statistics' (ONS') Business Insights and Conditions Survey (BICS).
- A detailed description of the weighting methodology and the weights used for each variable is available in Business Insights and Conditions Survey (BICS): preliminary weighted results.
- Businesses were asked for their experiences for the reference period 22 March to 4 April 2021. However, for questions regarding the last two weeks, businesses may respond from the point of completion of the questionnaire (6 to 13 April 2021).
Download the data
The initial result of 17% of businesses' workforce on furlough leave at the end of March 2021 equates to approximately 5.7 million people. These numbers are based on multiplying the BICS-weighted furlough proportions by the Inter-Departmental Business Register (IDBR) total annual employment. This will not be consistent with employment estimates from Labour market statistics as these are based on different sources over different time periods, but provides an indication of the use of furlough.
Additionally, the BICS proportion furloughed figure does not include the public sector, financial sector and parts of agriculture.
Across all UK industries in Wave 28:
- 73% of businesses had been trading for more than the last two weeks (broadly unchanged from Wave 27)
- 3% of businesses had started trading within the last two weeks after a pause in trading (an increase from 2% in Wave 27)
- 10% of businesses had paused trading but intend to restart in the next two weeks (an increase from 5% in Wave 27); this increase coincides with the re-opening of retail and hospitality in England from 12 April 2021
- 11% of businesses had paused trading and do not intend to restart in the next two weeks (a decrease from 18% in Wave 27)
- 4% of businesses had permanently ceased trading (an increase from 3% in Wave 27)
| All Industries | |
|---|---|
| Turnover has increased by more than 50% | 1% |
| Turnover has increased between 20% and 50% | 3% |
| Turnover has increased by up to 20% | 8% |
| Turnover has not been affected | 43% |
| Turnover has decreased by up to 20% | 15% |
| Turnover has decreased between 20% and 50% | 11% |
| Turnover has decreased by more than 50% | 10% |
| Not sure | 9% |
Download this table Table 1: Fewer trading UK businesses reported a negative impact on their turnover compared with Wave 27
.xls .csv7. Roads and traffic camera data
Road traffic in Great Britain
According to DfT non-seasonally adjusted road traffic data, the volume of all motor vehicle traffic on 12 April 2021 saw an increase of seven percentage points compared with 29 March to 91% of the level seen in the first week in February 2020. This is a continuation of the recent upward trend and coincides with the further easing of England restrictions, which came into effect on 12 April 2021. Week-on-two-week comparisons are made this week to avoid comparing against the lower level of motor vehicle traffic seen in the previous week because of the Easter Bank Holiday.
Compared with two weeks ago, car traffic increased by eight percentage points to 86% of the level seen on the same day of the first week in February 2020, and light commercial vehicle traffic increased by six percentage points to 105%. However, heavy good vehicles (HGVs) saw a decrease of two percentage points to 106% of the level seen on the same day of the first week in February 2020.
Figure 6: The volume of motor vehicle traffic on Monday 12 April was 91% of the level seen in the first week of February 2020, its highest level since November 2020
Daily road traffic index: 100 = same traffic as the equivalent day of the week in the first week of February 2020, 1 March 2020 to 12 April 2021, non-seasonally adjusted
Source: Department for Transport – Road traffic statistics: management information
Notes:
- The vertical lines indicate key events. In order, these events are: First National lockdowns imposed; Good Friday; Easter Monday; Bank holiday; Bank holiday; National restrictions begin in England; Christmas Day; Boxing Day; New Year's Day; Lockdowns announced in England and Scotland; 'stay at home' rule ends in England; Good Friday; Easter Monday
- From Monday 12 April, the government has announced an easing of restrictions in England which, amongst other measures, allows outdoor meetups and outdoor sports to resume.
- For full details on the dates when countries/regions entered their respective tiers and restrictions refer to Section 14: UK regional lockdown restrictions.
Download this chart Figure 6: The volume of motor vehicle traffic on Monday 12 April was 91% of the level seen in the first week of February 2020, its highest level since November 2020
Image .csv .xlsThe daily DfT estimates are indexed to the first week of February 2020 and the comparison is with the same day of the week. The data provided are useful as an indication of traffic change rather than actual traffic volumes. More information on the methods, quality and economic analysis for these indicators can be found in the DfT methodology article.
Traffic camera activity
Traffic cameras are a valuable source for understanding the level of activity in towns and cities as well as changing patterns of mobility. The UK has thousands of publicly accessible traffic cameras with providers ranging from national agencies to local authorities. Further information on the methodology used to produce these data is available in our methodology article and Data Science Campus blog.
In the accompanying dataset, the following categories are available as non-seasonally adjusted, seasonally adjusted and trend data:
- cars
- motorbikes (only available for London and the North East)
- buses
- trucks
- vans
- pedestrians and cyclists
The categories are available for the following regions, which give a broad coverage across the UK and represent a range of different-sized settlements in urban and rural settings:
Figure 7: Traffic camera activity in London in the week ending 11 April 2021 remained above or around levels seen in the week before the first lockdown
Traffic camera activity in selected areas, daily counts of cars, buses, pedestrians and cyclists, UK, seasonally adjusted, March 2020 to April 2021
Embed code
Notes
- The three regions shown here were selected to be representative of the six regions available.
- Traffic camera images capture the appearance of buses, but they give no indication of the number of passengers using public transport.
- Northern Ireland had a high level of imputation on 11 April 2021 because of a number of faulty cameras.
In the week ending 11 April 2021, average levels of traffic camera activity in London remained above or around those seen in the week before the first lockdown (week ending 22 March 2020):
- cars saw a weekly decrease of 2% to 109% of the average level in the week before the first lockdown
- buses decreased by 1% to 95%
- trucks increased by 1% to 95%
- vans increased by 4% to 104%
- pedestrians and cyclists decreased by 3% to 113%
Traffic camera activity in the North East remained stable or fell in the week to 11 April 2021:
- cars saw a weekly decrease of 3% to 93% of the average level in the week before the first lockdown
- buses saw no change at 98%
- trucks saw no change at 88%
- vans decreased by 2% to 87%
- pedestrians and cyclists decreased by 10% to 78%
The same comparisons cannot be made for Northern Ireland as data are not available for the week before the first lockdown. Northern Ireland saw fairly substantial weekly decreases in most categories, although caution should be taken when interpreting weekly changes for Northern Ireland because of the relatively low numbers of counts across all categories.
Back to table of contents8. UK spending on debit and credit cards
These data series are experimental faster indicators for estimating UK spending on credit and debit cards. They track the daily Clearing House Automated Payment System (CHAPS) payments made by credit and debit card payment processors to around 100 major UK retail corporates. These payments are the proceeds of recent credit and debit card transactions made by customers at their stores, both via physical and via online platforms. More information on the indicator is provided in the accompanying methodology article.
Companies are allocated to one of four categories based on their primary business:
- "staples" refers to companies that sell essential goods that households need to purchase, such as food and utilities
- "work-related" refers to companies providing public transport or selling petrol
- "delayable" refers to companies selling goods whose purchase could be delayed, such as clothing or furnishings
- "social" refers to spending on travel and eating out
Figure 8: In the week to 8 April 2021, the CHAPS-based indicator of credit and debit card purchases in aggregate fell by 4 percentage points from the previous week, to 83% of its February 2020 average
Index February 2020 = 100, a backward looking seven-day rolling average,13 January 2020 to 8 April 2021, non-seasonally adjusted, nominal prices
Source: Office for National Statistics and Bank of England calculations
Notes:
- Users should note the daily payment data is the sum of card transactions processed up to the previous working day, so there is slight time lag when compared with real-life events on the chart.
- The vertical lines indicate key events. In order, the events are: PM COVID-19 announcement; lockdown begins; some non-essential shops allowed to reopen; local COVID-19 alert levels; national restrictions begin in England; Christmas Eve; lockdown begins in England and Scotland; 'stay at home' rule ends in England.
- Percentage point difference is derived from current week and previous week index before rounding.
Download this chart Figure 8: In the week to 8 April 2021, the CHAPS-based indicator of credit and debit card purchases in aggregate fell by 4 percentage points from the previous week, to 83% of its February 2020 average
Image .csv .xlsFigure 8 shows changes in the value of CHAPS payments received by large UK corporates from their credit and debit card processors, "merchant acquirers".
In the week to 8 April 2021, the CHAPS-based indicator of credit and debit card purchases in aggregate decreased by 4 percentage points from the previous week to 83% of its February 2020 average. This was driven by decreases across “delayable” and “staples” consumption categories by 5 and 10 percentage points respectively. “Social” and “work-related” consumption categories each rose by 1 percentage point. Some of the decline is likely because of a partial fall back from advance spending on food, drink and delayable purchases, as well as advance payment of bills, following the Easter break (similar to, though less extreme than, Christmas). However, spending on “staples” normally reduces around this stage of the month as well, after an earlier peak around the turn of the month. In the latest week, despite its 10 percentage point decline, card spending on “staples” was still at 116% of its February 2020 average level. On the other hand, “delayable”, “social” and “work-related” purchases were 63%, 72% and 85% of their average levels in February 2020, respectively.
Despite this week’s slight fall, all four categories of the CHAPS-based indicator of debit and credit card purchases have gradually increased since the substantial fall in spending at the beginning of 2021 that followed the Christmas period and introduction of national lockdowns across the UK, and remain above the lowest levels observed during the spring 2020 lockdown.
The full data time series available for data on UK spending on debit and credit cards can be found in the accompanying dataset.
Back to table of contents9. Retail footfall
National retail footfall
National footfall figures are supplied by Springboard, a provider of data on customer activity. They measure the following for overall UK retail footfall, as well as by high street, retail park, and shopping centre categories:
- daily retail footfall as a percentage of its level on the same day of the equivalent week of 2019; for example, Saturday 10 April 2021 is compared with Saturday 6 April 2019
- total weekly retail footfall as a percentage of its level in the equivalent week of 2019; for example, footfall in Week 14 of 2021 is compared with its level in Week 14 of 2019
- the percentage change in weekly footfall compared with the previous week; for example, Week 14 of 2021 is compared with Week 13 of 2021
- Springboard's weekly data are defined over a seven-day period running from Sunday to Saturday; Week 12 of 2021 therefore refers to the period Sunday 4 April 2021 to Saturday 10 April 2021
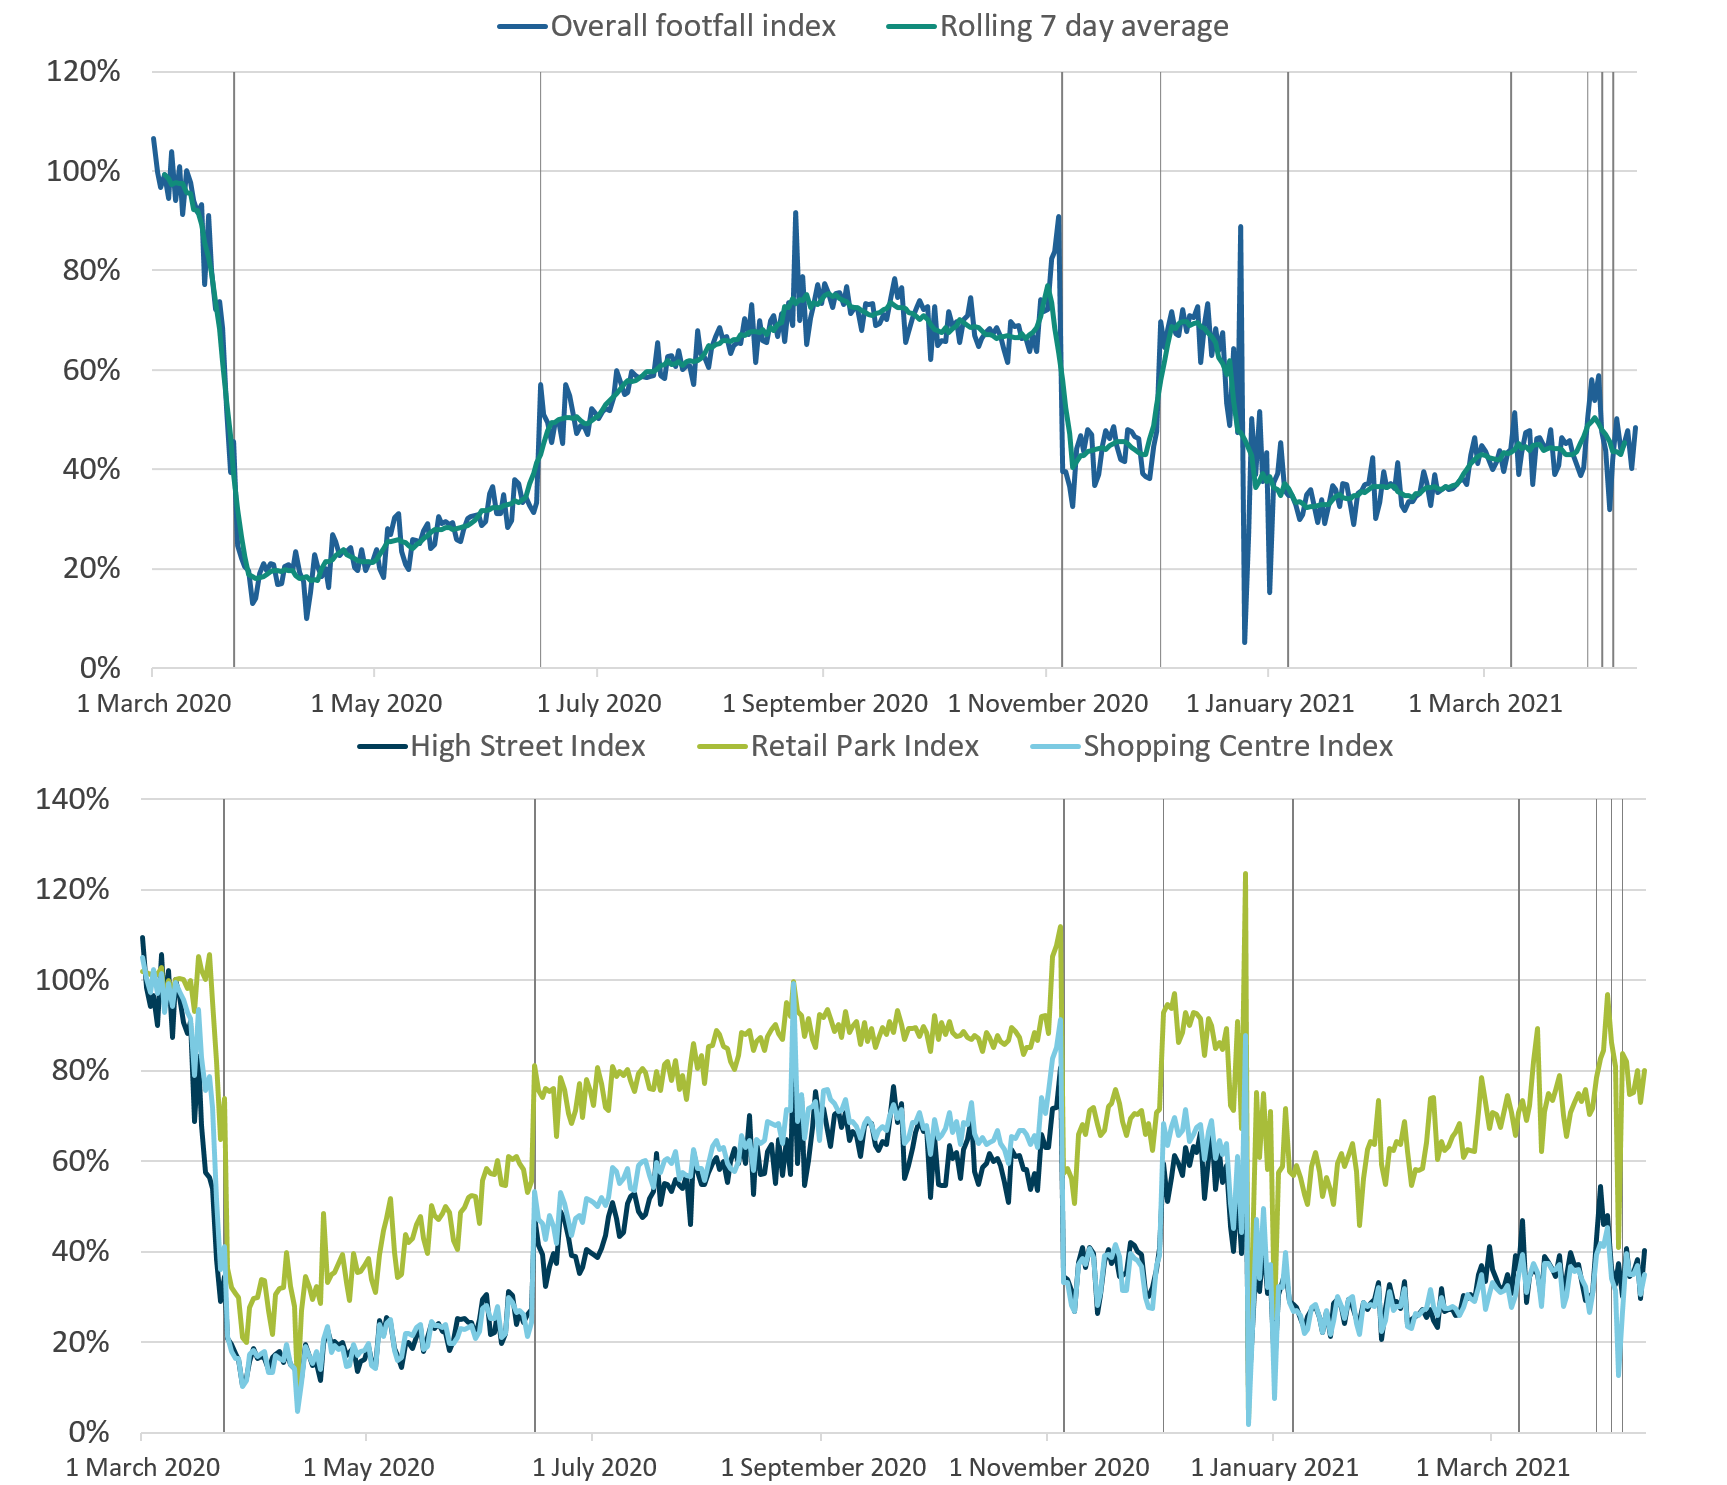
Figure 9: In the week to 10 April 2021, overall retail footfall in the UK was at 44% of its level in the equivalent week of 2019, a decrease of 7 percentage points from the previous week
Volume of retail footfall, percentage compared with the equivalent day of the equivalent week of 2019, 1 March 2020 to 10 April 2021
Source: Springboard and the Department for Business, Energy & Industrial Strategy
Notes:
- The vertical lines indicate key events. In order, the events are: first National lockdowns imposed; lockdown restrictions begin to ease across the UK; circuit-breaker lockdown in England; regional restrictions begin in England; national lockdown begins in England; Good Friday 2021; Easter Monday 2021.
- The spike on Monday 24 August 2020 was caused by the comparison with 26 August 2019, which was bank holiday Monday with good weather. The bank holiday this year was a week later, on 31 August 2020.
- The spikes on 23 December and 30 December 2020 are because of the year-on-year comparison with 25 December 2019 and 1 January 2020 respectively, which were bank holidays.
- Prior to 3 January 2021 daily indices were generated by comparing footfall against its level on the same day of the equivalent week the year before. From this date onwards they were generated by comparing footfall against its level on the same day of the equivalent week in 2019. For a two-day period, from 1 January 2021 to 2 January 2021 daily indices were therefore generated using a 2021 vs. 2020 comparison.
Download this image Figure 9: In the week to 10 April 2021, overall retail footfall in the UK was at 44% of its level in the equivalent week of 2019, a decrease of 7 percentage points from the previous week
.png (265.4 kB)
According to Springboard, in the week to 10 April 2021, overall retail footfall in the UK fell by 7 percentage points from the previous week to 44% of the level seen in the equivalent week of 2019. This decrease from the week to 3 April 2021 coincides with that being a bank holiday weekend, and otherwise continues the gradual uptick seen in the retail footfall index since the start of the year, after the new year dip.
Consistent with the trend observed since the beginning of the year, in the week to 10 April 2020, footfall at retail parks remained substantially higher than that at high streets and shopping centres, standing at 74% of its level in the equivalent week of 2019. The corresponding figures for high streets and shopping centres were 35% and 32%, respectively.
All retail locations saw week-on-week decreases in footfall, with high streets and shopping centres decreasing by 10%, whilst footfall in retail parks fell by 9% between the weeks ending 3 April and 10 April 2021. Users should note that week-on-week changes in footfall are presented as percentages rather than percentage points because the figures represent differences in the level of footfall between periods, rather than movements in an index.
Figure 10: In the week to 10 April 2021, retail footfall was strongest in the West Midlands and the East of England at 46% of their level in the equivalent week of 2019
Volume of overall daily retail footfall, percentage of the level recorded on the same day of the equivalent week of 2019, UK regions, 1 March 2020 to 10 April 2021

Source: Springboard and the Department for Business, Energy & Industrial Strategy
Notes:
- Prior to 3 January 2021 daily indices were generated by comparing footfall against its level on the same day of the equivalent week the year before. From this date onwards they were generated by comparing footfall against its level on the same day of the equivalent week in 2019. For a two-day period, from 1 January 2021 to 2 January 2021 daily indices were therefore generated using a 2021 vs. 2020 comparison.
Download this image Figure 10: In the week to 10 April 2021, retail footfall was strongest in the West Midlands and the East of England at 46% of their level in the equivalent week of 2019
.png (195.1 kB)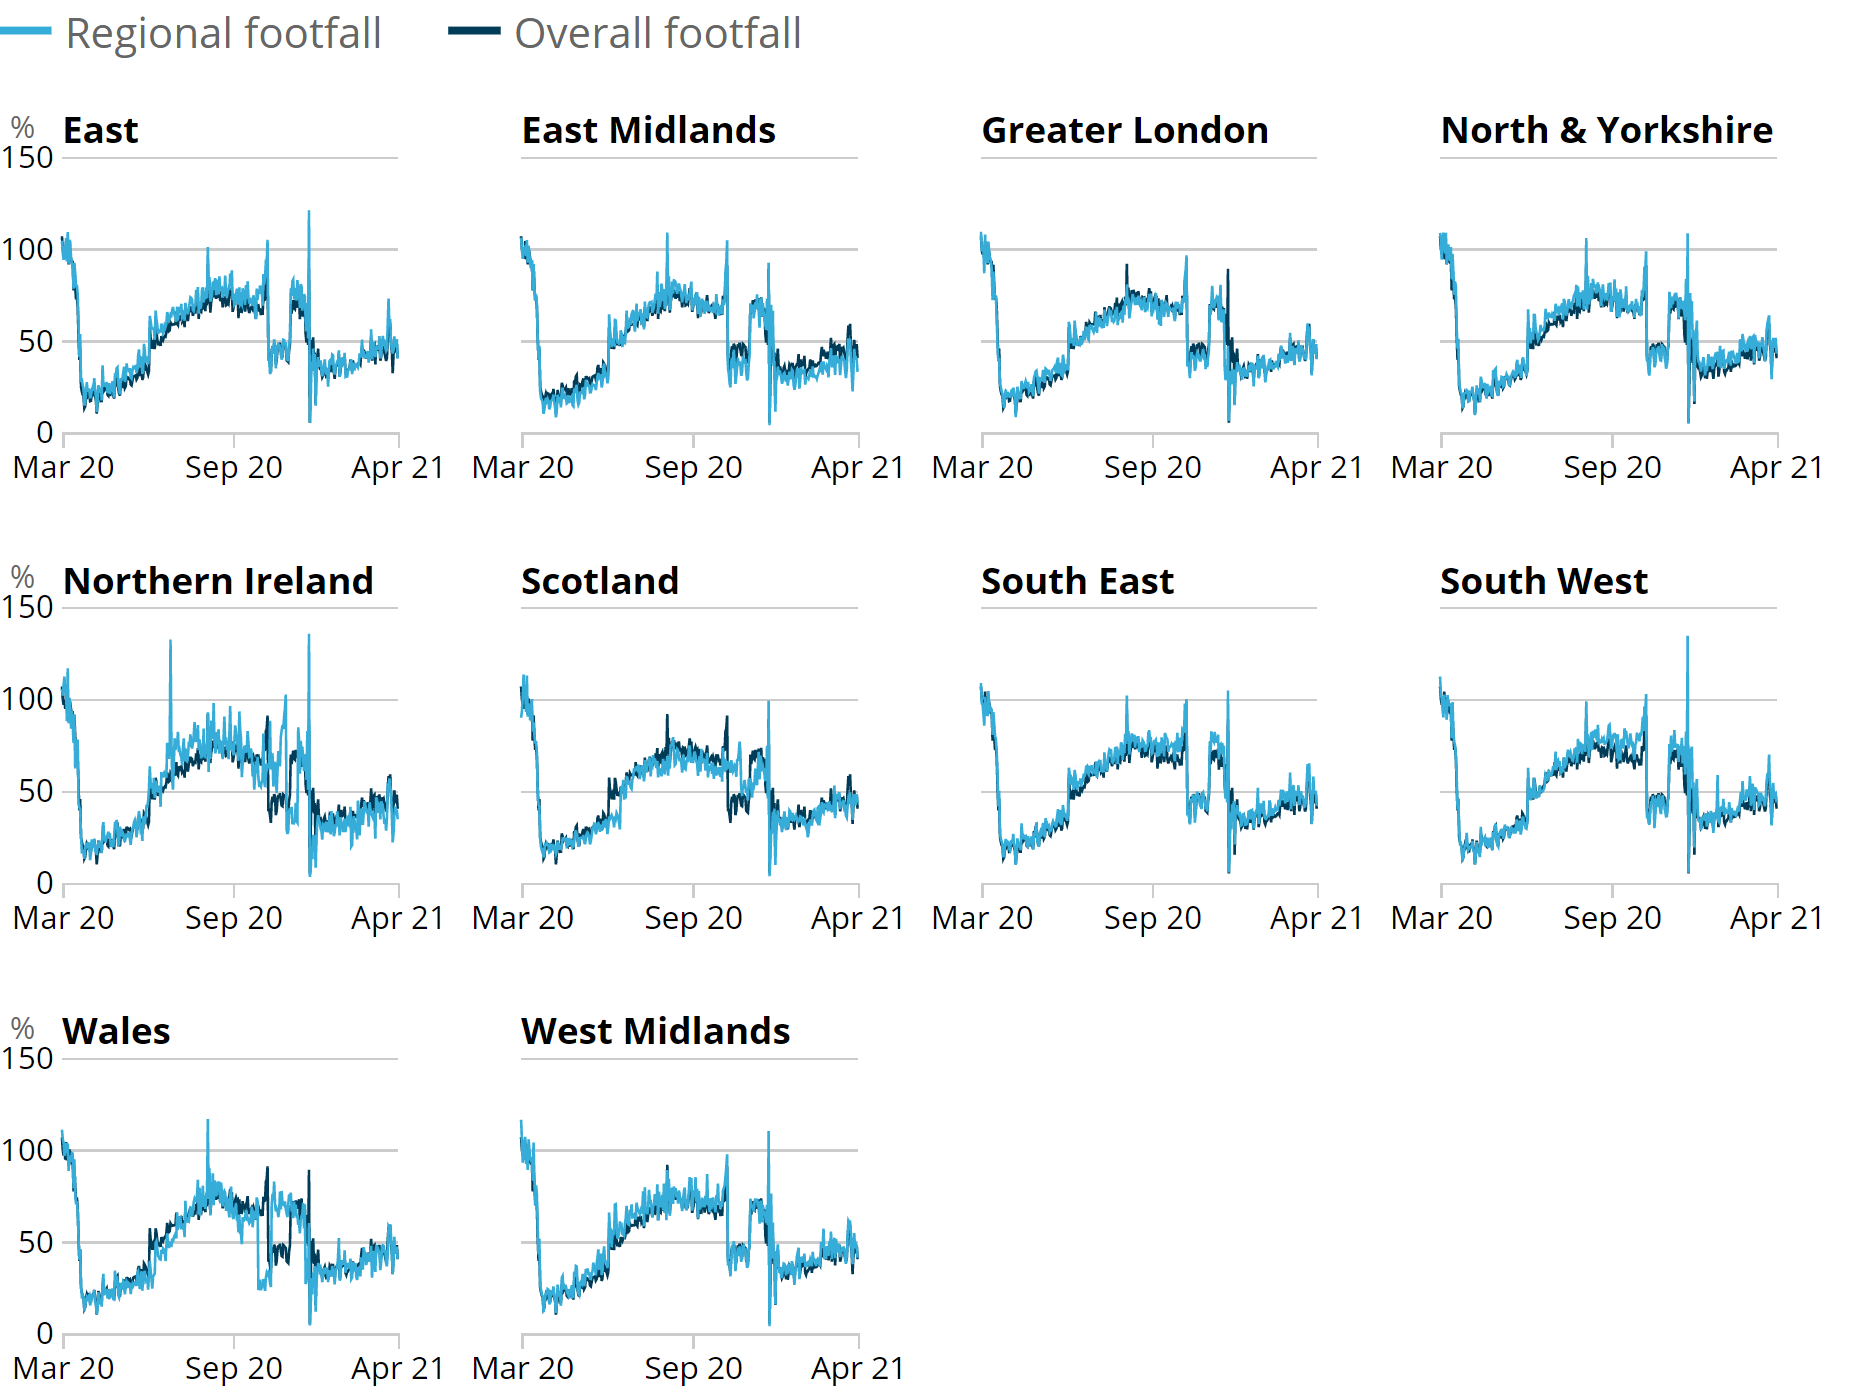
According to Springboard, in the week to 10 April 2021, retail footfall was strongest in the West Midlands and the East of England at 46% of the level seen in both regions in the equivalent week of 2019. Retail footfall in Scotland was similar to the levels seen in Wales, with corresponding figures of 44% and 43%, respectively.
In the same period, retail footfall was weakest in Northern Ireland at 35% of its level in the equivalent week of 2019. However, across all UK regions, retail footfall remains substantially below its level in the equivalent week of 2019.
All countries and regions of the UK saw decreases in retail footfall between the weeks ending 3 April 2021 and 10 April 2021 except Scotland, where it increased by 5%. The largest week-on-week decrease was in Northern Ireland, where it fell by 20%.
Back to table of contents10. Shipping
These shipping indicators are based on counts of all vessels, and cargo and tanker vessels. As discussed in Faster indicators of UK economic activity: shipping, we expect the shipping indicators to be related to the import and export of goods.
The coronavirus (COVID-19) pandemic first began to affect the level of shipping visits from the week ending 29 March 2020. For this reason, users should interpret comparisons of ship visits with the same period last year with caution.
We are closely monitoring exactEarth data for any notable effects on UK shipping activity as a result of the Suez canal blockage, which took place between 23 and 29 March 2021. However, we will be unable to delineate the exact effects of the blockage from any other contributing factors to changes in activity.
Figure 11: There was an average of 331 daily ship visits in the week ending 11 April 2021, a fall from 356 in the previous week and similar to the corresponding week in 2019 (328)
Daily movements in shipping visits, UK, seasonally adjusted, 1 December 2019 to 11 April 2021
Source: exactEarth
Download this chart Figure 11: There was an average of 331 daily ship visits in the week ending 11 April 2021, a fall from 356 in the previous week and similar to the corresponding week in 2019 (328)
Image .csv .xlsThere was an average of 331 daily ship visits in the week ending 11 April 2021, a 7% decrease from 356 in the previous week. The largest average fall was in Portsmouth, with nine fewer ship visits than the previous week. Most ports saw a small decrease in the average number of visits over the week.
Figure 12: In the week ending 11 April 2021, the average number of daily cargo and tanker ship visits was broadly unchanged from the previous week at 99 visits
Daily movements in cargo and tanker shipping visits, UK, seasonally adjusted, 1 December 2019 to 11 April 2021
Source: exactEarth
Notes:
- The vertical lines indicate key events. In order, the events are: storm Ciara; FCO advises against all non-essential international travel; lockdown begins; UK international travel quarantine begins; travel corridors to 59 countries come into force; storm Ellen; storm Francis, storm Alex; storm Aiden; storm Darcy.
- The number of visits for Hull are included in these data from 1 June 2020 onwards.
- The seasonally adjusted estimates are produced using a modified version of the seasonal adjustment method TRAMO-SEATS. This method may be limited as this is a short time series. More information is available in the Coronavirus and the latest indicators for the UK economy and society methodology.
- Daily and weekly shipping visits and unique visits are available by port in the dataset, along with non-seasonally adjusted aggregate series.
- The trend is now calculated as a rolling seven-day average of the number of daily ship and cargo ship visits. The presentation of the series has been shifted three days forward, this does not affect the calculation of the average.
- Users should note that a reduction in shipping activity has been observed over the Christmas periods in 2019 and 2020.
Download this chart Figure 12: In the week ending 11 April 2021, the average number of daily cargo and tanker ship visits was broadly unchanged from the previous week at 99 visits
Image .csv .xlsThere was an average of 99 daily cargo and tanker ship visits in the week ending 11 April, broadly unchanged from 102 in the previous week. This is a similar level to that seen in the corresponding week in 2019 when there was an average of 101 visits, but lower than that in 2020 when there was an average of 114 visits, although care should be taken with comparisons with 2020 as noted above.
Back to table of contents12. Company incorporations and voluntary dissolution applications
Incorporations
According to Companies House, in the week to Friday 9 April 2021, there were 17,881 company incorporations in the UK, a 19% increase from the previous week. This large increase may in part be due to the processing of incorporations that couldn’t be processed on Good Friday. The number of company incorporations remains above the level seen in the equivalent week of 2019 when there were 15,134.
Figure 13: In the week to 9 April 2021, there were 17,881 company incorporations, a 19% increase from the previous week
Total weekly company incorporations, UK, from week ending Friday 4 January 2019 to week ending Friday 9 April 2021
Source: Companies House and Office for National Statistics
Notes:
- Week 1 refers to the period week ending 4 January 2019, 3 January 2020 and 1 January 2021. Week 15 refers to the period week ending 12 April 2019, 10 April 2020 and 9 April 2021.
- The dips in December 2019 and December 2020 are explained by two bank holidays in the week ending 27 December 2019 and 25 December 2020.
- Weekly data are for week commencing Saturday to Friday, as incorporation requests received on Saturdays and Sundays are typically processed on subsequent weekdays. For more information, see the accompanying Companies House methodology page.
- The higher levels of company incorporations recorded in the week ending 5 March 2021 (Week 10) were because of a backlog of applications being processed following an administrative delay in previous weeks.
Download this chart Figure 13: In the week to 9 April 2021, there were 17,881 company incorporations, a 19% increase from the previous week
Image .csv .xlsVoluntary dissolution applications
In the week to Friday 9 April 2021, there were 5,059 voluntary dissolution applications in the UK, a 2% decrease from 5,170 dissolution applications in the previous week. This is broadly similar to the number seen in the equivalent week of 2019 when there were 5,057 voluntary dissolution applications.
Users should note that the figure for voluntary dissolutions for the week to Friday 2 April published in last week’s bulletin and dataset (8 April) was incorrect. This was previously stated to be 4,957 and has now been corrected to 5,170. No other estimates were impacted. We apologise for any inconvenience caused.
Figure 14: In the week to 9 April 2021, there were 5,059 voluntary dissolution applications, similar to the number seen in the equivalent week of 2019 (5,057)
Total weekly company voluntary dissolution applications, UK, from week ending Friday 4 January 2019 to week ending Friday April 9 2021
Source: Companies House and Office for National Statistics
Notes:
- Week 1 refers to the period week ending 4 January 2019, 3 January 2020 and 1 January 2021. Week 15 refers to the period week ending 12 April 2019, 10 April 2020 and 9 April 2021.
- The dips in December 2019 and December 2020 are explained by two bank holidays in the week ending 27 December 2019 and 25 December 2020.
- Weekly data are for week commencing Saturday to Friday, as voluntary dissolution requests received on Saturdays and Sundays are typically processed on subsequent weekdays. For more information, see the accompanying Companies House methodology page.
- Increased Companies House operational activity during week ending 8 November 2019 caused a spike in total weekly company voluntary dissolution applications. This data point should be treated with caution.
- The higher levels of voluntary dissolution applications recorded in the recent weeks up to week ending 5 March 2021 (Week 10) were because of a backlog of applications being processed following an administrative delay in previous weeks.
Download this chart Figure 14: In the week to 9 April 2021, there were 5,059 voluntary dissolution applications, similar to the number seen in the equivalent week of 2019 (5,057)
Image .csv .xlsThe full data time series available for weekly company incorporations and voluntary dissolution applications can be found in the accompanying dataset.
Back to table of contents13. Weekly online food and drink basket
A timely indication of weekly online price change for a selection of food and drink products from several large UK retailers has been developed, covering the period 1 June 2020 to 11 April 2021. Details of the methodology used for these indicators can be found in Online price changes methodology. This analysis is experimental and should not be compared with our regular monthly consumer price statistics.
The data time series, weekly growth rates, and contributions to the weekly change for all individual food and drink items, along with sample sizes, are published in a dataset alongside this release.
The overall price of items in the online food and drink basket decreased by 0.1% between the week ending 11 April 2021 and the previous week, with five categories providing negative contributions to the overall price movement, seven providing positive contributions and two making negligible contributions to the overall movement.
Figure 15: The overall price of items in the online food and drink basket decreased by 0.1% in the latest week
Percentage point contributions to online price changes for food and drink, UK, between the week ending 4 April 2021 and the week ending 11 April 2021
Source: Office for National Statistics - Online price collection
Notes:
- Contributions may not always sum to the weekly change, as a result of rounding.
Download this chart Figure 15: The overall price of items in the online food and drink basket decreased by 0.1% in the latest week
Image .csv .xlsThe main downward contributor to the overall price movement in the latest week was “sugar, jam, syrup, chocolate and confectionery”, where prices fell by 1.9%, which contributed negative 0.17 percentage points to the overall price movement. This was almost entirely driven by chocolate, which experienced a 3.1% price fall in the latest week.
The largest offsetting contribution came from “meat”, which experienced a 0.4% price rise and contributed positive 0.05 percentage points to the overall price movement. The single largest contribution to this price rise came from “lamb and goat”, which saw prices rise by 2.6% in the latest week.
Back to table of contents14. Data
UK spending on credit and debit cards
Dataset | Released 15 April 2021
These data series are experimental faster indicators for monitoring UK retail purchases derived from the Bank of England's Clearing House Automated Payment System (CHAPS) data.
Weekly and daily shipping indicators
Dataset | Released 15 April 2021
The weekly and daily shipping indicators dataset associated with the faster indicators of UK economic activity.
Traffic camera activity
Dataset | Released 15 April 2021
Experimental dataset for business indices covering the UK
Online job advert estimates
Dataset | Released 15 April 2021
Experimental job advert indices covering the UK job market.
Company Incorporations and Voluntary Dissolutions
Dataset | Released 15 April 2021
Weekly dataset showing the number of Companies House Incorporations and Voluntary Dissolution applications accepted.
Value Added Tax
Dataset | Released 15 April 2021
Value Added Tax (VAT) turnover and expenditure diffusion indexes and new VAT reporters using data from HM Revenue and Customs (HMRC) VAT returns.
Online weekly price changes
Dataset | Released 15 April 2021
The online price changes for a selection of food and drink products from several large UK retailers. These data are experimental estimates developed to deliver timely indicators to shed light on changes in prices at online retailers faced by consumers.
15. Glossary
Faster indicator
A faster indicator provides insights into economic activity using close-to-real-time big data, administrative data sources, rapid response surveys or Experimental Statistics, which represent useful economic and social concepts.
Company incorporations
Incorporations are when a company is added to the Companies House register of limited companies. This can also include where an existing business applies to become a limited company, where it was not one before.
Voluntary dissolution applications
A voluntary dissolution application is when a company applies to begin dissolution proceedings. As such, they effectively chose to be removed from the Companies House register. For a company to be eligible to voluntarily dissolve, it should not have completed any trading activity for a period of three months.
Diffusion index
The diffusion index tracks the growth in turnover and expenditure of firms. It is constructed to lie between negative 1 and 1. For example, if 65% of firms have increasing turnover, 30% have decreasing turnover and 5% turnover remains unchanged, then the diffusion index is 0.35.
New reporter
A new reporter is defined as a firm with a Value Added Tax (VAT) reference (that is, firm identification number) which has not previously reported its VAT returns. New reporters are published within one month of the end of the reporting period. The new reporting behaviour measure is classified by the month the data were received by HM Revenue and Customs (HMRC), known as the receipt date, which is not necessarily the same as the reference period (the period for which the VAT return is made).
Back to table of contents16. Measuring the data
End of EU Exit Transition period
As the UK enters into a new Trade and Cooperation Agreement with the EU, the UK statistical system will continue to produce and publish our wide range of economic and social statistics and analysis. We are committed to continued alignment with the highest international statistical standards, enabling comparability both over time and internationally, and ensuring the general public, statistical users and decision makers have the data they need to be informed.
UK Regional Lockdown Restrictions
The following is a summary of coronavirus (COVID-19) restrictions in each of the four UK constituent countries from Monday 29 March 2021 to Monday 12 April 2021.
A full list of national restrictions is available for England from gov.uk, for Scotland from the Scottish Government, for Wales the Welsh Government and for Northern Ireland from nidirect.
Restrictions as of Monday 12 April 2021
Scotland
- All of mainland Scotland is under Level 4 lockdown restrictions. Orkney, the Shetland Islands and the Western Isles (except Skye) are under Level 3 restrictions.
- However, in Level 4 areas since 12 March 2021 four people from two households have been allowed to meet outdoors.
- All arrivals from outside of the Common Travel Area (UK and Ireland) must self-isolate for 10 days at a managed quarantine hotel.
- The ‘stay at home’ order was replaced with a ‘stay local’ one on 2 April 2021.
- Hairdressers, barbers, garden centres, click and collect and homeware stores could re-open on 5 April 2021.
- Schools can re-open full-time on 12 and 20 April 2021, depending on term dates.
Wales
- ‘Stay local’ rules were lifted in Wales on 27 March 2021, removing internal travel restrictions and allowing up to six people from up to two households to meet outside.
- Travellers who have been in a red list country in the last 10 days are not allowed into Wales and must self-isolate for 10 days in a managed quarantine hotel in either England or Scotland.
- Arrivals from other countries not on the red list must self-isolate for 10 days and undertake testing.
- Travel to and from England and the Common Travel Area allowed from 12 April 2021.
- Non-essential shops able to re-open from 12 April 2021.
- Schools allowed to re-open from 12 April 2021.
England
- England’s restrictions were eased on 29 March 2021, allowing two households or six people to meet outside. Non-essential retail continued to be closed.
- UK and Irish nationals arriving from red list countries must quarantine at hotels selected by the government. With some exceptions, non-UK and non-Irish nationals are not permitted to travel to the UK from red list countries.
- Arrivals from other countries must self-isolate at home for 10 days and are required to present evidence of a negative COVID test before boarding planes.
- Non-essential retail allowed to re-open from 12 April 2021.
- Public buildings, outdoor hospitality venues and most outdoor attractions able to re-open from 12 April 2021.
- Indoor leisure and sports facilities approved to re-open for individual exercise from 12 April 2021.
Northern Ireland
- Northern Ireland is under a full national lockdown.
- Arrivals from other countries outside of the Common Travel Area must self-isolate at home for 10 days and are required to present evidence of a negative COVID test before boarding planes.
Current regulations in Northern Ireland are set to be reviewed 15 April 2021.
More information and recent and upcoming changes can be found on gov.uk.
Back to table of contents17. Strengths and limitations
Detailed information on the strengths and limitations of the different indicators included in this bulletin is available in the Coronavirus and the latest indicators of the UK economy and society methodology. We will summarise any crucial updates or warnings in this section in the future.
Back to table of contents
11. Social impact of the coronavirus
This section includes some provisional results from the Opinions and Lifestyle Survey (OPN) covering the period 7 to 11 April 2021. The survey went out to 6,030 adults in Great Britain and had a response rate of 68%.
Further information to help understand the impact of the coronavirus (COVID-19) pandemic on people, households and communities in Great Britain, will be available in Coronavirus and the social impacts on Great Britain due to be published 16 April 2021.
Travelling to work
In the week ending 11 April 2021, the proportion of working adults in Great Britain who in the last seven days:
This week saw minimal changes in those measures compared with the previous week, but still a gradual continuation in the trend away from working from home.
Shopping
Of the 95% of adults that reported they had left home in the last seven days, the proportion that did so to shop for food and medicine remained unchanged compared with the previous week at 75%.
The proportion of these adults who shopped for things other than food and medicine in the last seven days also saw no change compared with the previous week at 14%.
Back to table of contents