Table of contents
- Main points
- Labour productivity fell for the third consecutive quarter compared with the same quarter a year ago
- Multi-factor productivity fell as capital and labour composition increased slightly
- The productivity puzzle and the lost potential £5,000 in wages
- Public service productivity decreases in year to Quarter 1 (Jan to Mar) as inputs grow faster than output
- Unit labour costs growth above 2% for the sixth consecutive quarter compared with a year ago
- What new information is available on the characteristics of firms with high and low productivity?
- Experimental comparisons of infrastructure across Europe: May 2019
- Links to related statistics
1. Main points
Labour productivity for Quarter 1 (Jan to Mar) 2019, as measured by output per hour, decreased by 0.2% compared with the same quarter in the previous year; on this basis labour productivity decreased for the third consecutive quarter.
Within this, services recorded labour productivity growth of 0.2% compared with the same quarter in the previous year; but manufacturing fell by 0.9% during the same period.
Compared with the same quarter in 2018, multi-factor productivity (MFP) for the market sector in Quarter 1 2019 is estimated to have decreased by 0.2% and is still 4.5 percentage points below the level in 2008.
This lack of multi-factor productivity growth can be estimated to have restricted wage growth; we have estimated that if productivity had grown in line with its long-term trend, average market sector wages would have been over £5,000 higher in 2018 than were observed in reality.
Public service productivity also fell in Quarter 1 2019 as growth in inputs exceeded growth in output, although both inputs and output growth were high by historical standards.
2. Labour productivity fell for the third consecutive quarter compared with the same quarter a year ago
Labour productivity output per hour decreased by 0.2% in Quarter 1 (Jan to Mar) 2019 compared with the same quarter in 2018. Comparing the latest quarter’s growth rates with the same period a year ago provides a better measure of the long-term trend of labour productivity growth when compared with the previous quarter’s data.
This fall reflects total average hours worked growing faster than gross value added (GVA) growth; 2% and 1.8% respectively. The fall in output per hour growth was attributed to a fall in manufacturing output per hour of 0.9%, with total average hours worked growing twice as fast as output (1.8% and 0.9%) respectively. In contrast, productivity for services increased 0.2%.
Figure 1 breaks down the log growth in productivity between Quarter 3 (July to Sept) 2009 and Quarter 1 2019 comparing the split of hours, (which have had the sign reversed to reflect their effect on productivity,) and GVA. Since the downturn GVA growth has averaged 1.6%, slightly higher than the average hours growth of 1.2%. As a result, productivity has seen weak growth averaging 0.5%, with brief instances of high growth most noticeably in the initial post-downturn years.
Subsequent years experienced a slump in productivity, with consecutive periods of negative growth between the period of Quarter 2 (Apr to June) 2012 to Quarter 3 2013. Since then, productivity remained somewhat weak, having brief instances of high growth in Quarter 2 2015 and Quarter 4 (Oct to Dec) 2016. The latter being the recording the highest quarter on year growth since the downturn.
Figure 1: In Quarter 1 (Jan to Mar) 2019 growth in hours slightly exceeded growth in gross value added leading to a fall in productivity
Output per hour, quarter on same quarter a year ago log growth rates, seasonally adjusted, Quarter 3 (July to Sept) 2009 to Quarter 1 (Jan to Mar) 2019, UK
Source: Office for National Statistics
Notes:
- Estimates of hours worked have had their sign reversed to reflect how they affect output per hour. An increase in hours worked will contribute negatively to output per hour; while a decrease in hours worked will contribute positively to output per hour.
Download this chart Figure 1: In Quarter 1 (Jan to Mar) 2019 growth in hours slightly exceeded growth in gross value added leading to a fall in productivity
Image .csv .xls3. Multi-factor productivity fell as capital and labour composition increased slightly
The Office for National Statistics (ONS) is the only national statistical institute in the world to routinely publish quarterly experimental multi-factor productivity (MFP) estimates for the market sector. Figure 2 decomposes cumulative quarterly growth of market sector output per hour worked since Quarter 1 (Jan to Mar) 2008 into contributions from capital deepening (capital per hour worked) and labour composition (the skills make-up of the workforce), and the residual MFP contribution. In simple terms, MFP “explains” the portion of growth of labour productivity that cannot be attributed to improvements in capital or labour. More information can be found in our simple guide to MFP.
This figure highlights the prolonged weakness of market sector labour productivity since the financial crisis and how MFP, which is still 4.5 percentage points lower than in 2008 is a vital contributor to this.
Figure 2: Market sector output per hour has barely increased in the last 11 years
Decomposition of cumulative quarterly growth of output per hour worked, Quarter 1 (Jan to Mar) 2008 to Quarter 1 (Jan to Mar) 2019, UK, market sector
Source: Office for National Statistics
Notes:
- Labour productivity growth is the cumulative quarter-on-quarter log change in market sector gross value added (GVA) per hour worked.
- Columns show contributions of components, calculated by weighting log changes in each component by its factor income share.
- MFP is calculated by residual.
Download this chart Figure 2: Market sector output per hour has barely increased in the last 11 years
Image .csv .xlsCapital deepening has also been exceptionally weak by historic standards, reflecting sluggish growth in investment and buoyant growth in hours worked. On the other hand, labour composition has steadily improved over the last 10 years.
Back to table of contents4. The productivity puzzle and the lost potential £5,000 in wages
Figure 3: Multi-factor productivity estimated to be the largest driver of the productivity gap
Growth in output per hour from 1994 and contribution to productivity gap from 2008, UK market sector

Source: Office for National Statistics
Notes:
- In this illustration bars below the labour productivity line (for example labour composition) are contributing negatively to the productivity gap.
Download this image Figure 3: Multi-factor productivity estimated to be the largest driver of the productivity gap
.png (52.4 kB) .xlsx (20.6 kB)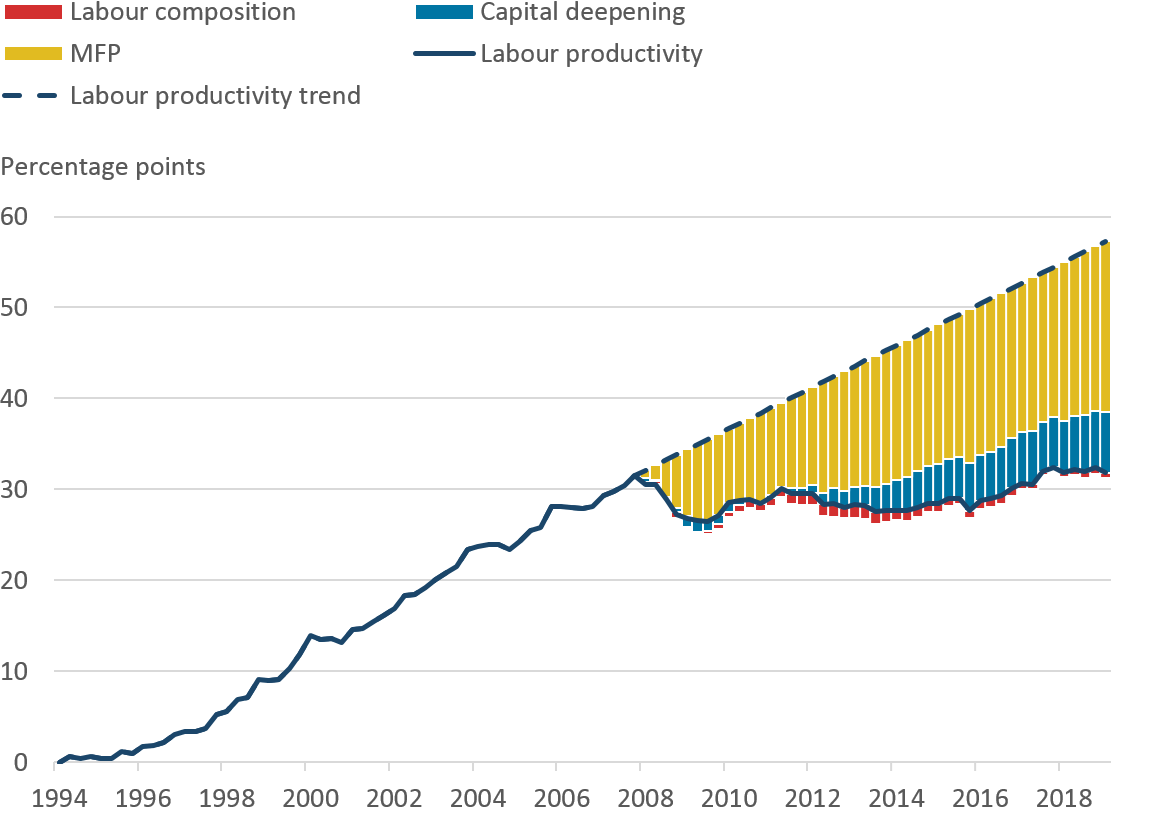
From last quarter we began decomposing the gap of market sector labour productivity into contributions from changes in labour composition, capital per hour and multi-factor productivity (MFP). The largest of these three components is MFP. If pre-downturn trends had continued, MFP would now be about 14% above the level in 2008, rather than 4.5% lower. In the real world, changes in MFP can arise for several reasons including technological progress, economies of scale, changes in management techniques and business processes or more efficient use of factor inputs. MFP is linked, therefore, not to an increase in the quantity or quality of measured factor inputs but rather to how they are employed. In practice, MFP may also reflect measurement error of inputs and outputs and missing factors of production.
How does this convert into wages? Productivity growth drives wages growth and has been historically low over the last decade. If productivity had grown in line with its long-term trend, and wages as a share of income had remained constant, average market sector wages would today be just over £5,0001,2 higher in 2018 for the average worker.
Notes for: The productivity puzzle and the lost potential £5,000 in wages
Calculated for 2018 as market sector labour income divided by market sector jobs then multiplied by the 18.5% gap and multiplied by 80% as an approximation for wages of total compensation of employees.
In September 2018 analysis by Institute for Fiscal Studies (IFS) on the output gap since suggested household incomes would have been £4,200 higher if incomes had continued to grow at the average rate in the decade before the crisis.
5. Public service productivity decreases in year to Quarter 1 (Jan to Mar) as inputs grow faster than output
Alongside these estimates of quarterly productivity growth for the whole economy and UK market sector, we have published updated experimental quarterly and annual estimates of public service productivity. These measures differ from labour productivity measures of the non-market sector by taking account of changes in a range of factor inputs, including labour and capital. The approach is similar to that used for estimates of multi-factor productivity (MFP), but MFP estimates published alongside this release focus on the market sector.
In general, because productivity is a long-term structural trend, we advise looking at changes in productivity between periods that are further apart which can help to smooth any fluctuations in growth rates. The trend over the last year is an example of why this is important.
Compared with the same quarter in the previous year, productivity for total public services decreased by 3.1% in Quarter 1 (Jan to Mar) 2019. Over this period, inputs increased by 5.3% while output increased by less (2.2%), causing productivity to fall. The growth in inputs was much higher than the average annual growth rate of the last 20 years. The latest quarter continues a trend of negative productivity growth that began in 2018. As inputs growth has a negative effect on productivity growth, in Figure 4 growth rates of inputs are inverted – as such, the sum of the stacked bars (output, and inverted inputs) is equal to productivity growth.
Figure 4: Productivity falls in Quarter 1 (Jan to Mar) 2019 when compared with the same quarter of the previous year
Public service productivity, inputs and output, quarter-on-same-quarter-a-year-ago growth rates, UK, Quarter 1 2017 to Quarter 1 2019
Source: Office for National Statistics
Notes:
- Data are from this experimental quarterly release.
- Experimental quarterly estimates of public service productivity are indirectly seasonally adjusted, calculated using seasonally adjusted inputs and seasonally adjusted output.
- Changes have been expressed as log changes such that output growth and (inverted) input growth can be added to exactly equal changes in productivity. Further information on log changes can be found in Section 3 of A simple guide to multi-factor productivity.
Download this chart Figure 4: Productivity falls in Quarter 1 (Jan to Mar) 2019 when compared with the same quarter of the previous year
Image .csv .xls6. Unit labour costs growth above 2% for the sixth consecutive quarter compared with a year ago
Unit labour costs and section unit labour costs are now covered in a separate publication. In order to provide more detailed and relevant commentary.
Labour is the largest domestic cost facing most businesses in the UK, and so rising labour costs are an important indicator of domestic inflationary pressures. The extent to which changes in the cost of labour affect companies’ production costs, and hence inflation, depends on growth in unit labour costs (ULCs) — how wages and other labour costs facing companies are growing relative to productivity.
ULCs represent the full labour costs, wages and salaries as well as social security and pension contributions paid by employers, incurred in the production of a unit of output.
Unit labour costs (ULCs) increased by 2.1% in Quarter 1 (Jan to Mar) 2019, compared with the same quarter a year ago. Growth was not as strong as at the end of 2018, still unit labour costs growth was above 2% for the sixth consecutive quarter compared with a year ago.
Back to table of contents7. What new information is available on the characteristics of firms with high and low productivity?
In May 2019 we published Firm-level labour productivity measures from the Annual Business Survey, Great Britain: 2017. This article extends a series of releases published by the Office for National Statistics (ONS), exploring trends in firm-level labour productivity (ONS 2017a, ONS 2017b). Our analysis shows that:
aggregate UK productivity growth between 2010 and 2017 was largely driven by businesses at the top of the productivity distribution; however, labour productivity growth of these businesses has been lower post-downturn (2010 to 2017) than during the period immediately prior to the downturn (2004 to 2007)
the middle of the labour productivity distribution – between the 40th and 60th percentiles of employees – remained below pre-downturn levels in 2017
in the most recent period (2015 to 2017), the level of labour productivity of the middle third of employees fell in real terms
This analysis also highlights the firm-level characteristics driving differences in labour productivity across businesses. Over the period studied, 2006 to 2017, businesses that were older and larger – in terms of employment – were more productive on average. Additionally, foreign-owned businesses were around 18% more productive than equivalent, domestically-owned businesses, on average between 2006 and 2017. Figure 5 shows that the composition of the top-ranking industries for labour productivity changed very little between 2008 and 2017 and we find a similar result for the lowest ranking industries. The most productive industry divisions were predominantly capital intensive (production), while the least productive were predominantly labour intensive (services).
Figure 5: The top ranking industries by productivity have changed very little over time and are predominantly capital-intensive (production) industries
2008 to 2017, current price, Great Britain
Embed code
8. Experimental comparisons of infrastructure across Europe: May 2019
In May 2019, we continued our series of publications on infrastructure with comparisons of infrastructure stocks and investment in the UK and other European countries. Infrastructure is widely thought to have a positive effect on economic growth and productivity, and differences in infrastructure may therefore help to explain differences in productivity across countries. In previous publications, we have set out how we are developing experimental statistics on infrastructure in the UK. The first of these, Developing new measures of infrastructure investment: July 2017, tackled definitional issues and presented an initial look at available data sources to measure infrastructure investment. The second, Developing new statistics of infrastructure: August 2018, updated estimates of investment and presented an initial look at infrastructure stocks.
Compared with other European countries, the UK’s government investment in infrastructure accounted for 2.3 % of total government spending in 2017, higher than in Germany, France and Italy.
Figure 6: The UK overtakes other EU G7 economies in government infrastructure investment
Government investment in infrastructure as a proportion of total government spending, EU G7 economies, 2006 to 2017
Source: Eurostat, Office for National Statistics
Download this chart Figure 6: The UK overtakes other EU G7 economies in government infrastructure investment
Image .csv .xlsSince the economic downturn, government investment in infrastructure in the UK outpaced other EU G7 countries. From 2013 to 2017, government investment in the UK grew by 6.1%, faster than in Germany which grew by 4.1 %. For France, Italy and the Netherlands government investment in infrastructure fell in the period.
Back to table of contentsContact details for this Article
Related publications
- Multi-factor productivity estimates, UK: July to September 2019
- Public service productivity: quarterly, UK, October to December 2019
- Labour productivity, UK: October to December 2019
- Unit labour costs, UK: October to December 2019
- Public service productivity: quarterly, UK QMI (Experimental Statistics)