1. Introduction
The recent labour productivity performance of the UK economy has been strikingly weak. Growth in output per hour worked was around 0.5% per quarter in the decade prior to the economic downturn, but slowed to 0.1% per quarter between Q2 2009 and Q1 2016. This recent slowdown appears to have affected firms in different industries, of different sizes, and is a phenomenon observed in developed economies across the world.
Following the Bean Review’s (2016) focus on the measurement of productivity, ONS has started to develop plans to improve both the content and the communication of official estimates and analysis of productivity. This, the second edition of the Productivity Bulletin, provides an overview of the key findings of recent ONS productivity statistics and research, bringing together outputs which are central to the policy debate to provide a coherent narrative on recent developments. In particular, it examines the headline labour productivity measures, setting out the central themes of this release. It provides a detailed analysis of the revisions to labour productivity, as well as a short analysis of how accounting for productivity trends in specific industries alters estimates of market sector productivity.
While trends in labour productivity have been widely used in the economic policy debate, other measures of productivity are central to understanding recent developments. Estimates of productivity in the public services – the output of which accounted for around 18.9% of UK GDP in 2013 – are one example. Recognising that the measurement of the productivity of these activities is challenging, the Bean Review (2016) argued for a more timely set of public service productivity estimates, the first of which are published alongside this bulletin. The Bean Review (2016) also placed particular emphasis on estimates of multi-factor productivity – which provide a measure of broadly defined technical progress, after accounting for changes in the quality and quantity of labour input and the volume of capital input. This edition of the Bulletin consequently summarises the findings of the first timely estimates of public service productivity,as well as the conclusions of recent ONS analysis of multi-factor productivity.
Finally, consistent with the objective of this publication set out in the first Productivity bulletin, this edition provides a brief summary of ONS’ future plans for productivity statistics. These draw on the recently published draft Economic Statistics and Analysis Strategy. They include proposals to develop the existing growth accounting suite so as to provide more timely and more detailed estimates of multi-factor productivity; to redevelop and enhance the labour productivity system, as well as an ambitious micro-data research agenda. It includes further information on ONS’ plans to run surveys of management practices and proposals to publish measures of investment in, stocks of and the capital services derived from infrastructure in the UK.
Back to table of contents2. Labour Productivity
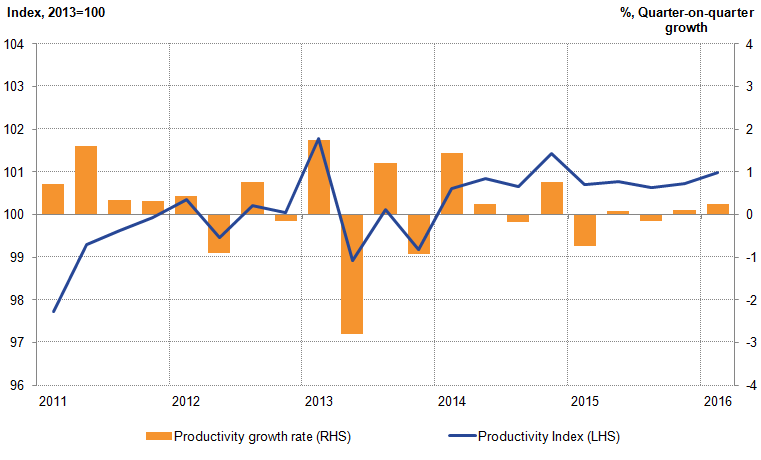
Output per hour – ONS’s main measure of labour productivity – grew by 0.5% in Q1 2016 (Figure 1). This was unchanged from the flash estimate reported in May, and higher than the 0.9% fall experienced in Q4 2015. Growth primarily came from higher gross value added (GVA), while productivity hours remained unchanged on the quarter. This strengthening of productivity growth reflects growth in both the services (0.5%) and manufacturing industries (0.7%) – including a notable recovery in the output per hour growth of the latter. In Q1 2016, aggregate output per hour was 0.4% higher than the same quarter a year earlier, but remains 0.7% below the pre-downturn peak in Q4 2007.
Figure 1: Output per hour
Seasonally adjusted, quarter 1 (Jan to Mar) 2008 to quarter 1 (Jan to Mar) 2016, UK
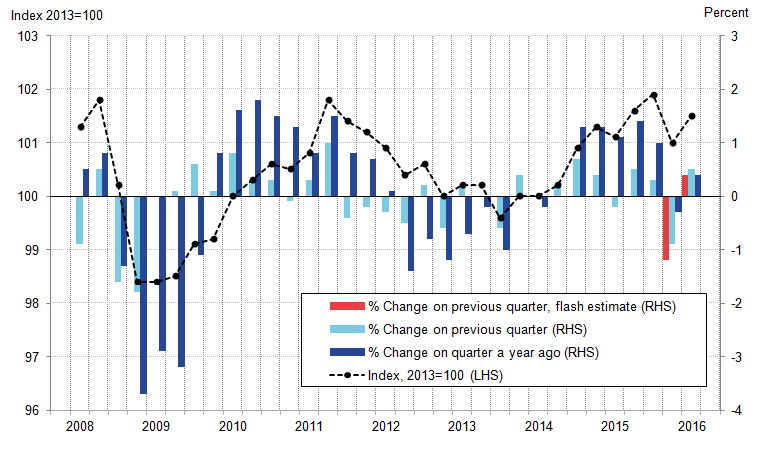
Source: Office for National Statistics
Download this image Figure 1: Output per hour
.png (31.2 kB) .xls (20.0 kB)
Quarterly growth of 0.5% is equal to the 1994 to 2007 average – but taken together with recent, weaker quarters, there is little sign of an end to UK's "productivity puzzle". This puzzle is illustrated by Figure 2, which shows two alternative measures of productivity – output per hour and output per worker – alongside their projected 1994 to 2007 trends. Following years of steady growth, each measure peaked in Q4 2007 and fell during the economic downturn. However, due to a strong labour market performance accompanying a relatively weak recovery in output growth, productivity did not return to the pre-downturn trend.
Figure 2: Output per hour and output per worker
Seasonally adjusted, quarter 1 (Jan to Mar) 2008 to quarter 1 (Jan to Mar) 2016, UK
Source: Office for National Statistics
Download this chart Figure 2: Output per hour and output per worker
Image .csv .xls3. Revisions to labour productivity
The estimates of labour productivity published alongside this edition of the Productivity Bulletin also include revisions arising from:
- revised estimates of gross value added (GVA) consistent with the National Accounts 2016 (also known as “Blue Book 2016”), which affects the numerator of the productivity ratio
- the annual re-weighting of the Labour Force Survey (LFS) results, leading to changes in estimates of average hours worked since Q1 2012
- revised estimates of the number of jobs in the economy, arising from changes to the estimated number of businesses in the UK
- the annual review of the seasonal adjustment of labour productivity
However, despite the broad scope of these changes, the revisions to both output and labour input had little impact on the broad picture of the UK’s ‘Productivity Puzzle’. Both the current estimate and last quarter’s estimate show productivity growing by 29% between 1994 and 2007, followed by an overall flat trend since 2007 (Figure 3). However, the precise path productivity has taken since 2011 has changed – primarily due to revisions to output. While productivity was previously estimated to have shown a slight recovery in 2013, followed by near-zero growth in 2014, current estimates suggest productivity continued to decline in 2013 but grew in 2014. Combined with a downward revision to productivity growth in 2015 (due to both lower output growth and higher growth in hours worked) output per hour in Q1 2016 is now estimated to be 0.1% higher than in 2007.
Figure 3: Output per hour (current and previous estimate), and contributions to the revision from changes in hours worked and changes in output
Seasonally Adjusted, quarter 1 (Jan to Mar) 1994 to quarter 1 (Jan to Mar) 2016, UK

Source: Office for National Statistics
Download this image Figure 3: Output per hour (current and previous estimate), and contributions to the revision from changes in hours worked and changes in output
.png (24.7 kB) .xls (32.3 kB)
The industry breakdown underlying the productivity puzzle is also largely unchanged by the revisions introduced to output and labour – albeit with some notable exceptions. The three industries which experienced the largest falls in productivity between 2007 and 2015 continue to be the three non-manufacturing production industries – Mining and Quarrying, Electricity and Gas, and Water and Sewerage (Figure 4) – and the scale of the fall in each of these industries between 2007 and 2015 remains broadly unchanged, at 44.8%, 32.7%, and 15.3% respectively.
Figure 4: Growth in output per hour between 2007 and 2015 by industry, current and previous estimates
Seasonally Adjusted, % growth between 2007 and 2015, UK
Source: Office for National Statistics
Download this chart Figure 4: Growth in output per hour between 2007 and 2015 by industry, current and previous estimates
Image .csv .xlsSimilarly, the industries experiencing relatively high growth remain broadly the same – including Administration and Support services, Agriculture, and Information and Communication services – as does the magnitude of their productivity growth. Across all industries, the most notable change occurs in Real Estate, where output per hour growth between 2007 and 2015 was revised from 9.2% to 2.5%, largely due to changes in the methodology for calculating imputed rents. Few industries experienced high productivity growth over the period, demonstrating the widespread nature of the productivity puzzle.
The recent weakness of UK labour productivity has been accompanied by the relatively slow growth of unit labour costs (ULC). ULC are a broad measure of the average cost of labour for each unit of output produced, and offer insights on both cost pressures for firms and broader inflationary pressure. Despite weak productivity growth, ULC growth during the post-downturn period has been relatively subdued (Figure 4), although they have strengthened over recent quarters. Revisions to labour costs and output have had relatively similar impacts on ULC growth and while the trends of both series remain similar – particularly prior to 2011 – the timing of recent turning points has changed slightly. The relatively high growth of 2012 now continues into 2013, while the negative growth towards the start of 2014 now extends throughout the year.
Figure 5: Growth in unit labour costs (current and previous estimate), and contributions to the revision from changes in Labour Costs and changes in output
Seasonally Adjusted, quarter 1 (Jan to Mar) 1998 to quarter 1 2016, quarter on same quarter last year, %, UK
Source: Office for National Statistics
Download this chart Figure 5: Growth in unit labour costs (current and previous estimate), and contributions to the revision from changes in Labour Costs and changes in output
Image .csv .xls4. Market sector output per hour
These measures of output per hour and of unit labour costs are based on the output of and labour input provided to the whole economy and its component industries, and are usually presented in terms of growth rates or indexed to a specific period. As a consequence, comparisons of productivity levels – which differ widely across industries – can be difficult. Figure 6 summarises these differences across two dimensions: The length of the bar relative to the horizontal axis indicates the level of output per hour worked in each represented industry in 2015, while the height of the bar indicates the share of total output accounted for by each industry. Industries which account for a relatively large share of total output consequently have a greater impact on average labour productivity than industries with lower levels of output.
Figure 6 makes it apparent that output per hour worked varies widely across industries – and that Real estate in particular is an outlier. This reflects the large quantity of imputed rents of owner occupiers which is included in the National Accounts as non-market output of the household sector – which is counted as the output of the Real Estate industry – and which is entirely a return to capital rather than a return to labour. In fact, it is generally the case that industries with higher GVA per hour are the more capital-intensive industries such as Mining and quarrying and utilities, or those with higher proportions of skilled labour such as Financial services and ICT. In these industries, the application of more capital per unit of labour permits a higher level of output per hour than in other, less capital-intense industries.
Figure 6: Current price output per hour by industry
Levels and shares, 2015, UK

Source: Office for National Statistics
Download this image Figure 6: Current price output per hour by industry
.png (24.6 kB) .xls (20.5 kB)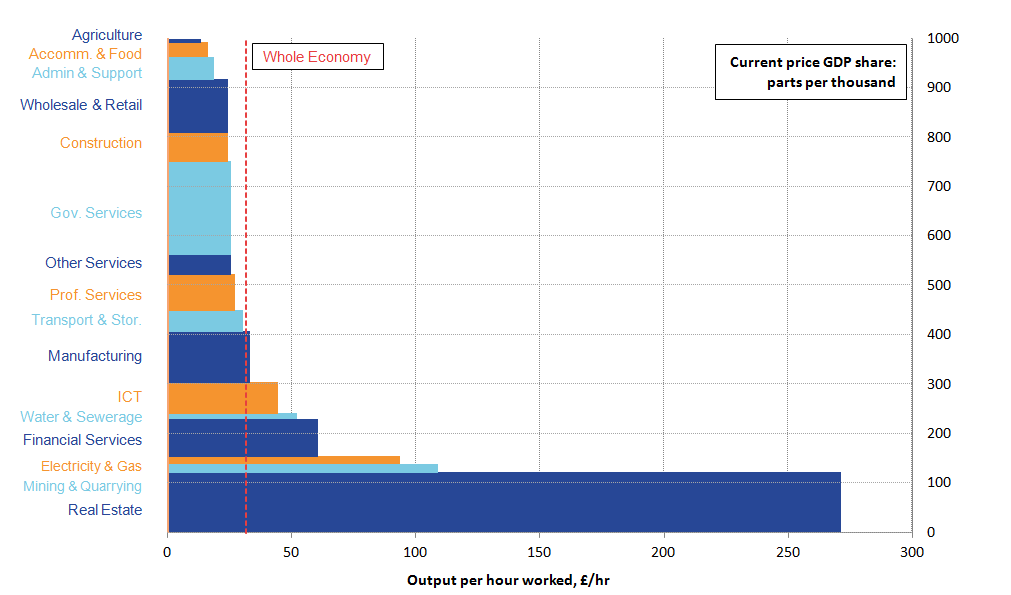
Given the unusual nature of Real estate, there is a case for focussing on a ‘core’ measure of productivity which excludes this industry. However, this would leave other non-market activities in the aggregate which, though not outliers in terms of Figure 6, are subject to measurement issues arising from the absence of prices for outputs. Another approach is to focus on market sector productivity. The market sector metric excludes imputed rentals and other non-market economic activity, mainly in Government services and Other services (Figure 7). This alternative measure of market sector output per hour grew a little faster than the whole economy estimate prior to the economic downturn (around 2.5% per year, compared with 2.2% per year for the whole economy), although this difference is barely perceptible in the extrapolations. Combined with a weaker trajectory since the economic downturn (-0.3% per year, compared with zero for the whole economy series) the productivity gap for this measure of core labour productivity, measured as the percentage below the extrapolated trend, was around 20% in Q1 2016, compared with a gap of around 17% for the whole economy estimate.
Figure 7: Whole economy and market sector output per hour
Actual and projection, quarter 1 (Jan to Mar) 1997 to quarter 1 2016
Source: Office for National Statistics
Download this chart Figure 7: Whole economy and market sector output per hour
Image .csv .xlsWhat has driven the relative performances of market and whole economy output per hour? To answer this question, it is informative to look at the sources of the market sector productivity gap in terms of pre- and post-downturn trends in output and hours worked. Leaving aside the period Q1 2008 to Q3 2009, when market sector GVA declined more than 9% and hours worked also fell sharply, the post-downturn period has been characterised by slower output growth (2.3% per year compared with 3.2% per year prior to the downturn) and faster growth of hours worked (1.0% per year compared with 0.7% prior to the downturn). This means that, rather than making up any of the loss of productivity during the downturn, productivity growth in the market sector has been much weaker than previously, averaging only 0.3% per year between Q3 2009 and Q1 2016. This demonstrates that the productivity puzzle is a market sector phenomenon, and that stripping out non-market output such as that related imputed rental and the activities of government does nothing to improve the recent productivity performance.
Back to table of contents5. Public sector productivity
Alongside these estimates of labour productivity, ONS has also published the first set of timely estimates of productivity in the public services, responding to the recommendations of the Bean Review (2016).
In recent years, ONS has produced annual estimates of total public service productivity and breakdowns for specific services including healthcare, education and adult social care. These estimates are produced under the principles outlined in the 2005 Atkinson Review. The productivity of these services is estimated by comparing growth in the total amount of output produced with growth in the total amount of inputs used to deliver them. Productivity will consequently be higher (lower) when more (less) output is produced for each unit of input. However, these annual public service productivity measures differ from both the labour productivity and multi-factor productivity (MFP) estimates produced by ONS for government services in several respects:
- Measures of the output of the public services are estimated gross of intermediate consumption, are estimated separately for each service and aggregated to deliver total public services output in deflated expenditure terms. Direct volume activity measures are used for some services – covering two-thirds of government expenditure, including most healthcare and education services – and adjustments for quality are applied in an effort to account for changes which would otherwise be represented through the price mechanism. For services where direct volume activity data are not available, the deflated volume of input expenditure is assumed equal to the volume of outputs. This contrasts with the government services output measures used in labour productivity and MFP, which are estimated net of intermediate consumption, and which do not include quality adjustments.
- Measures of the inputs to public services include intermediate consumption, capital consumption and labour input, expressed in deflated expenditure terms for each public service, which are in turn aggregated to deliver total public service inputs. In labour productivity, by contrast, only the volume of labour input is included. In MFP, measures of labour input are included alongside changes in the composition of labour and the volume of capital services. There are also a range of measurement and coverage differences between public service and government services inputs, more detail on which can be found in Gill & Kliesmentyte (2015) and Phelps (2010).
As a consequence, the public service productivity estimates are not directly comparable with labour productivity metrics for government services, and while they are similar in spirit to estimates of MFP in government services, they retain several important differences. Finally, the timeliness of these measures has been limited, reflecting the need for detailed activity data to deliver estimates of public service output. Annual estimates have historically been produced two years after the period to which they refer.
The Bean Review (2016) identified the need for improvement in the timeliness of public service productivity estimates. The report accepts that early estimates based on incomplete information will be less reliable, but argues that the less timely the estimates are, the less useful they are likely to be for policy makers. The new estimates published alongside this bulletin – which provide an indication of public service productivity to Q1 2016 – consequently represent a considerable improvement in timeliness and begin to meet one of the recommendations of the Bean Review (2016). To improve timeliness, ONS has reviewed existing methods and identified alternative data sources which can be used to inform the path of public service productivity. Following extensive consultation and the release of a proposed “nowcasting” method for estimating quarterly total public service productivity , ONS can now publish estimates of total public service productivity as experimental statistics in line with the Quarterly National Accounts.
The results of this new methodology suggest that total public service productivity fell by 0.2% in 2015, as inputs grew by 1.5% and exceeded output growth of 1.4% (Figure 8). This followed productivity growth of 0.9% in 2014, when the output and input of the public services grew by 2.3% and 1.4% respectively. Figure 8 shows the annual total public service productivity series, with growth beyond 2013 taken from the nowcast quarterly series. The experimental estimates suggest that, despite the slight contraction in the latest period, the productivity of UK public services has been on an upwards trend for much of the last six years. Since 2009 total public service productivity is estimated to have increased by 3.6% – around 0.6% growth per year. Further analysis on annual total public service productivity prior to 2013, including the contribution of individual services, can found in Public service productivity estimates: total public service, 2013.
Figure 8: UK total public service annual productivity with quarterly constructed estimate
Seasonally adjusted, 1997 to 2015, UK

Source: Office for National Statistics
Notes:
- TPSP refers to Total Public Service Productivity.
- Estimates for 2014 and 2015 reflect growth rates of the annualised quarterly total public service productivity applied to the quality adjusted annual total public service productivity
Download this image Figure 8: UK total public service annual productivity with quarterly constructed estimate
.png (16.6 kB) .xls (23.6 kB)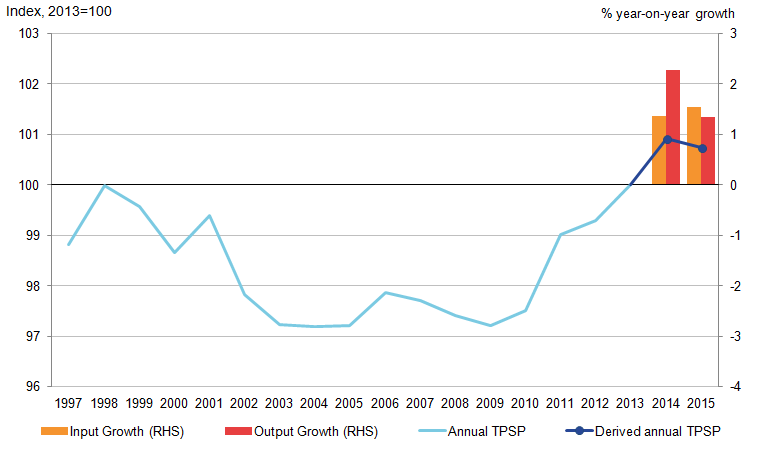
Figure 9 shows the quarterly path and suggests that the productivity of the public services increased by 0.2% in Q1 2016 relative to the previous quarter. This followed on from an increase of 0.1% in Q4 2015 and a fall of 0.1% in Q3 of 2015. Breaking down the productivity estimate, the latest rise of productivity was driven by growth of 0.5% in the volume of public service output which more than offset growth of inputs of 0.2% in Q1 2016.
Figure 9: Quarterly total UK public service productivity
Seasonally adjusted, quarter 1 (Jan to Mar) 2011 to quarter 1 (Jan to Mar) 2016, UK
Source: Office for National Statistics
Download this image Figure 9: Quarterly total UK public service productivity
.png (21.0 kB) .xls (30.7 kB)
These new data suggest that following relatively strong growth in 2014, public service productivity fell slightly in the first part of 2015, recovering only in recent quarters. Below the headline level, trends in quarterly total public service output, inputs and productivity estimates are mostly determined by services where quarterly data are readily available, such as healthcare.
Further detail and explanation on data sources for quarterly total public service productivity can be found in the Quality and Methodology Information paper and methodology article – New nowcasting methods for more timely quarterly estimates of UK total public service productivity.
Notes:
Estimates for 2014 and 2015 reflect growth rates of the annualised quarterly total public service productivity applied to the quality adjusted annual total public service productivity. Quality adjustments have been applied to public service productivity in the period to 2013, but are not applied to the quarterly tail in 2014 and 2015.
Back to table of contents6. Multi-factor productivity
These new and revised estimates of the productivity of public services and of labour productivity have come alongside new estimates of UK multi-factor productivity (MFP). MFP measures differ from measures of labour productivity – which simply divide total output by total labour input – by taking account of other factor inputs to production. A multi-factor growth accounting framework decomposes the growth of output into the portion explained by the growth of inputs to production, and a residual which is widely interpreted as a measure of productivity. If output growth is entirely explained by more inputs being drawn into production, then multi-factor productivity growth is said to be negligible. If, by contrast, output has grown without any considerable change in the volume of inputs, then the model suggests that multi-factor productivity has strengthened.
The ONS growth accounting framework decomposes the growth of output into that attributable to the growth of capital input, the growth in labour input – both of the quantity and the quality of labour – and a residual which is attributed to the efficiency of factor use – widely known as multi-factor or total-factor productivity. Estimates of capital services used in production are published in the Volume Index of Capital Services (Blunden and Franklin 2016), while estimates of the quantity and quality of labour are published in the Quality of Labour Input release (Connors and Franklin 2015). Further information on the methods used in these papers is available in these respective publications.
The results of this analysis suggest that around two-thirds of output growth in 2014 was attributable to growth in the volume of both labour and capital input, while a further third was attributable to the multi-factor productivity residual (Figure 10). MFP accounted for 1.2 percentage points of output growth of 3.8% in 2014 – the largest contribution since 2007, but slightly lower than the average contribution in the decade prior to the economic downturn (1.4 percentage points). Growth in capital input contributed a further 0.5 percentage points to output growth in 2014, which was also the strongest in the post-downturn era, partly reflecting the relatively strong growth of business investment over this period. However, the main contribution came from increased labour input, which is estimated to have added around 2.0 percentage points to output growth in 2014. Changes in the composition and quality of labour input made a much more modest contribution, adding just 0.1 percentage points to output growth over the same period. This slowdown is broadly consistent with evidence that the composition of labour input may have changed over this period.
Figure 10: Contributions to output growth: capital, labour hours and quality and multi-factor productivity
2000 to 2014, UK
Source: Office for National Statistics
Notes:
- These estimates of output growth are consistent with Blue Book 2015, and are for the market sector. They consequently do not capture changes in outputs or inputs associated with the public sector, and are not consistent with the labour productivity estimates presented in this edition of the productivity bulletin.
Download this chart Figure 10: Contributions to output growth: capital, labour hours and quality and multi-factor productivity
Image .csv .xlsMFP estimates can also used to provide a breakdown of movements in labour productivity, as measured by output per hour. Figure 11 displays this breakdown for 2000 to 2014, showing the contribution to output per hour growth arising from labour composition, capital deepening (the quantity of capital available per unit of labour input) and from multi-factor productivity. Consistent with the growth in total output, MFP made a considerable, positive contribution to output per hour growth in 2014 – its largest contribution since 2007. This was partly offset by a slight fall in the availability of capital per worker – known as capital shallowing – holding back the growth of output per hour over this period. Taken together, these results highlight that while “traditional” sources of productivity growth – including labour composition and capital deepening – explain a large portion of the weakness of productivity, the collapse of multi-factor productivity in the post-downturn era is at least as, if not more, important.
Figure 11: Contributions to output per hour growth: capital, labour hours and quality and multi-factor productivity
2000 to 2014, UK
Source: Office for National Statistics
Notes:
- These estimates of output growth are consistent with Blue Book 2015, and are for the market sector. They consequently do not capture changes in outputs or inputs associated with the public sector, and are not consistent with the labour productivity estimates presented in this edition of the productivity bulletin.
Download this chart Figure 11: Contributions to output per hour growth: capital, labour hours and quality and multi-factor productivity
Image .csv .xls7. Future plans
The accurate measurement of productivity – including the challenges of estimating labour productivity, public service productivity and more complex, multi-factor productivity – is at the heart of the Bean Review (2016):
“The review was prompted by the growing difficulty of measuring output and productivity accurately in a modern, dynamic and increasingly diverse and digital economy”
Over recent months, ONS has been developing its response to the recommendations of the Bean Review (2016). While the detail of these proposals and their likely timelines for delivery are being worked through, ONS has issued a broad statement of intent in the form of the draft Economic Statistics and Analysis Strategy (ESAS), which was published in May 2016. The ESAS sets out ONS’ high-level goals for economic statistics and analysis following the Bean Review (2016), and contains several proposals on Productivity. This section of the Productivity Bulletin provides a brief overview of these proposals, some additional detail and their impact on key productivity outputs.
1. Growth accounting
Perhaps the clearest recommendation on the measurement of productivity from the Bean Review (2016) – as distinct from recommendations regarding the measurement of output or labour input – concerns the ONS’ growth accounting framework. At present, ONS publishes annual estimates of the quality of labour input used in production (QALI), the volume of capital services derived from the UK capital stock (VICS), and uses these alongside estimates of output growth to deliver an annual article on Multi-factor Productivity (MFP). Growth accounting exercises of this form provide a more holistic assessment of trends in productivity and add considerable value to the economic policy debate (OECD 2001). The Bean Review (2016) consequently calls for the ONS to consider developing the existing growth accounting framework, so as to deliver more timely estimates of MFP that can be given a greater weight in current economic policy debate.
As set out in the ESAS, ONS has drawn up plans to develop the existing growth accounting suite (QALI, VICS and MFP) so as to meet this recommendation. Over the coming year, ONS will review the existing methodology and production systems which support each of these outputs. It will assess key data dependencies and review international best practice in an effort to deliver new, quarterly estimates from each of these components, to be published on the same timetable as labour productivity. This should lead to a considerable improvement in timeliness: our ambition is to provide MFP statistics – which were last published in May 2016 for the period to 2014 – closer to 90 days after the end of the reference quarter.
Over the coming year, the production timetable for the existing growth accounting suite will be aligned with that for the Productivity Bulletin. As set out in Table 1 below, our intention is to publish QALI and VICS in October 2016 and January 2017 respectively, including estimates to the most recent quarter. Estimates of quarterly MFP will follow in April 2017, allowing for a period of testing and quality assurance before the new quarterly production system goes live from January 2018.
Table 1: Publication plans for the growth accounting suite
| QALI | VICS | MFP | ||
| 2016 | 8th July | |||
| 7th October | Y | |||
| 2017 | 6th January | Y | ||
| 7th April | Y | |||
| July | ||||
| October | ||||
| 2018 | January | Y | Y | Y |
| April | Y | Y | Y | |
| Source: Office for National Statistics | ||||
Download this table Table 1: Publication plans for the growth accounting suite
.xls (26.6 kB)As with all statistical developments of this sort, there are risks to this ambitious timetable which ONS will work to manage over the coming months. In particular, these plans will depend on (a) identifying and resolving key data dependencies and (b) an analysis of the quality of the resulting quarterly MFP series and its usefulness for policy makers and others. ONS will work to communicate progress on these objectives to users, both through future editions of the Productivity Bulletin and ONS’ Productivity User Group events.
Alongside these changes to the timeliness of the growth accounting articles, ONS will work to develop both the level of detail available in these publications and the quality of the data. This will involve (a) continuing to take on and explain revisions to the output and labour measures produced in the National Accounts which occur as a matter of course and (b) a further set of development activities. Among the latter, ONS will consider the feasibility of enhancing the level of industrial detail available in these publications. This work will also enhance estimates of the quality of labour input for the market sector by accounting for the composition of labour employed in the Non-profit institutions serving households (NPISH) sector. Finally, ONS is also considering the production of timely statistics on infrastructure in the UK – including both the stock of and the investment flows to infrastructure assets, so as to deliver estimates of the flow of “infrastructure services” supplied. A consultation paper will be published in the coming months seeking user feedback on the potential usefulness of these data.
2. Labour productivity
Alongside developments to the growth accounting suite, ONS will also seek to make further improvements to estimates of labour productivity, with the aim of raising their quality. Over the next year these activities are likely to take two forms.
Firstly, ONS will be developing a new labour productivity system to generate greater analytical capability, to increase reliability and to reduce the production burden. While this work is not likely to entail any revisions to published data, it will free resources during the publication window and facilitate stronger quality assurance mechanisms. This work has already made good progress: we expect to parallel run the current and replacement systems for the labour productivity releases in October 2016 and January 2017.
As part of the process of establishing the new production system, ONS will also examine several areas where improvements to the measurement of labour productivity are possible. These will include examining the treatment of working proprietors – who are currently treated as employees in the labour productivity estimates, but who might more accurately be considered self-employed. This will also include examining the feasibility of improving the quality of our labour input measures. In particular, ONS is examining whether it is possible to address suspected patterns of “misreporting” of industry of employment among respondents to the Labour Force Survey using existing administrative and other large datasets. While these improvements will not affect headline labour productivity – and in particular have no bearing on the overall productivity puzzle – they may have an impact on the relative levels and growth rates of productivity of specific industries. Finally, ONS will seek to improve estimates of jobs and hours worked in the market sector by enhancing its treatment of labour input in the NPISH sector. This may in turn permit the publication of non-market sector labour productivity consistent with the National Accounts.
3. Micro-data development and analysis
Finally, ONS has also been working to improve the availability of micro-data to develop new data sources for productivity research. Users of statistics increasingly want to look behind the headline numbers, to assess for themselves what is happening at a more detailed level. Economic micro-data, appropriately anonymised, is regarded as the key to progress in understanding economic developments in many areas. As set out in the ESAS, ONS aims to strengthen and improve the quality of micro-data within the Virtual Micro-data Laboratory (VML), to support productivity research at the firm level.
To this end, ONS is currently reviewing and updating the Annual Respondent Database (ARD) – a key dataset for productivity analysis which combines financial data with information about employment at the firm level, available to researchers within the VML. This work includes updating the ARD and ARD Register Panel to include the most recent years of business and employment surveys; updating the firm level capital stocks variable using a PIM model; and making marginal changes to gross value added (GVA) measures involving removing some identified coding errors, among others.
Further work in this area involves linking in “missing capitals” to the ARD to support multifactor productivity analysis. These “missing capitals” include firm level data on intangible investment and assets, capital services and management practices. On the latter, owing to evidence from the US on the strong links between management practices and productivity, ONS has launched a pilot survey to measure key elements of firm’s management practices. This is a new survey for the ONS and will open new doors for productivity research in this area. The pilot survey called the Management Practice Survey (MPS) covers manufacturing firms, and initial descriptive results are expected to be published in the October edition of this bulletin. Work is currently ongoing to expand the scope of the MPS to cover selected services industries in 2017. When completed, the survey data will be made available to approved researchers through the VML and Secure Data Service (SDS).
Back to table of contents