1. Introduction
Quality adjusted labour input (QALI) differs from traditional measures of labour input as it weights the hours worked by different types of workers by their relative contribution to economic production. This is calculated by categorising workers by identifiable characteristics (based on age, gender, industry of employment and education level), and weighting changes in the hours worked of each worker type by their share of total labour income. The rationale for this approach is that, under competitive markets, economic theory suggests that different factors of production (different types of workers, and different types of capital assets) will be paid reflecting their marginal productivity. There are some circumstances where this assumption would not be appropriate, such as where there is significant monopsony in employment markets, or where an industry operates as an oligopoly, as noted in O’Mahony and Timmer (2009). But in general, it is reasonable to expect that on average, more highly paid workers contribute more to production than lower paid workers.
Using a suitable weighting system, it is possible to subtract movements in hours (sometimes referred to as ‘unadjusted hours’) from movements in QALI indices, and hence to identify the pure ‘quality’ or compositional movement in labour input to production.
The main use of QALI is as an input into measuring multi-factor productivity (MFP). MFP is also known as ‘total factor productivity’, ‘disembodied technical change’, and the ‘Solow residual’. It captures changes in output which cannot be attributed to measured changes in the volume of labour or capital inputs. MFP is measured using a growth accounting framework, in which growth in economic output is decomposed into contributions from labour (both the volume of hours worked and a quality component, which together are QALI), contributions from capital services (which measures the input of different types of asset in a method analogous to QALI), and multi-factor productivity (MFP), which is captured as a residual component.
We published MFP estimates to 2013 in January 2015 (Connors and Franklin, 2015). We will publish MFP estimates to 2014, based on the QALI estimates in this article and revised and updated estimates of capital services, after the publication of Blue Book 2015.
Back to table of contents2. Interpreting these statistics
From the perspective of measuring productivity, it is the movement in QALI rather than the movement in hours worked which offer a better representation of what is happening to labour input. For example, growth in labour quality of 1% with hours unchanged, is equivalent (abstracting from distributional effects) to growth in hours worked of 1%, with labour quality unchanged.
Rounded to 1 decimal place, whole economy QALI increased at the same rate as whole economy hours worked - 2.6% - in 2014. This rounding disguises a fractional fall in labour quality which is the first fall on an annual basis since comparable QALI estimates began in 1994 and follows only a small improvement in labour quality in 2013. This continues a trend since 2010 for more of the increase in QALI to be accounted for by increased hours worked, and less to be accounted for by rising labour quality.
Changes in labour quality reflect movements in the distribution of hours worked among categories of workers, and differentials in the hourly pay of categories of workers. For example, if hours worked by a highly skilled and highly remunerated type of labour (such as brain surgeons) increased, then the volume of labour input as measured by QALI would increase by more than the observed increase in hours. Conversely, a decrease in hours worked by unskilled workers in elementary occupations who receive lower than average remuneration would result in a fall in QALI by less than the proportional decrease in hours worked.
The detailed methodology used is outlined in Acheson and Franklin (2012), and it is not repeated here, as no material changes to the QALI methodology have occurred since that publication.
To provide some context, Table 1 shows relative earnings of the main QALI aggregates. Within our QALI framework, the workforce is cross classified by industry (10 sub-categories), by education (6 sub- categories), by age (3 sub-categories) and by gender (2 sub- categories), giving a total of 360 (10*6*3*2) QALI sub categories.
Table 1: Relative hourly remuneration by QALI category
| Whole economy = 100 | 2007 | 2010 | 2014 |
| Industry | |||
| Agriculture, forestry and fishing; mining and quarrying; utilities (ABDE) | 82.8 | 72.4 | 78.6 |
| Manufacturing (C) | 94.5 | 97.1 | 100.1 |
| Construction (F) | 85.3 | 89.8 | 92.3 |
| Wholesale and retail trade; accommodation and food services (GI) | 87.7 | 88.5 | 89.8 |
| Transportation and storage (H) | 79.5 | 79.7 | 80.1 |
| Information and communication (J) | 151.5 | 148.0 | 146.5 |
| Financial and insurance activities (K) | 200.9 | 185.0 | 179.1 |
| Real estate activities; professional and scientific activities; administrative and support activities (LMN) | 86.4 | 85.4 | 81.5 |
| Public administration and defence; education; health and social work (OPQ) | 112.0 | 109.8 | 111.9 |
| Arts and entertainment; other services (RSTU) | 81.7 | 97.4 | 92.4 |
| Gender | |||
| Females | 92.5 | 92.4 | 94.3 |
| Males | 104.7 | 104.8 | 103.6 |
| Age | |||
| 16-29 years | 73.7 | 72.5 | 70.9 |
| 30-49 years | 111.7 | 110.7 | 110.1 |
| 50+ | 102.4 | 103.5 | 106.2 |
| Education | |||
| No qualifications | 65.1 | 63.5 | 67.6 |
| GCSEs or equivalent | 81.0 | 79.3 | 78.0 |
| A – levels or trade apprenticeships | 92.2 | 90.3 | 88.6 |
| Certificates of education or equivalent | 110.7 | 106.9 | 104.7 |
| First and other degrees | 133.5 | 130.1 | 125.2 |
| Masters and doctorates | 154.7 | 150.2 | 141.0 |
| Source: Office for National Statistics | |||
Download this table Table 1: Relative hourly remuneration by QALI category
.xls (129.5 kB)Table 1 illustrates that weights on individual QALI categories are not uniform, and also that weightings change over time, reflecting movements in supply and demand for different categories of labour. For example, relative remuneration in industry K (financial services) is well above the whole economy average and more than twice that of industry H (transport and storage). On average, workers in industry K have seen their average hourly remuneration decline relative to the whole economy average between 2007 and 2014, while the relative position of workers in industry H has remained roughly unchanged at around 20% below the whole economy average.
This conjunction means that, other things equal, an increase in hours worked in industry K will be reflected in an increase in labour quality (because income weights are above average), albeit at a lower rate than when earnings weights were higher still. By contrast, an increase in hours worked in industry H will be reflected in a fall in labour quality, other things equal, because weights are below average.
Similarly, workers with no qualifications earn on average around half the hourly remuneration of workers with masters and doctorates, although the earnings gap between those with no qualifications and those with masters and doctorates has narrowed since 2007.
Detailed analysis of employment rates and under-employment for workers of differing educational attainment can be found in a recent ONS article ‘Qualifications and Labour Market Participation in England and Wales’ (ONS, 2014a). This publication shows that proportionally more workers with no qualifications tend to work part time, and these workers have relatively low participation rates.
Looking at age, generally, age is seen as a proxy for on the job experience. This is reflected by higher relative pay between those aged 30-49 than those aged between 16-29. The lower relative remuneration for the 50+ group is usually interpreted as better paid workers being able to retire earlier, while lower paid workers will work for longer. Another interpretation, at least for industries which are physically demanding, such as some sub sections of construction, manufacturing and the other production industries, is that workers may become less physically able with age and consequently have lower marginal productivity.
The gender earnings gap can be seen as a reflection of earnings being correlated with experience and seniority, with females on average (and historically) being subject to more time out of the labour market due to child rearing. Cross classifications of age and gender provide some support for this view, as on average income differentials for males and females are narrower for the younger age group and wider for the older age groups.
What's new?
This edition incorporates Census 2011 revisions to LFS estimates (ONS, 2014b) and Blue Book 2014 revisions to industry-level labour income. Census 2011 revisions go back to mid-2001, while the Blue Book revisions go back to the start of the QALI series in 1993.
In addition, this edition reports results from a 'what if' sensitivity analysis in which QALI education categories are replaced with an alternative breakdown of education qualifications as currently used in ONS estimates of the value of human capital.
What's next?
We have started a full review of the QALI system, covering data sources, seasonal adjustment and all aspects of QALI methodology. A full report will be published on the findings of this review at a later date. As always, we welcome comments from users, which can be addressed to productivity@ons.gov.uk.
Back to table of contents3. Results: Whole Economy and Market Sector
Figure 1: Whole economy, annual QALI growth
Source: Office for National Statistics
Download this chart Figure 1: Whole economy, annual QALI growth
Image .csv .xlsFigure 1 shows the annual (log) changes in QALI and the contributions of unadjusted hours and labour quality, between 1994 and 20141. As noted above, the slight negative contribution of labour quality in 2014 is unprecedented, although it has no material impact on overall QALI growth. A possible reason why labour quality growth has stagnated over 2014 could be due to strong growth in hours worked of the youngest QALI age category, 16-29, which experienced the strongest growth since QALI records began in 1993. Age is used as a proxy for experience, and those who are younger and at the start of their career typically have a lower wage. This has been combined with stronger than average growth for lower QALI education groups, GCSEs and A Levels.
Figure 2: Whole economy QALI
Cumulative growth since Q1 2008
Source: Office for National Statistics
Download this chart Figure 2: Whole economy QALI
Image .csv .xlsFigure 2 shows cumulative quarterly movements of QALI, unadjusted hours and labour quality from the first quarter of 2008. At the end of 2014, QALI was nearly 11 percentage points (pps) higher than before the start of the economic downturn. Labour hours growth and labour quality growth each accounted for around half of the QALI growth over the period. The trend in QALI growth has been steadily growing since 2011, but strong growth in hours coupled with little to no growth of labour quality over 2013 and 2014 has changed substantially what is driving QALI growth. To emphasise this, in the last quarter of 2012, labour quality accounted for over 80% of QALI growth since the downturn.
Figure 3: Market sector QALI
Cumulative growth since Q1 2008
Source: Office for National Statistics
Notes:
- Q1 refers to Quarter 1 (January to March).
Download this chart Figure 3: Market sector QALI
Image .csv .xlsFigure 3 shows equivalent estimates for the market sector, defined as that part of the economy where output is sold at economically meaningful prices, and broadly (though not exactly) equivalent to the private sector. Comparing figures 2 and 3, labour quality has increased a little less fast in the market sector than across the economy as a whole, and it took roughly a year longer for market sector hours worked to recover to the pre-downturn level.
Over 2014, Market Sector QALI grew by 3%, which was driven by a record increase in hours in the market sector of 3.1 pps and dampened slightly by a fall in labour quality of 0.1 pps. Unlike the whole economy, market sector labour quality has fallen in four years since 1994, the last of which was in 2008 where labour quality fell by 0.3 pps.
Notes for results: Whole Economy and Market Sector
- Annual and quarterly QALI estimates back to 1994 are available in the reference tables (148 Kb Excel sheet) of this release.
4. Results: Industry
The following section looks at QALI by industry. Changes in labour quality by industry reflect compositional and relative income movements within a single industry, which themselves are reflective of changes in the education, age and gender makeup of workers in that industry. Annualised QALI results by industry are a primary input used to derive MFP estimates.
Figure 4: QALI growth by Industry, 2014

Source: Office for National Statistics
Notes:
- ABDE: Agriculture; Forestry & fishing; Mining & quarrying; Utilities C: Manufacturing F: Construction GI: Wholesale & retail trade; Accommodation & food services H: Transportation & Storage J: Information & communication K: Financial & insurance activities LMN: Real estate activities; Professional & scientific activities; Administrative & support activities OPQ: Public administration & defence; Education; Health & social work RSTU: Arts & entertainment; Other services WE: Whole Economy MS: Market Sector.
Download this image Figure 4: QALI growth by Industry, 2014
.png (20.0 kB) .xls (225.3 kB)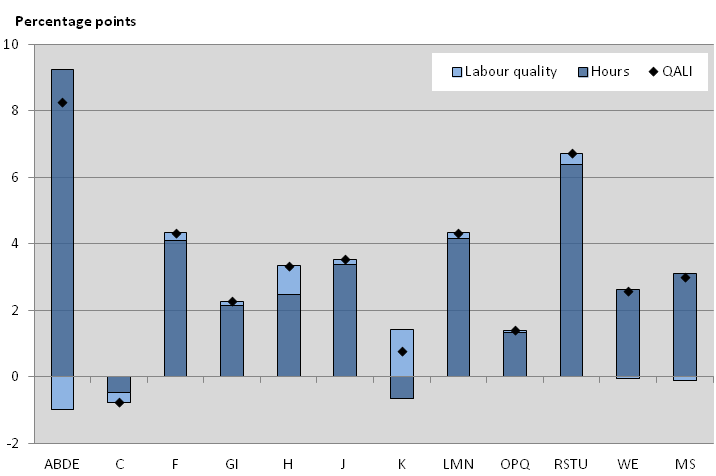
Figure 4 shows the breakdown of QALI growth and its components, by industry for 2014. Growth in QALI varies by industry, but most have experienced strong growth. Growth in hours worked was the main driver of QALI in most industries, except for industry K (financial services), which was one of only two industries to experience a fall in hours worked. In industry K, growth in QALI was solely driven by a strong positive contribution from labour quality.
The other industry to experience negative growth in hours was industry C (manufacturing) which, coupled with a negative contribution from labour quality of 0.3 pps, led to a negative movement in QALI. In general, the long term trend for manufacturing hours worked has been downward; however, labour quality has steadily improved since 1993 and it is only in the last 2 years that labour quality has turned negative.
The largest growth in QALI was in industries ABDE (agriculture, forestry and fishing; mining and quarrying; utilities) which was driven by strong hours growth of 9.2 pps, but was hampered a negative contribution from labour quality of 1.0 percentage point, the largest fall of any industry. The ABDE aggregate is heterogeneous in that it includes agriculture, where incomes tend to be low and volatile, and mining and quarrying, where incomes are high and volatile as well as utilities.
RSTU (arts and entertainment; other services) also experienced strong QALI growth in 2014 (6.7%), again accounted for mainly by growth in hours (6.4 pps). This is the strongest growth in hours worked in this industry since QALI records began in 1994.
Figure 5: QALI growth by Industry, 2008-2014
Annual averages

Source: Office for National Statistics
Notes:
- See Figure 4 for x-axis categories.
Download this image Figure 5: QALI growth by Industry, 2008-2014
.png (19.5 kB) .xls (225.3 kB)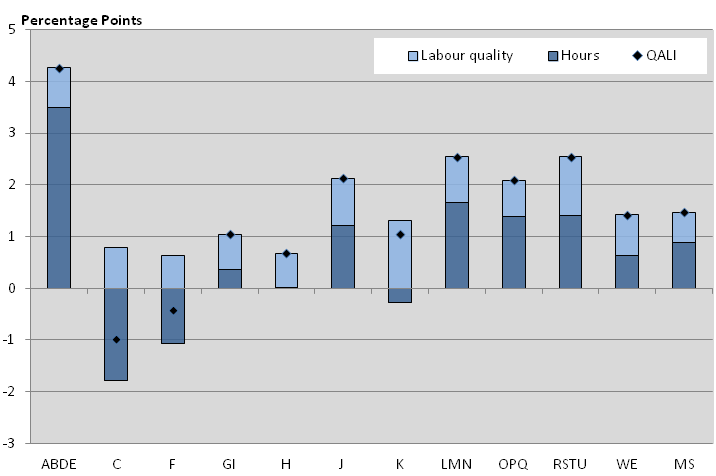
Figure 5 displays average annual QALI growth by industry between 2008 and 2014, that is, since the economic downturn. In contrast to the 2014 estimates, labour quality has been positive across all industries and has driven QALI growth more than hours for 4 out of the 10 industries in the QALI framework.
Industry K has seen the strongest average annual contributions from labour quality (1.3 pps). Strong labour quality contributions have meant that QALI has remained above its pre downturn level, despite falling hours worked.
Changes to hours worked has varied across industries, with ABDE recording the largest growth in hours worked. Hours worked in industries C, F (construction), and K declined during the period, though construction hours worked have shown strong growth in the past 2 years.
Industry F has seen average quality improvements of 0.6 pps since 2008, which is double the pre downturn average for this industry of 0.3 pps (see figure 6). This is notable, as typically, little change in labour quality occurs in the construction industry, largely owing to the fact that it is a physical labour intensive activity with little opportunity for substitution towards more skilled categories of labour.
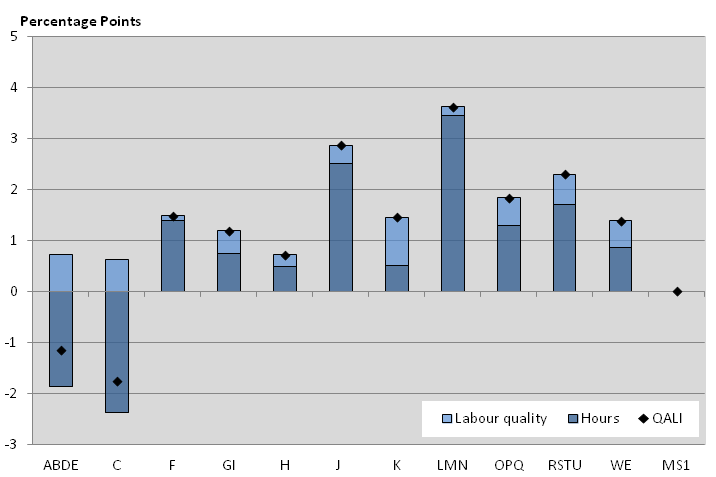
Figure 6: QALI growth by Industry, 1994-2007
Annual averages
Source: Office for National Statistics
Notes:
- See Figure 4 for x-axis categories.
- Market sector average in 1995-2007.
Download this image Figure 6: QALI growth by Industry, 1994-2007
.png (19.4 kB) .xls (225.3 kB)
Figure 6 shows equivalent estimates for 1994 to 2007, which includes all periods prior to the economic downturn for which data exist. While labour quality grew for all industries over the period, growth rates were smaller than those in figure 5. For example, industry GI (Wholesale and retail trade; accommodation and food services) experienced similar levels of QALI growth in both period in figures 5 and 6, but in the period prior to the downturn growth in QALI is mainly driven by growth in hours, yet after 2008 labour quality is the main QALI contributor.
Industry LMN (real estate activities; professional and scientific activities; administrative and support activities) experienced the largest rise in QALI (3.3%), driven almost entirely by growth in hours over the period (2.9 pps). This industry aggregate is heterogeneous, containing highly skilled professional and scientific activities with medium skilled real estate activities and lower skilled administrative and support activities.
Also of note is the difference in QALI growth composition in industries ABDE and C in the years prior to the downturn and after. In contrast to the period shown in figure 5, before the downturn industries ABDE were experiencing declining hours worked, and thus QALI, whereas since the downturn they have experienced strong growth in hours. Similarly, industry C, has seen a slower decline in hours since the downturn, and a rise in average growth in labour quality.
Back to table of contents5. Results: Education, age and gender
Educational attainment is a key variable used in identifying differences in human capital. It is seen as an implicit process by which workers gain the knowledge and skills to be more productive through gaining qualifications. In economic theory, it is also seen as being a signal to employers that workers able to attain a higher qualification would be more capable and consequently more productive, as the ‘psychic costs’ of gaining a qualification would be lower for a more capable worker than for a less capable worker. In either case, it is apparent that higher qualifications are well correlated with relative earnings (see Table 1 above) and modern growth theory assumes that human capital facilitates innovation, and that higher levels of educational attainment can put an economy onto a permanently higher growth path.
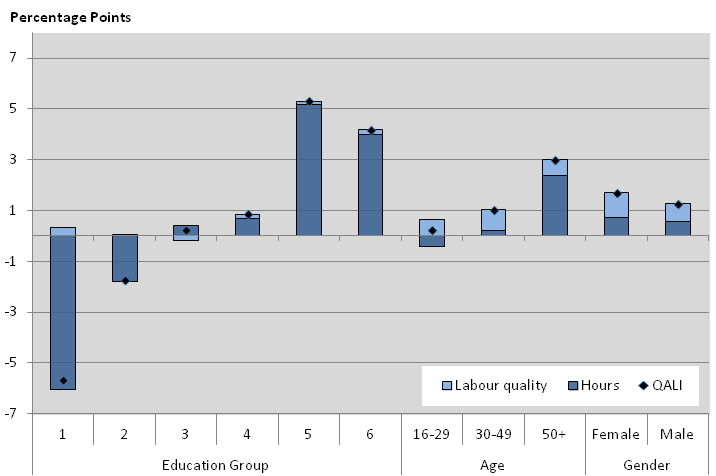
Figure 7: QALI growth by Education, Age, and Gender, 2014

Source: Office for National Statistics
Notes:
- Key to Education Groups: 1: No qualifications 2: GCSEs or equivalent 3: A–levels or trade apprenticeships 4: Certificates of education or equivalent 5: First and other degrees 6: Masters and doctorates.
Download this image Figure 7: QALI growth by Education, Age, and Gender, 2014
.png (17.9 kB)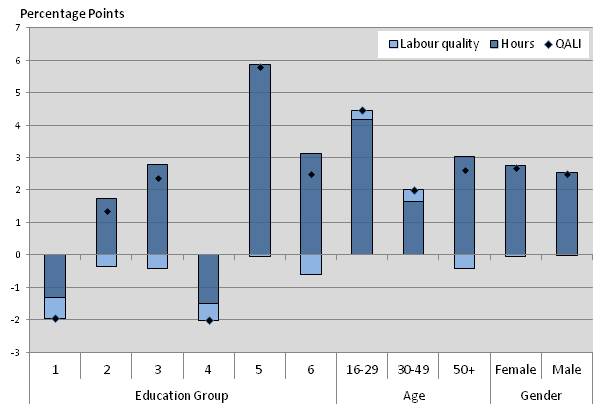
As noted in previous publications of QALI, there has been a substantial increase in the share of hours worked by people with higher qualifications since the start of the QALI series in 1993. In 2014, this trend continued as hours worked grew by near 6% for those with degrees, and over 3% for those with masters or doctorates (see figure 7). In contrast, workers without any qualifications (education group 1), saw hours fall by 1.3 pps in 2014, which has continued a falling trend in hours worked seen since the QALI series began in 1993. Labour quality for the same category fell for the first time since 2009, by 0.6 pps.
Workers whose highest qualifications are GCSEs and A-Levels (education groups 2 and 3 respectively), experienced strong QALI growth in 2014, which was driven by increasing hours but dampened by slight falls in labour quality. Workers whose highest qualifications are A-Levels, experienced growth in hours of 2.8 pps, which is the largest growth in hours worked on record. Annual hours growth in this education group has been stronger on average since the most recent economic downturn (figure 8) than prior to this downturn (figure 9).
Workers whose highest qualifications are GCSEs have also experienced growth in hours in 2014 of 1.7 pps. This follows on from five consecutive years of negative growth in hours, and is the strongest growth in both hours and QALI since 2005.
Figure 8: QALI growth by Education, Age and Gender, 2008-2014
Annual averages
Source: Office for National Statistics
Notes:
- See Figure 7 for x-axis education categories.
Download this image Figure 8: QALI growth by Education, Age and Gender, 2008-2014
.png (20.1 kB) .xls (225.3 kB)
Age is included in QALI as a proxy for experience. Trends in average annual QALI growth both prior and post the downturn were little changed across all age groups. What is notable is the change in what is contributing to QALI movements. Growth in QALI has been mainly accounted for by growth in labour quality, rather than growth in hours in the period since the downturn. In 2014, however, all age groups have experienced strong growth in hours, particularly in those ages 16 – 29. The trend for this age group is low hours growth, but in 2014 growth in hours worked was the largest since QALI records began in 1993.
Similarly, those aged over 50 have experienced a strong rise in hours over the last 3 years, however, labour quality fell slightly in 2014 (-0.4 pps), which is the first fall in labour quality since 1997.
Figure 9 : QALI growth by Education, Age, and Gender, 1994-2007
Annual averages

Source: Office for National Statistics
Notes:
- See Figure 7 for x-axis education categories.
Download this image Figure 9 : QALI growth by Education, Age, and Gender, 1994-2007
.png (19.7 kB) .xls (225.3 kB)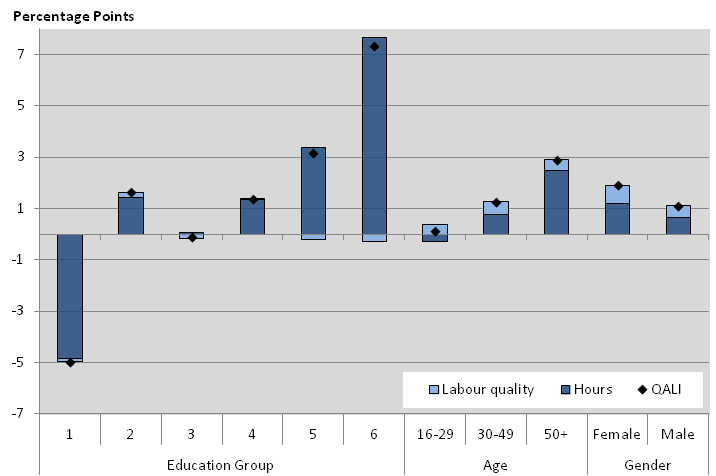
As noted in previous QALI articles, the use of gender to stratify the workforce in QALI is not intended to imply ‘quality’ differences in male and female labour, but rather is used to reflect the empirical differences in earning between males and females. Males account for a larger share of hours than females, the picture for both QALI and hours worked for males is very similar to that of the whole economy. In 2014, both genders experienced similar growth in hours, and no growth in labour quality. Stagnant labour quality growth implied there has been little compositional change within each gender over the past year in terms of the other QALI categories of industry of employment, age and educational attainment.
Back to table of contents6. Revisions
For QALI, the main sources of revisions are from revisions to the hours and income benchmarks (which come from our Labour Productivity and Unit Labour Cost systems respectively), revisions to the LFS source data, and methodological changes.
Figure 10 shows differences in log changes between the current whole economy QALI estimates and equivalent estimates published in the 2014 edition (Franklin and Murphy, 2014). Revisions largely reflect the adoption of Blue Book 2014 income benchmarks and reweighting of Labour Force Survey (LFS) data for Census 2011.
Figure 10: Revisions to whole economy QALI growth
Differences between current and previous estimates
Source: Office for National Statistics
Download this chart Figure 10: Revisions to whole economy QALI growth
Image .csv .xlsBlue Book 2014 revisions to income benchmarks occur back to the beginning of the time series. The effects of these revisions are discussed in greater detail in the last Multi-factor Productivity release (Connors and Franklin, 2015). LFS Census 2011 reweighting revisions occur back to the second half of 2001, and the size of the revisions increase in magnitude from 2001 onwards to reflect revised estimates of the working population. See ONS (2014b) for more information.
The revisions from both of these impacts do not cause any fundamental changes to the interpretation of previously published trends in whole economy QALI. Figure 10 shows the impact of revisions in terms of differences in quarterly growth rates. There is no clear trend, and the largest component is generally from revisions to growth of hours worked.
There are larger revisions to some QALI sub-aggregates. For example, labour quality growth has been revised upwards for industry group ABDE between 2008 and 2013. And there have been some large revisions in certain QALI aggregates in individual years, such as a 0.2 percentage point downward revision to labour quality of the 16-29 age cohort in each of 2012 and 2013.
Back to table of contents7. Sensitivity test on education groupings
It is reasonable to suppose that movements in labour quality will be reflected in changes to the stock of human capital, defined by the OECD as “the knowledge, skills, competencies and attributes embodied in individuals that facilitate the creation of personal, social and economic well-being" (OECD, 2001). We have recently started publishing estimates of the value of UK human capital, as part of a series of new Economic Well-being measures.
Currently, our human capital and QALI systems use 2 different breakdowns of the workforce by education. This section looks at how QALI estimates would be affected by adopting the education groups used in the human capital system. This provides a sensitivity test of the role of education groupings in our current QALI estimates.
The human capital education groups use the same number of sub sections as the QALI education groups, this is beneficial as QALI already splits the workforce into 360 categories and including further groups would risk unreliably small sample sizes of groups. There are two key differences between the different education groupings. Firstly, QALI uses one education group for all ‘GCSEs or equivalent’ whilst, the Human Capital measure breaks this down into ‘GCSEs Grade A*-C or equivalent’ and ‘other qualifications’. Secondly, the human capital system uses one education group for qualifications above first degree, whilst QALI breaks these down into ‘first and other degrees’ and ‘masters and doctorates’.
Table 2: Share of total pay and hours by education groups, 2014
| Pay | Hours | |
| Current QALI education groups | ||
| No qualifications | 4% | 5% |
| GCSEs or equivalent | 22% | 28% |
| A – levels or trade apprenticeships | 21% | 23% |
| Certificates of education or equivalent | 10% | 10% |
| First and other degrees | 30% | 24% |
| Masters and doctorates | 14% | 10% |
| Human Capital education groups | ||
| No qualification | 4% | 5% |
| Other Qualification | 6% | 9% |
| A*-C GCSE or equivalent | 16% | 19% |
| A level or equivalent | 21% | 23% |
| Higher Education | 10% | 10% |
| Degree or equivalent | 44% | 34% |
| Source: Office for National Statistics | ||
Download this table Table 2: Share of total pay and hours by education groups, 2014
.xls (150.0 kB)Table 2 gives the share of total pay and hours of each education group in the 2 breakdowns. Of the QALI all ‘GCSEs or equivalent’ group, those who get A*-C make up over two-thirds of the hours share and nearly three-quarters of total pay. Similarly, of the amalgamated human capital ‘degree or equivalent’ group, ‘first and other degrees’ account for around two-thirds in each. It is noticeable however, that the amalgamated group makes up a significantly large proportion of total pay.
Table 3: Relative hourly remuneration by different education categories
| Whole economy = 100 | 2007 | 2010 | 2014 |
| Current QALI education groups | |||
| No qualifications | 65.1 | 63.5 | 63.8 |
| GCSEs or equivalent | 81.0 | 79.3 | 78.0 |
| A – levels or trade apprenticeships | 92.2 | 90.3 | 88.6 |
| Certificates of education or equivalent | 110.7 | 106.9 | 104.7 |
| First and other degrees | 133.5 | 130.1 | 125.2 |
| Masters and doctorates | 154.7 | 150.2 | 141.0 |
| Human Capital education groups | |||
| No qualification | 65.1 | 63.6 | 67.9 |
| Other Qualification | 77.6 | 76.3 | 72.4 |
| A*-C GCSE or equivalent | 82.7 | 80.6 | 80.6 |
| A level or equivalent | 92.1 | 90.4 | 89.0 |
| Higher education | 110.6 | 106.9 | 104.9 |
| Degree or equivalent | 140.4 | 136.8 | 130.3 |
| Source: Office for National Statistics | |||
Download this table Table 3: Relative hourly remuneration by different education categories
.xls (33.8 kB)Table 3 compares relative hourly remuneration of the two education groupings and it is clear differences exist between them. Those who attain A*-C GCSEs receive higher remuneration than those in the ‘other qualifications’ category, and the remuneration gap between the 2 has been growing since 2007. Similarly, large differences exist in remuneration between those who have a first degree and those that have a masters or doctorate. However, the earnings gap between the 2 groups has been closing since 2007.
Figure 11 and 12 show the differences in QALI growth, relative to 1997, for the GCSE education groups and the degree and higher education groups.
Figure 11: QALI by GSCE Education Groups
Source: Office for National Statistics
Download this chart Figure 11: QALI by GSCE Education Groups
Image .csv .xlsFigure 11 shows that the trend in QALI for those that obtain A*-C GCSEs is very different to those that achieve below that. QALI has been falling for those in the ‘other qualifications’ category, and the trend in more similar to that of the ‘no qualifications’ category, although with a less severe decline overall. Like the ‘no qualifications’ category, there has been little quality improvement over this period. Conversely, QALI for those that achieve A*-C GCSEs has grown since 1997, including sustained labour quality improvement. There looks to be a possible trade off between the 2 categories, for example, a steep rise in QALI in 2004 and 2005 for ‘A*-C GCSEs’, was accompanied by a fall of a similar amount in ‘other qualifications’. Again, in 2011 there was a sharp drop in QALI for the ‘other qualifications’ cohort, and a smaller but still pronounced pick up in QALI for the better qualified group.
Figure 12: QALI by First Degree and Higher Education Groups
Source: Office for National Statistics
Download this chart Figure 12: QALI by First Degree and Higher Education Groups
Image .csv .xlsFigure 12 may appear to show less divergent QALI trends than those seen in figure 11, although the scale of the y-axis is very different. Both categories, ‘first and other degrees’ and ‘masters and doctorates’ have seen sustained upward QALI trajectories, although for those in the latter category the growth is noticeably larger. There is more volatility in the masters and doctorates category, which could possibly suggest a small sample size or some seasonality. In terms of labour quality, both categories have experienced negative labour quality movements over the period, although slightly less so for those with only first degrees. As a result, all the growth in QALI is accounted for by growth in hours.
Ideally, we would want to capture the effects of both expanding the GCSEs education group and the above degree education group, however, given the constraint of the LFS sample size we can only stretch the sample so far and it may not be practical to include an extra education group. What this does do is lay open to discussion whether we should be breaking down GCSEs rather than higher education, or if we should include ‘other education’ in with no qualifications. This is an issue on which we would welcome comments from users.
Back to table of contents